
Visualization of Gefitinib and Related Metabolites in Rat Liver Using DESI-Tandem Quadrupole Mass Spectrometry
Robert Plumb, Anthony Midey
Waters Corporation, United States
Published on August 07, 2026

Abstract
Detection and measurement of drugs, their metabolites, and biomarkers in tissues plays a key role in the drug discovery and development process, providing information on drug distribution, organ penetration, and drug accumulation. This application note demonstrates the use of tandem quadrupole Desorption Electrospray Ionisation Mass Spectrometry (DESI-MS) Imaging, operated in multiple reaction monitoring (MRM) mode, to visualize gefitinib and related metabolites in the liver following single subcutaneous administration to rats. Gefitinib and seven drug related metabolites were detected in liver, with a clear time related profile observed for gefitinib, the N-oxide, and the morpholino carbonyl metabolites of gefitinib matching the plasma pharmacokinetic profile.
Benefits
- Simple implementation of DESI-MS Imaging on the Xevo™ TQ Absolute XR tandem quadrupole Mass Spectrometer
- Sensitive, selective detection of drug substrate and its metabolites without the need for radio labeled isotope version of the drug
- Simple workflow from discovery metabolite profiling to DESI-MS Imaging
- Alignment with 3Rs principle removing the need for dedicated animal study
Introduction
Determination of the tissue distribution of a drug is an essential part of the preclinical drug development process, facilitating the understanding of tissue penetration, extent of exposure and drug accumulation 1,2 This is normally achieved via the administration of a radio labeled version of the drug molecule and visualization via whole body autoradiography.3 Although this approach is highly quantitative, it does not provide information on the chemical nature of any metabolite containing the radio labeled isotope nor does it allow for the visualization of changes in biomarkers of secondary (off target) pharmacology or toxicity. The need for a radio labeled isotope version of the drug also precludes its use in drug discovery or early development studies, and requires an additional study.
Drug analysis in tissue by mass spectrometry offers the potential to remove the requirement for a radio isotopic version of the drug molecule. Thus, making it possible to investigate drug, metabolite, and biomarker tissue spatial distributions in in vivo drug discovery studies. DESI-MS Imaging has shown promise for the detection of endogenous metabolites, lipids, and proteins as well as the disposition of drug related material in tissue samples (brain, liver, kidney etc.).4 However, the low doses employed in drug discovery studies (1–10 mg/Kg) combined with the presence of contaminant background ions e.g., dosing vehicle and endogenous compounds, precludes de novo in-tissue metabolite detection5 via high resolution mass spectrometry.
This application note illustrates the use of DESI-MS Imaging with tandem quadrupole Mass Spectrometry, operated in MRM, to investigate the drug disposition in the liver following the single subcutaneous administration of the tyrosine kinase inhibitor gefitinib (Iressa®) to male rats.
Experimental
Sample Description
Ten male sprague dawley rats, aged 7–9 weeks (175-225g) were divided into two groups and dosed subcutaneously with either gefitinib (N-(3-chloro-4-fluorophenyl)-7-methoxy-6-[3-(4-morpholinyl)propoxy-1,1,2,2,3,3-d6]-4-quinazolinamine) at 10 mg/Kg, or vehicle only. Following termination, livers from a single rat from each group were collected (0, 1, 3, 8 and 24 hours post dose), weighed and frozen, and stored at -80 °C until analysis. The study was performed under UK Home Office License PP9552589 Protocol 2-Pharmacokinetic Study, following full management and local ethical committee review.
Method Conditions
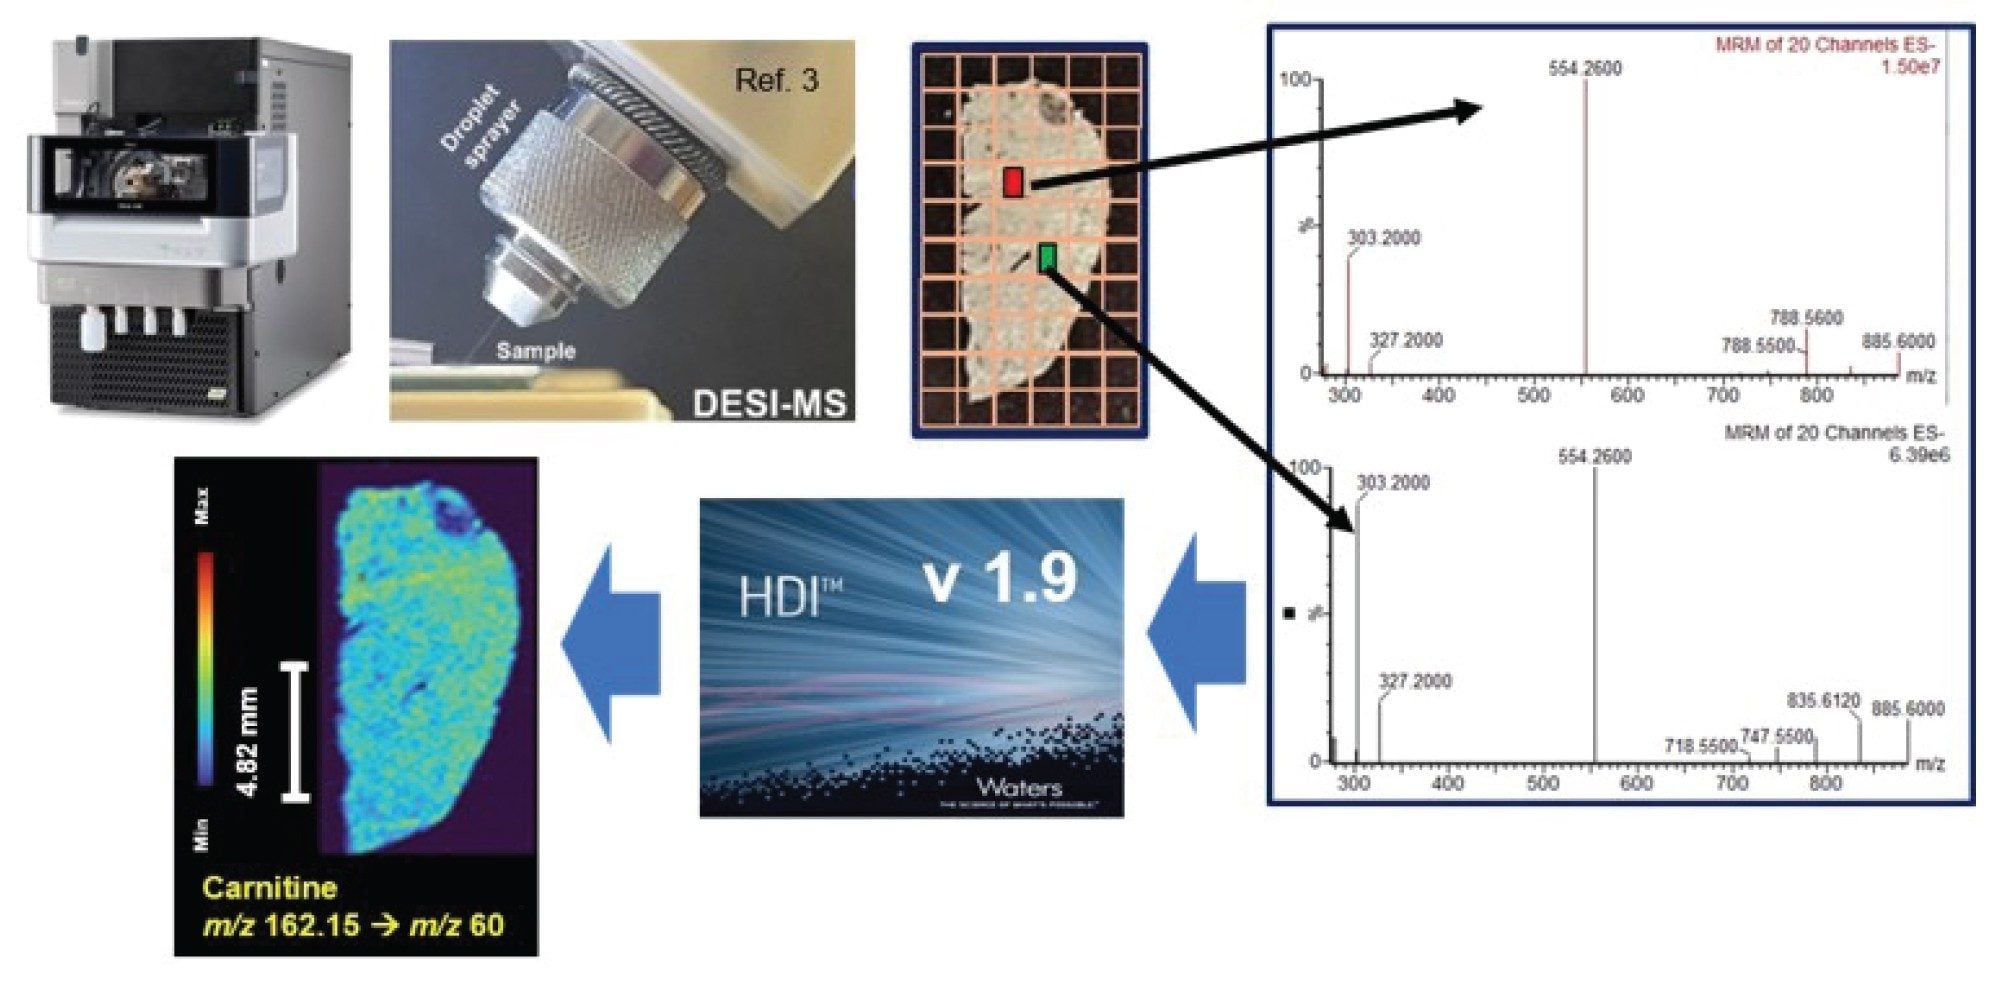
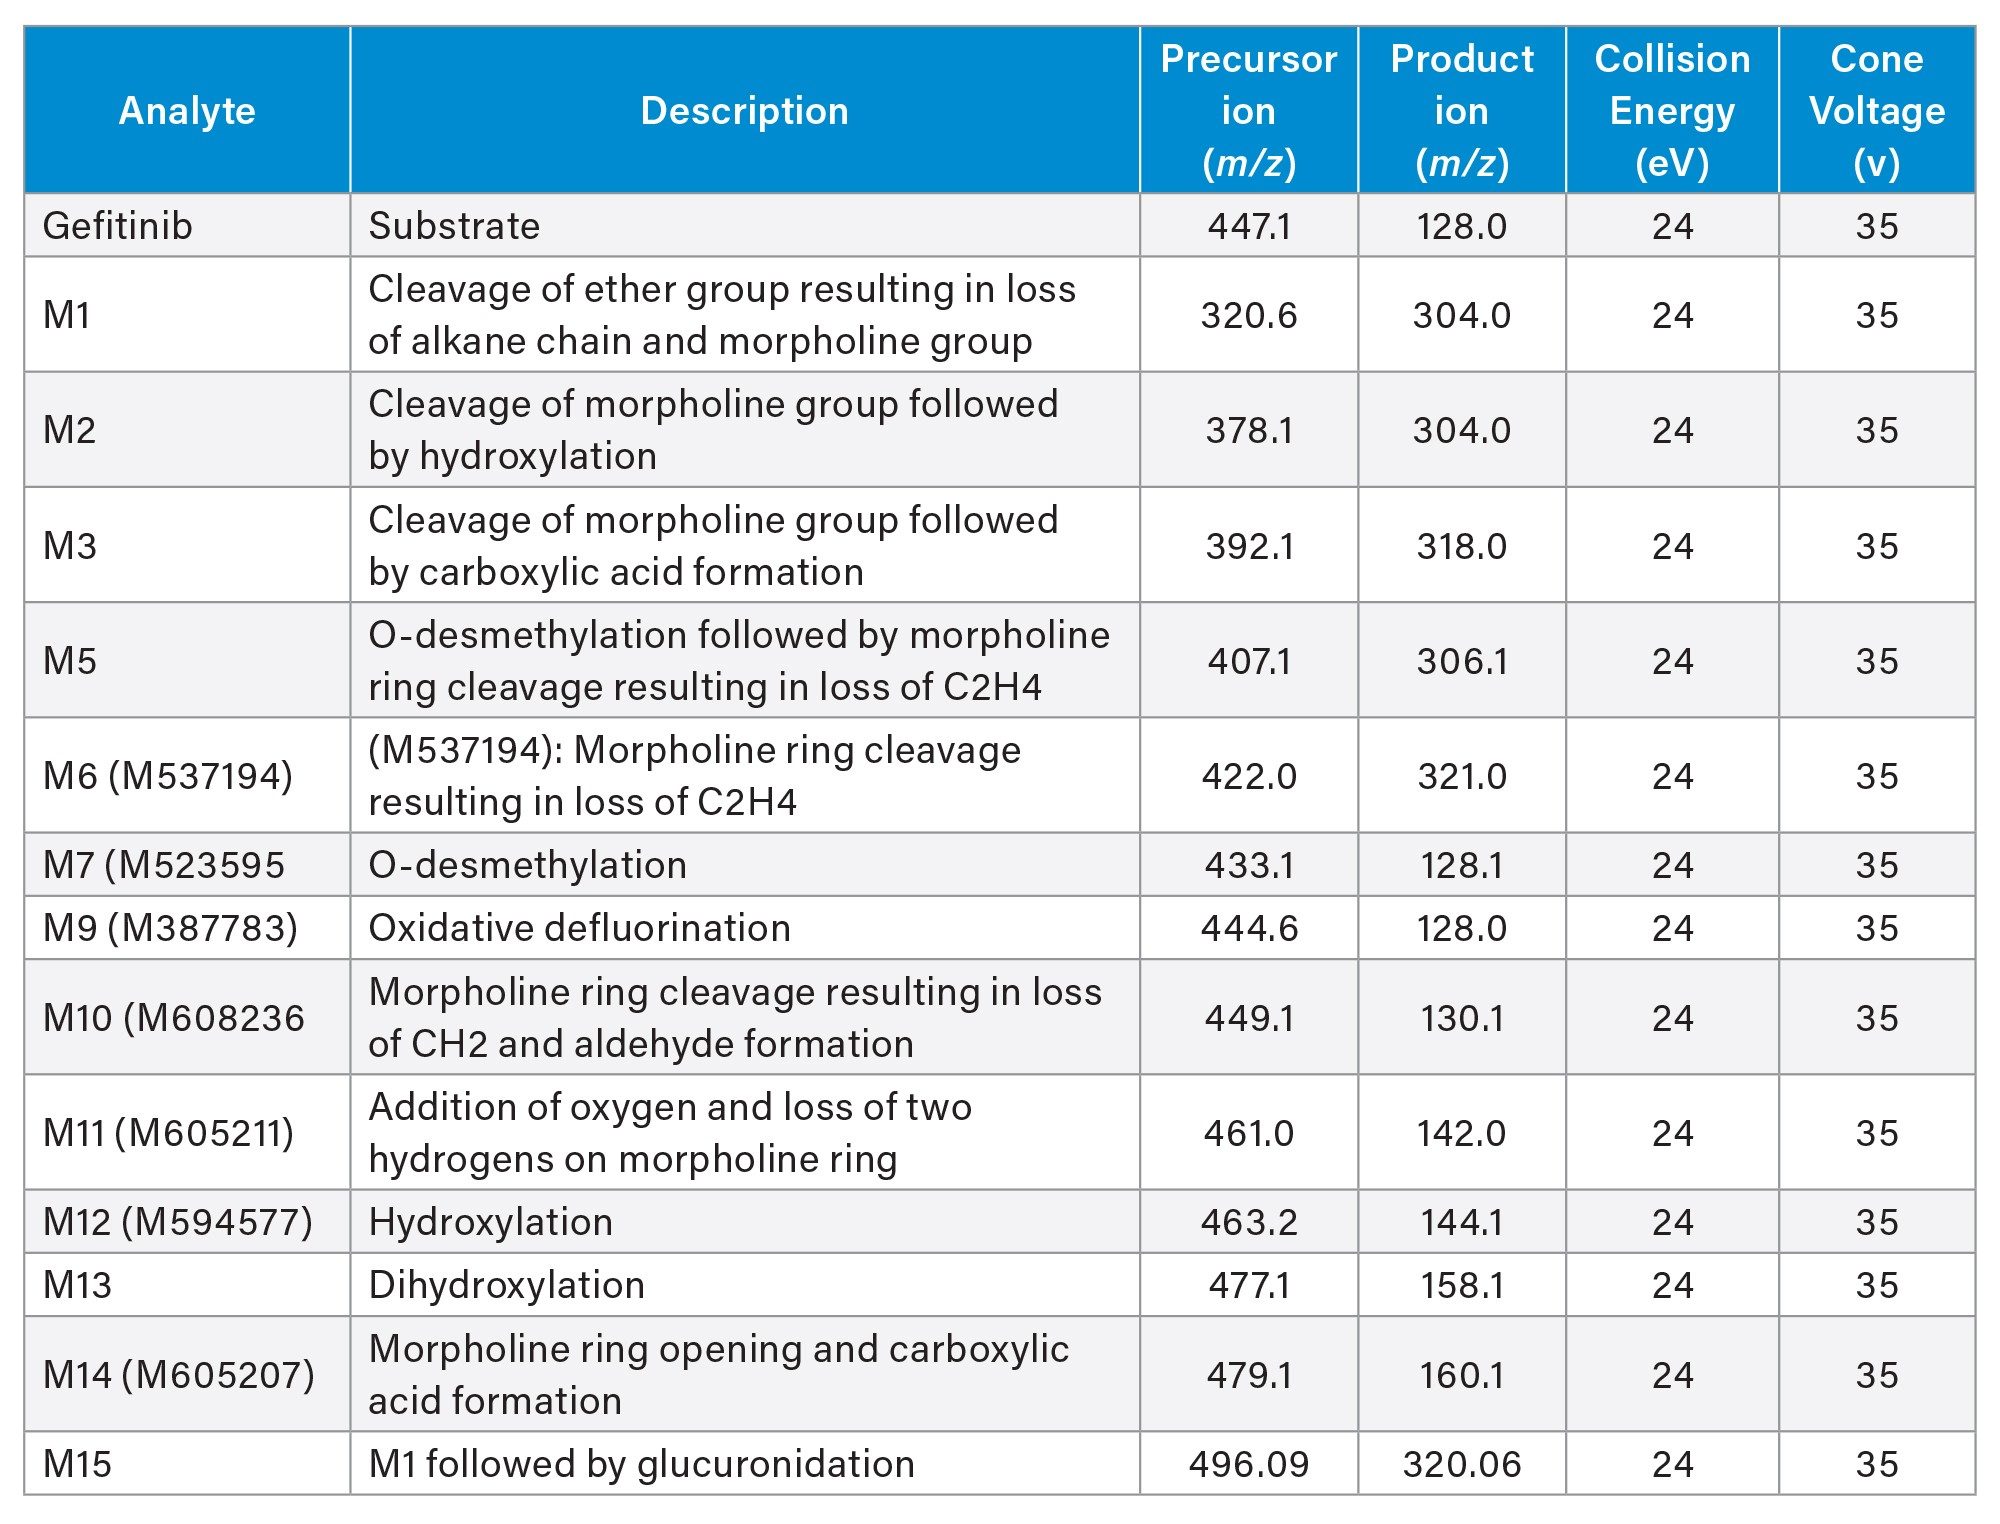
Fresh frozen rat liver tissue sections (predose, and 1, 3, 8 and 24 hours post dose) were cryosectioned (10 µm), then thaw-mounted on standard glass specimen slides (Epredia™ Shandon™ Colorfrost, Fisher Scientific, USA) using an Epredia HM525 NX Cryostat (ThermoFisher, USA). The slides were stored at -80 °C until use, then thawed for 15 minutes in a vacuum desiccator prior to MS imaging data acquisition. DESI-MS Imaging was performed with a Xevo TQ Absolute XR tandem quadrupole Mass Spectrometer equipped with a DESI XS source (Waters Corporation, UK), using the MRM transitions listed in Table 1. The DESI MSI data were acquired using a pixel size of 60 µm, with a nominal spray diameter of 30 µm, with acquisition speeds of 1 and 10 Hz. The spray impact angle was set at 75 ˚C, with a sprayer nozzle to surface distance of 2 mm, and ion inlet tube orifice diameter of 6 mm2. The MS imaging data were visualized using High Definition Imaging (HDI™) Software (Waters Corporation). The targeted imaging workflow solution is illustrated in Figure 1.
MS Conditions
|
MS system: |
Xevo TQ Absolute XR Mass Spectrometer |
|
Ionization mode: |
DESI +ve ion ESI |
|
Acquisition range: |
MRM |
Data Management
|
MS software: |
MassLynx™ Software |
|
Informatics: |
High Definition Imaging (HDI) Software |
*Note 5: Specify version for each software.
Results and Discussion
The pharmacokinetics and metabolism of gefitinib were previously reported.6,7 These studies revealed that gefitinib undergoes extensive oxidative metabolism, mainly via CYPs 3A4, 3A5 and 2D6 at several sites, resulting in oxidation of the morpholine ring, defluorination, O-demethylation, and combinations thereof. In some cases, these functionalization biotransformations were further modified by subsequent conjugation to form sulfate or glucuronide conjugates. In the plasma samples from this study, the metabolites detected were the O-desmethyl-gefitinib (M523595), morpholino carbonyl metabolite (M605211), desfluorophenol (M387783), and M537194 formed via ring-opening and partial degradation of the morpholine ring. The drug itself formed the major circulating drug-related species, followed by the O-demethylated (M523595), and morpholino carbonyl (M605211) metabolites. Pharmacokinetic data analysis showed that peak plasma concentrations of the drug were observed at ca. 6 hours post dose (ca. 60 ng/mL) with an elimination half-life of 6.5 hours.
LC-MS/MS can be used to provide quantitative measurement of drug substrate and metabolites in tissues. However, this requires tissue extraction and homogenization, resulting in loss of spatial information, or necessitating multiple sample extractions across the tissue. DESI-MS Imaging can be quickly deployed on the Waters Xevo TQ Absolute XR Mass Spectrometer via a simple MS source change (Figure 1), requiring less than 30 minutes to switch between LC-MS and DESI-MS operation. The spatial distribution of gefitinib and its metabolites in liver samples was investigated using DESI-MS Imaging in +ve ESI mode using MRM data acquisition (Table 1).
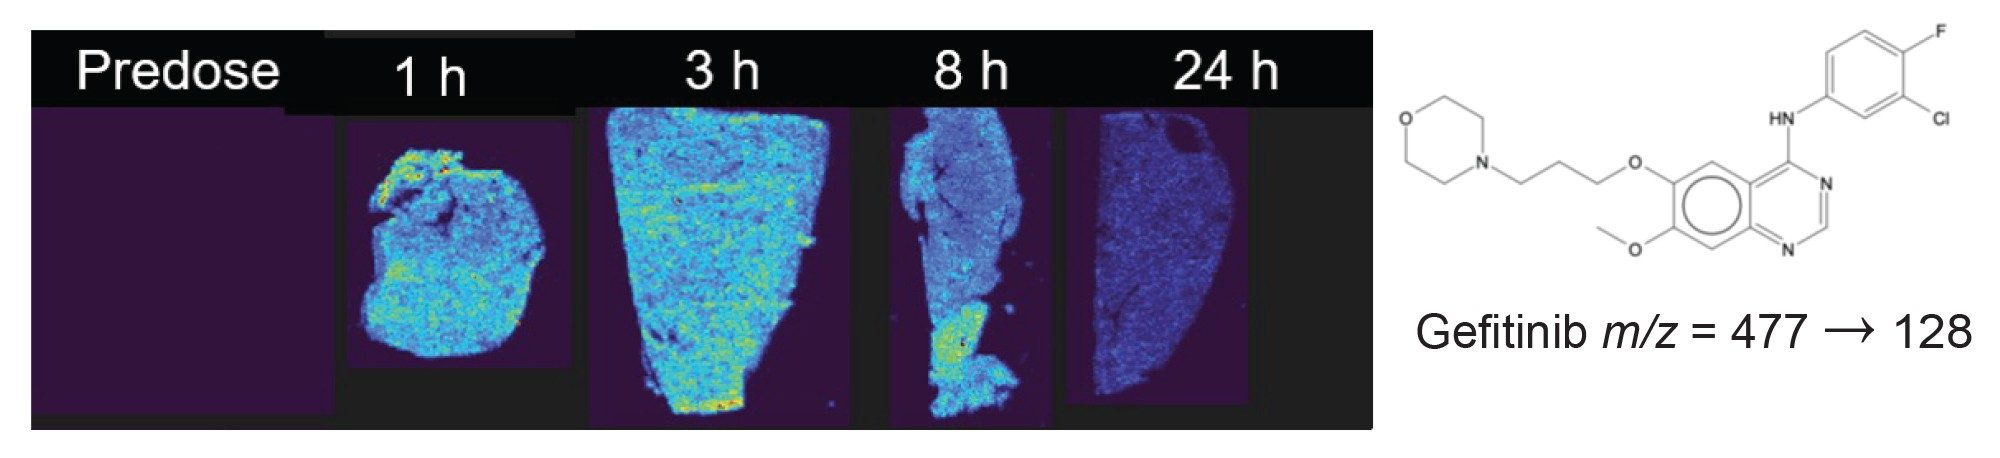
Analysis of the DESI-MS tissue imaging data showed that neither gefitinib nor any of the drug related metabolites were detected in samples from either the vehicle group or the predose liver. Gefitinib was clearly visible at high intensity in the 1 and 3 hours samples; by 24 hours post dose, the gefitinib signal, while much reduced, was still detectable at low intensity in the liver section (Figure 2) mirroring the gefitinib plasma concentration data.
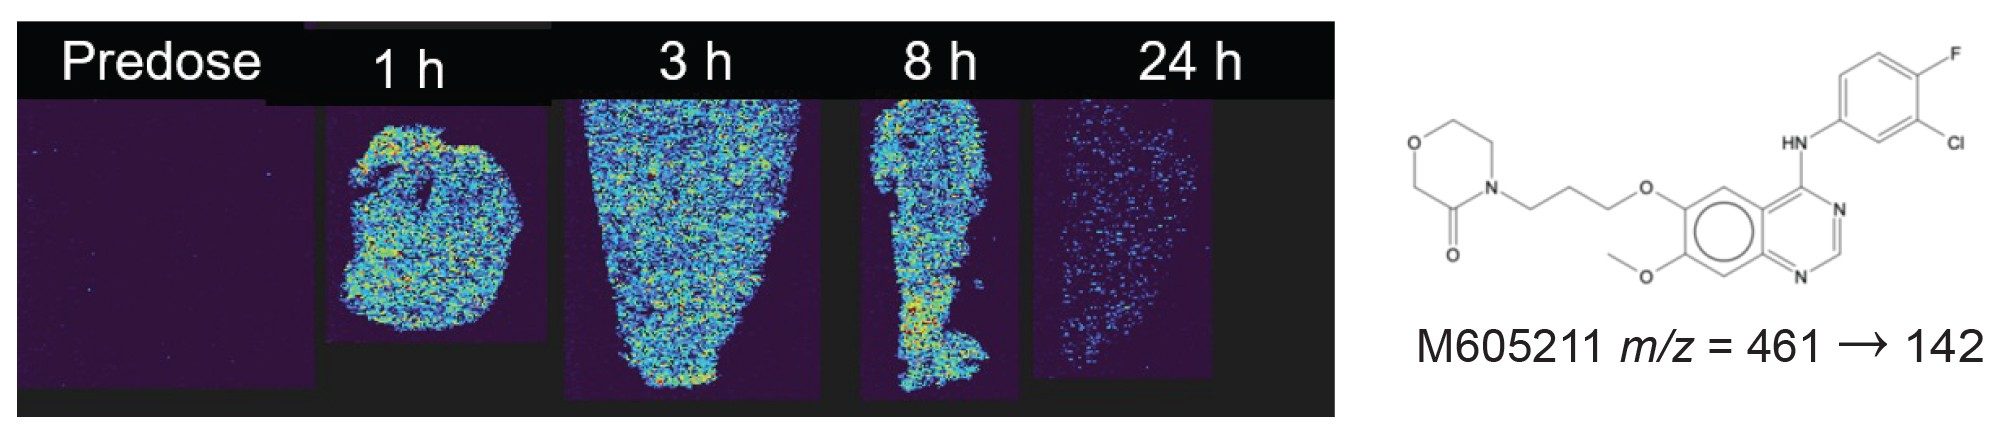
In addition to the unchanged drug compound, signals corresponding to the metabolites M2, M527194, M605211, M594557, and the dihydroxylated metabolite (M13) were also detected in the liver sections. The putative N-oxide metabolite of gefitinib (M594577) provided the most intense response of all the drug-related species detected, followed by gefitinib, and then morpholino carbonyl metabolite M605211. The maximum signal intensities for metabolites M605211 and M594577 were observed in the 1 and 3 hours sections, subsequently declining in the 8 hours samples, and being only weakly detected in the 24 hours samples, as seen in Figures 3 and 4.
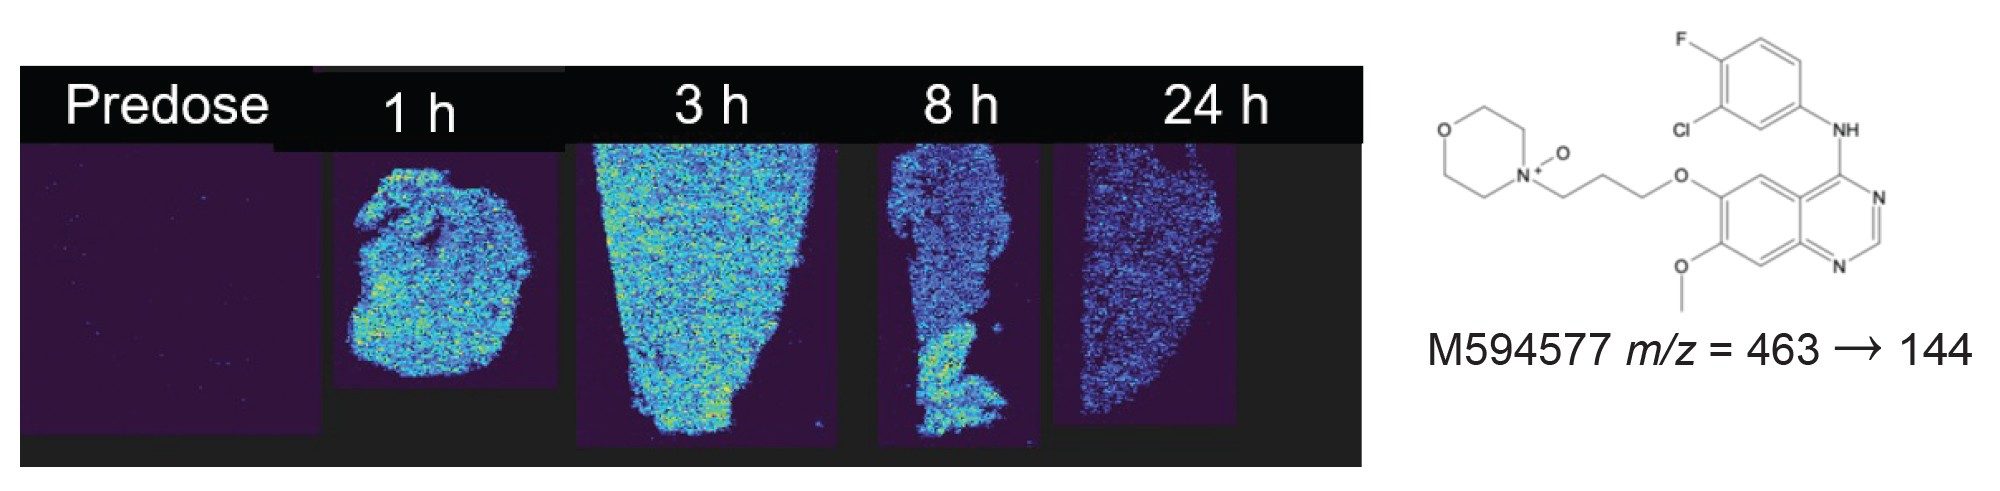
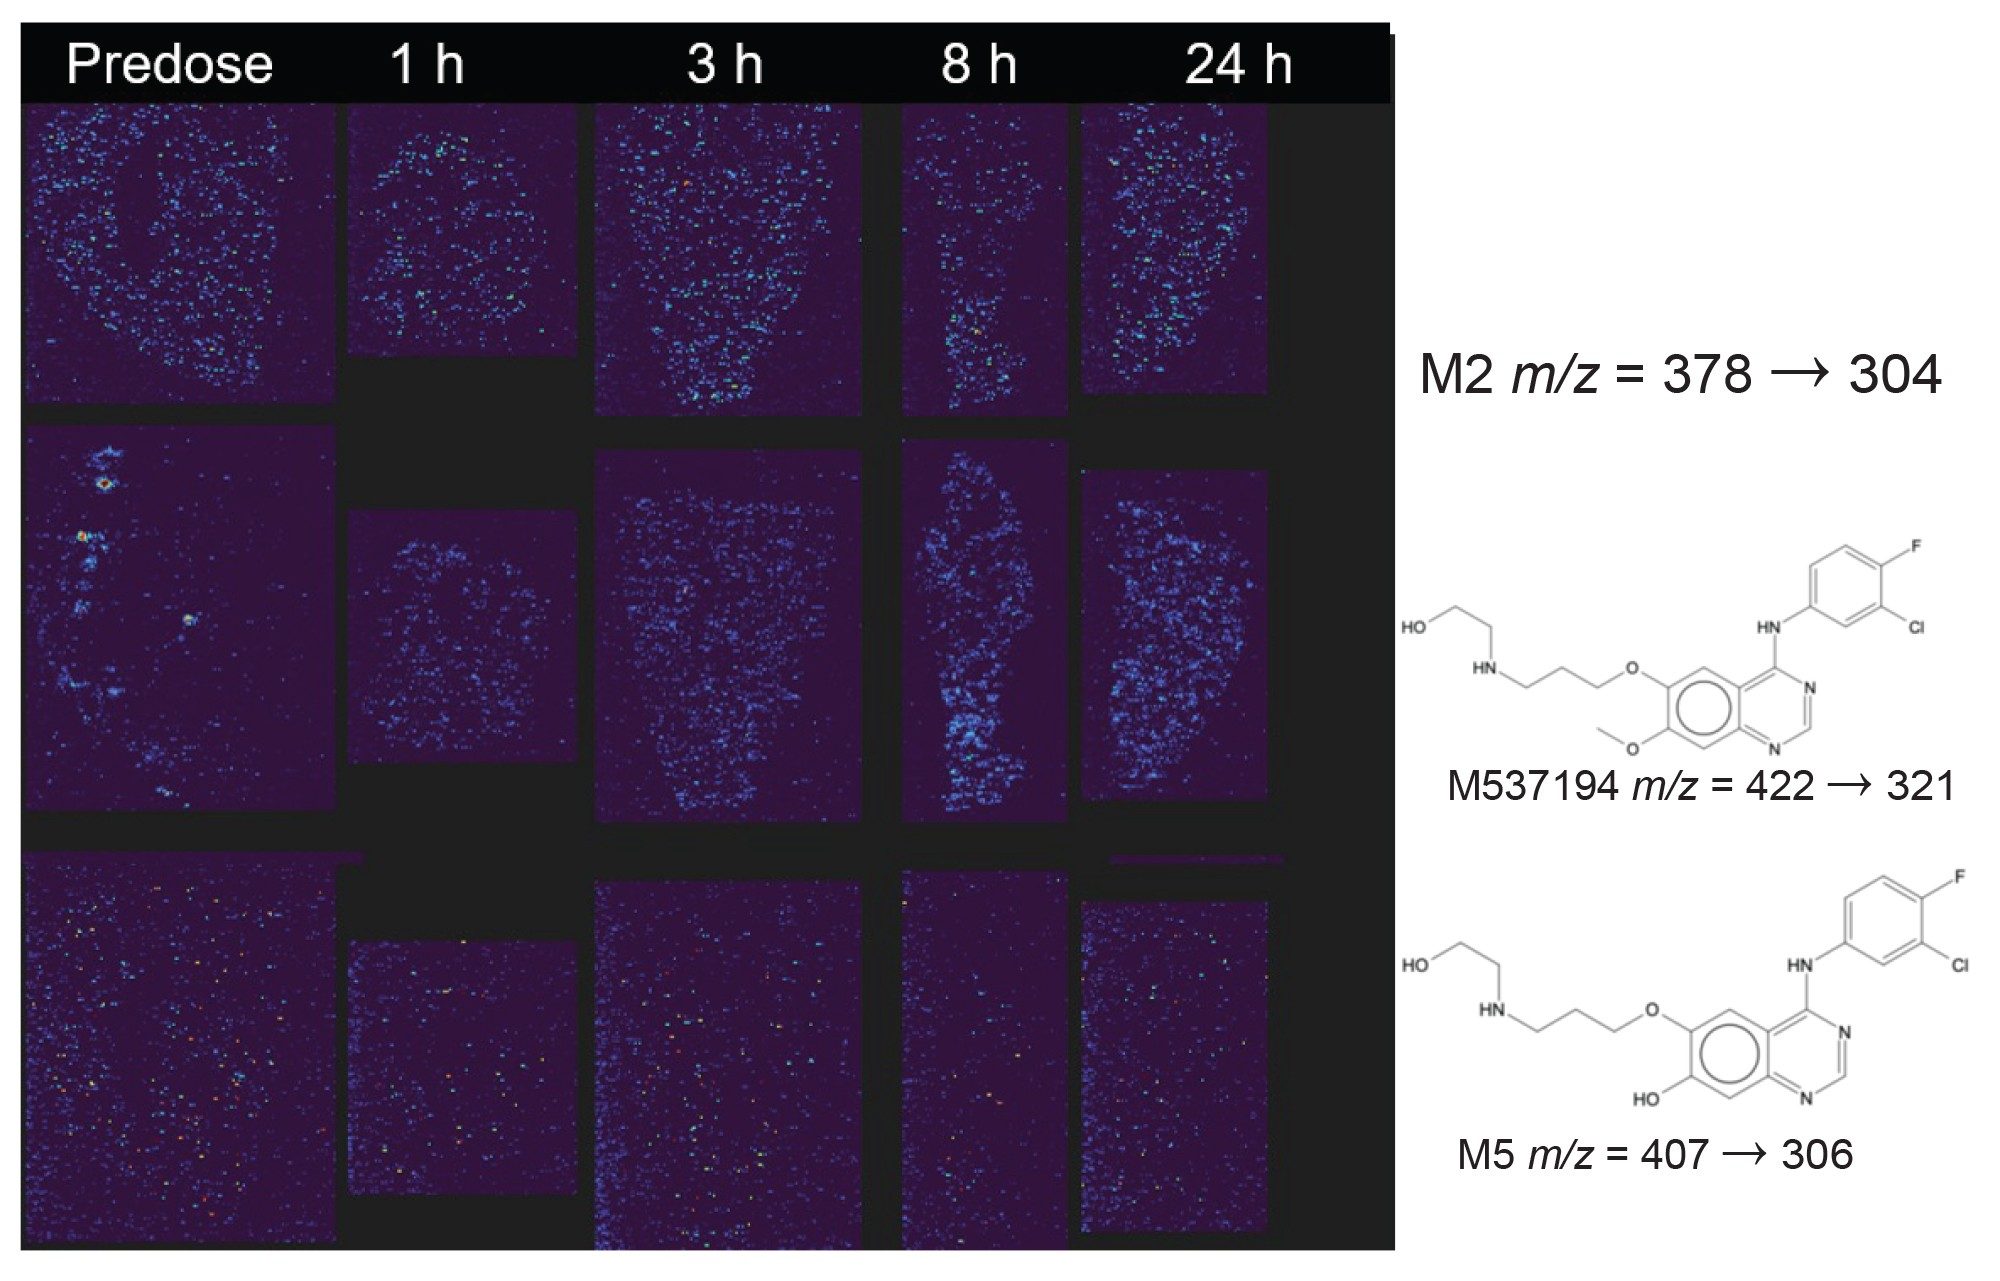
The dihydroxylated metabolite (M13) showed a similar time profile to gefitinib, but at a significantly lower signal intensity than either M594577 or M605211. Metabolites M2 (ring opening of the morpholine group and oxygenation), M5 (O-demethylation and morpholine ring cleavage), and M537194 (M6 - formed from cleavage of the morpholine group) were not detected in the 1 and 3 hours samples and showed only a weak intensity distribution in the 24 hours section, as shown in Figure 5. This data suggested that these metabolites were either not present in the liver or at concentrations below the limit of detection.
Conclusion
A DESI source couple to a tandem quadrupole mass spectrometry was used for the visualization of gefitinib and its metabolites in rat liver sections following subcutaneous dosing. The extra sensitivity, specificity, and selectivity provided by MRM data acquisition allowed for the unambiguous drug/metabolite detection in tissue at pharmacologically relevant concentrations. The N-oxide metabolite of gefitinib (M594577) provided the most intense response of all the drug-related species, followed by gefitinib, and then morpholino carbonyl metabolite M605211. In addition to these major components, signals corresponding to the metabolites M2, M527194, and the dihydroxylated metabolite (M13) were also detected in the liver sections at low levels. A clear temporal trend was observed for gefitinib and the metabolites over the course of the study corresponding to the drug plasma concentration curve.
References
- Sohlenius-Sternbeck, A.K.; Janson, J.; Bylund, J. Optimizing DMPK Properties: Experiences from a Big Pharma DMPK Department. Curr Drug Metab. 2016;17(3):253-270. doi:10.2174/1389200217666151210125637
- Mak, K.K.; Epemolu, O.; Pichika, M.R. The role of DMPK science in improving pharmaceutical research and development efficiency. Drug Discov Today. 2022;27(3):705-729. doi:10.1016/j.drudis.2021.11.005
- Solon, E.G. Use of radioactive compounds and autoradiography to determine drug tissue distribution. Chem Res Toxicol. 2012;25(3):543-555. doi:10.1021/tx200509f
- Cooks, R.G.; Ouyang, Z.; Takats, Z.; Wiseman, J.M. Detection Technologies. Ambient mass spectrometry. Science. 2006;311(5767):1566-1570. doi:10.1126/science.1119426
- Dannhorn, A.; et al. Correlating Mass Spectrometry Imaging and Liquid Chromatography-Tandem Mass Spectrometry for Tissue-Based Pharmacokinetic Studies. Metabolites. 2022;12(3):261. Published 2022 Mar 18. doi:10.3390/metabo12030261
- McKillop, D.; et al.. Pharmacokinetics of gefitinib, an epidermal growth factor receptor tyrosine kinase inhibitor, in rat and dog. Xenobiotica. 2004;34(10):901-915. doi:10.1080/00498250400009189
- Molloy, B.J.; et al. Rapid determination of the pharmacokinetics and metabolic fate of gefitinib in the mouse using a combination of UPLC/MS/MS, UPLC/QToF/MS, and ion mobility (IM)-enabled UPLC/QToF/MS. Xenobiotica. 2021;51(4):434-446. doi:10.1080/00498254.2020.1859643
720009538, August 2026


