
Rapid LC-UV-MS Characterization of Peptide Therapeutics and Impurities Using BioResolve™ Peptide Phenyl-Hexyl+ and C18+ RP Columns
Natalia Kozlova, Venkata Siva Suryanarayana Gurram, Hua Yang, Stephen Shiner, Balasubrahmanyam Addepalli
Waters Corporation, United States
Published on September 29, 2026

Abstract
Efficient separation and characterization of peptide therapeutics and their impurities are critical for biopharmaceutical development and quality control. This study demonstrates the performance of BioResolve Peptide Phenyl-Hexyl+ and C18+ RP Columns for rapid LC-UV-MS analysis of insulin, its deamidation impurity, cagrilintide, semaglutide, liraglutide, and tirzepatide using a short 2.1 × 50 mm column format. Both column chemistries achieved baseline resolution of all analytes, including the critical separation of insulin from its deamidated impurity. Coupling with the BioAccord LC-MS System provided clean mass spectra, clear charge-state distributions, and accurate monoisotopic mass assignments with low mass error under MS-compatible conditions. These results demonstrate that BioResolve Peptide Phenyl-Hexyl+ and C18+ RP Columns enable fast, robust, and MS-compatible characterization of peptide therapeutics and related impurities in a single LC-UV-MS workflow.
Benefits
- Rapid impurity resolution: Baseline separation of insulin and its deamidation impurity in less than six minutes using a short 2.1 × 50 mm column format.
- Selective peptide separation: Resolution driven by differences in peptide hydrophobicity, molecular structure, and fatty-acid conjugation.
- Consistent chromatographic performance: Comparable separation quality and elution profiles across Phenyl-Hexyl+ and C18+ Column chemistries.
- MS-ready methodology: Mobile phase conditions fully compatible with LC-MS analysis, enabling seamless chromatographic and mass spectrometric characterization.
- Confident mass confirmation: Clear charge-state distributions facilitate accurate deconvolution and reliable monoisotopic mass determination using intact mass analysis software.
- Accelerated peptide characterization: Enables rapid assessment of peptide therapeutics and impurities within a single LC-UV-MS workflow.
Introduction
Biologics are the fastest-growing class of therapeutics which include monoclonal antibodies (mABs), recombinant proteins, hormones, vaccines, and gene therapies. Insulin, a peptide hormone that regulates blood glucose levels, is a key biologic used to treat diabetes resulting from insulin deficiency. This peptide hormone consists of a 21-residue A-chain and a 30-residue B-chain connected by three conserved disulfide bonds. Human and bovine insulins share nearly identical structures and differ by only three amino acid residues (A8, A10, and B30)1, while bovine and porcine insulins differ at only two positions (A8 and A10), highlighting their high degree of structural conservation. Because insulin-binding regions are highly conserved across species, both human and animal insulin can effectively regulate blood glucose. However, recombinant human insulin and engineered analogs largely replaced animal-derived insulin due to their closer physiological similarity.2 Regardless of origin, insulin products may contain process, formulation, stability, or product-related impurities, making their separation and characterization essential for ensuring product quality, efficacy, and regulatory compliance.3

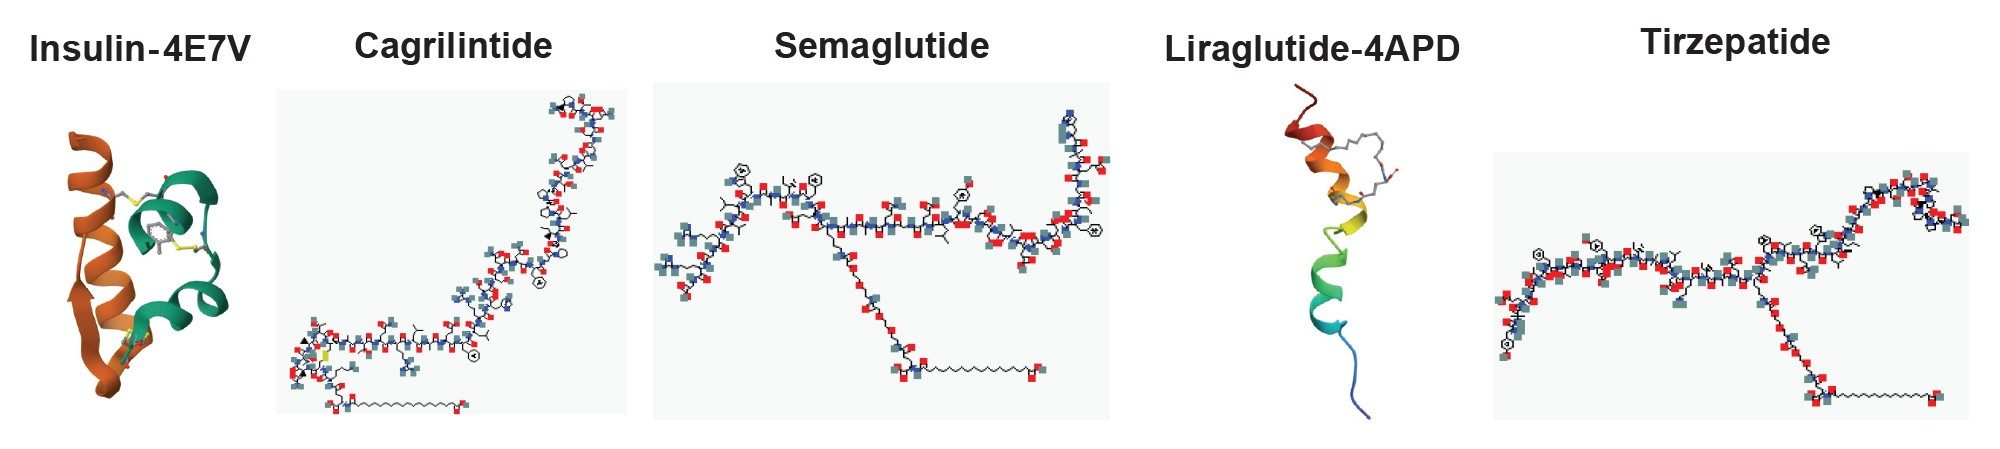
Glucagon-like peptide-1 receptor (GLP-1R) agonists as well as amylin analogs are another class of peptide therapeutics (Figure 1) that mimic the incretin hormone GLP-1 to improve glycemic control and support weight management.4 Their safety, efficacy, and stability depend on critical quality attributes (CQAs), including sequence integrity, chemical modifications, higher-order structure, aggregation, and impurity levels. Analytical characterization is particularly challenging due to their 30-40 amino acid length, fatty-acid conjugation, susceptibility to oxidation, deamidation, truncation, and aggregation.
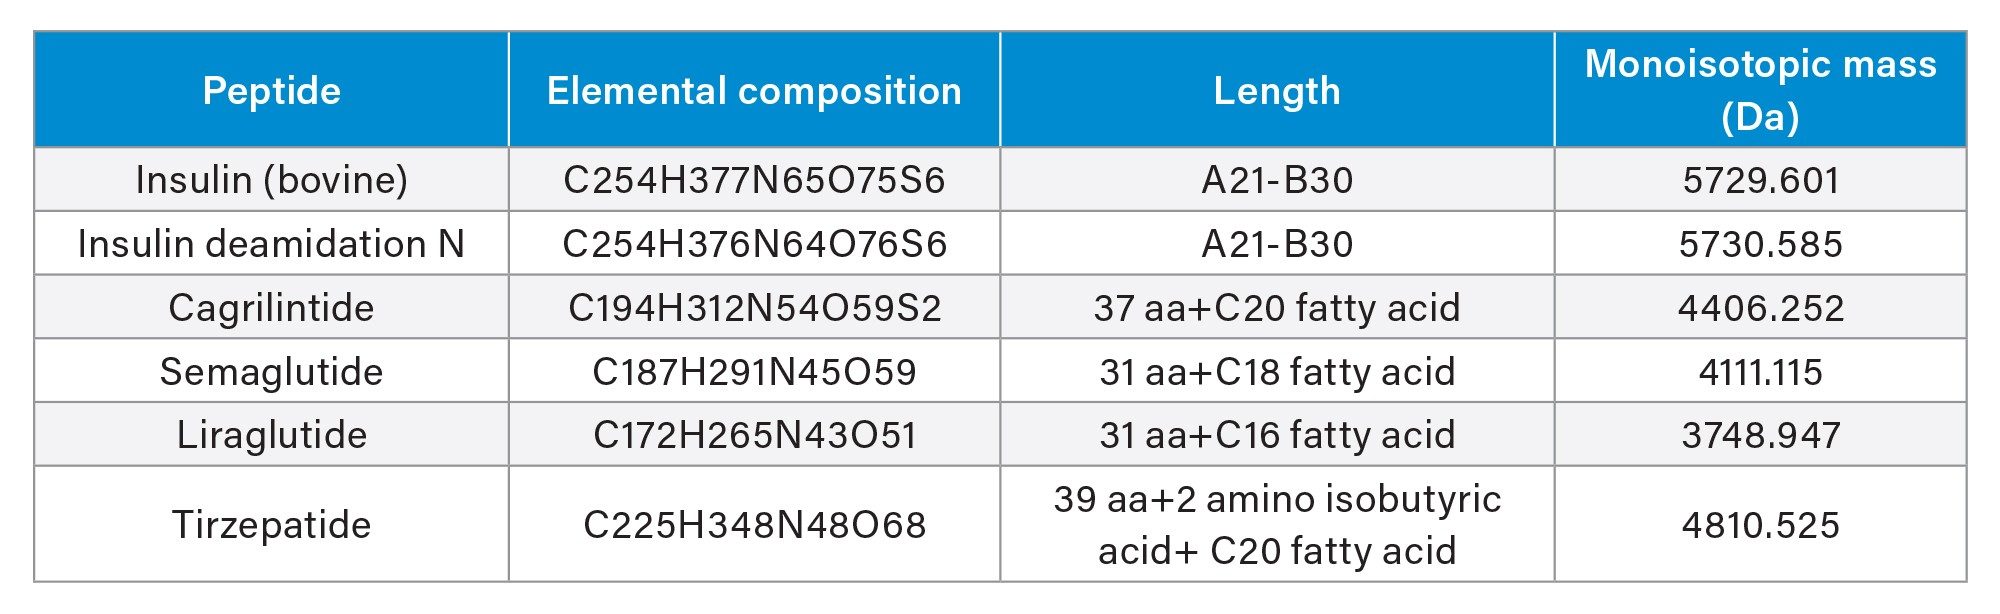
Liquid chromatography coupled with mass spectrometry (LC-MS) is a powerful technique for the characterization of biologics and their impurities. However, even subtle differences in column chemistry can significantly impact method robustness, reproducibility, and analytical performance. Inadequate impurity profiling may compromise product quality, efficacy, and patient safety while increasing the risk of regulatory challenges and product recalls. Here, the rapid and reliable LC-MS analysis of insulin, its deamidation impurity, GLP-1 receptor agonists, and an amylin analog using BioResolve Peptide Phenyl-Hexyl+ and C18+ RP Columns coupled with the BioAccord LC-MS System and waters_connect™ Intact Mass Application are demonstrated. The optimized workflow delivers high-resolution separations, accurate mass measurements, and confident impurity identification, enabling efficient characterization of peptide therapeutics throughout development and quality control.
Experimental
This application note demonstrates the use of BioResolve Peptide Columns for rapid LC-MS characterization of peptide therapeutics and impurities. A mixture of bovine insulin, its deamidation impurity, GLP-1 receptor agonists (semaglutide, liraglutide, and tirzepatide), and the amylin analogue cagrilintide were analyzed in a single injection. Coupled with the BioAccord LC-MS System and waters_connect Intact Mass Application, the workflow delivers efficient separation, accurate mass confirmation, and streamlined characterization of peptide biologics.
Preparation of Peptide Standards
(i) Insulin: Bovine insulin (Millipore Sigma – p/n: 16634) was dissolved in 0.01N HCl at 2mg/mL concentration and stored at room temperature (~25 °C) for about 96 hours to generate the impurity. After 96 hours, the aged sample was aliquoted and stored at 2 to 8 °C up to 2 weeks or aliquoted and stored at -20 °C for long term storage (~6 months).
(ii) GLP-1 and amylin analog standards: Cagrilintide (Cayman chemicals - p/n: 41329), semaglutide acetate (AA blocks – p/n: AA02C9ME), liraglutide (AA blocks – p/n: AA003R7S) and tirzepatide (AA blocks – p/n: AA01MVAI) were dissolved in Dulbecco’s phosphate buffered saline (DPBS – Cytiva p/n: SH30028.02) buffer at 2 mg/mL and stored at 2-8 ºC for up to 1 month or aliquoted and stored at -20 °C for long term storage (~6 months).
(iii) Peptide mixture preparation for LC-MS injections: 4 µL of each of the 2 mg/mL solutions of GLP-1, amylin analog and bovine insulin prepared previously were added to 200 µL of 0.1% of formic acid in water:acetonitrile (98:2) and mixed well. 1-2 µL of the sample was injected, providing a total load of 0.45-0.91 µg per injection respectively.
LC Conditions
|
Equipment |
Waters p/n Requirements |
|
ACQUITY™ Premier UPLC System: |
ACQUITY Premier UPLC H-Class PLUS Bio SM FTN-H, p/n: 186015086 or equivalent ACQUITY UPLC Premier Bio Binary Solvent Manager (BSM), p/n: 186015061 or equivalent Column Heater (CH-A), p/n: 186015042 or equivalent TUV Detector |
|
TUVe, analytical flow Cell, 500 nL, Low dispersion: |
p/n: 205015033 |
|
TUVe inlet (0.0025”): |
p/n: 430001749 |
|
Column active pre-heater: |
p/n: 430005183 |
|
50 µL titanium mixer: |
p/n: 700012635 |
|
Column support clips: |
p/n: 205000478 |
|
Sample needle (15 µL, SS or PEEK, 0.010” ID): |
p/n: 700012821 |
|
Empower™ 3 Chromatography Manager or newer: |
Base package, System suitability |
|
Feature release: |
FR3 or most current (Empower2) FR1 or most current (Empower3) |
|
ACQUITY UPLC System Driver Software: |
Version 1.30 or most current |
|
Column heater thermal gasket: |
p/n: 430005183 |
|
Columns: BioResolve Peptide Phenyl- Hexyl+ RP Column MaxPeak ™ Premier Technology, SPP, 1.6 µm, 230Å (2.1 x 50 mm): |
p/n: 186011725 |
|
BioResolve Peptide C18+ RP Column MaxPeak Premier Technology, SPP, 1.6 µm, 230Å (2.1 x 50 mm): |
p/n: 186011716 |
|
Mobile phase A1: |
0.1% Formic Acid in 100% 18.2MΩ*cm Water (v/v) |
|
Mobile phase A2: |
Neat, degassed LCMS Acetonitrile |
|
Mobile phase B1: |
0.1% Formic Acid in 100% Acetonitrile (v/v) |
|
Seal wash: |
10% Acetonitrile for 5.0 minutes |
|
Needle wash: |
1:1:1:1 Methanol:Acetonitrile:Isopropanol:18.2MΩ*cm Water (v/v/v/v) with 0.1% Formic Acid 10 seconds after the injection, no wash before |
|
Active preheater: |
Enabled in ACQUITY-FTN method |
|
Pressure limits: |
Low: 0 psi High: 15000 psi |
|
Gradient start: |
At injection |
|
Data channels: |
System Pressure |
|
Column temperature: |
55.0 °C |
|
Autosampler temperature: |
5 °C |
|
Syringe draw rate: |
30 µL/min |
|
Needle placement: |
2.0 mm |
|
Air gaps: |
Not checked (none) |
|
Data channels: |
System Pressure and TUV |
|
Filter setting: |
Normal |
|
Data mode: |
Absorbance |
|
Autozero on inject start: |
Yes |
|
Autozero on wavelength: |
Maintain Baseline |
|
UV wavelength: |
214 nm |
|
TUV sampling rate: |
20 Hz (points/sec) (Peptides), |
|
Injection volume: |
1 µL, 2 µL, 5 µL |
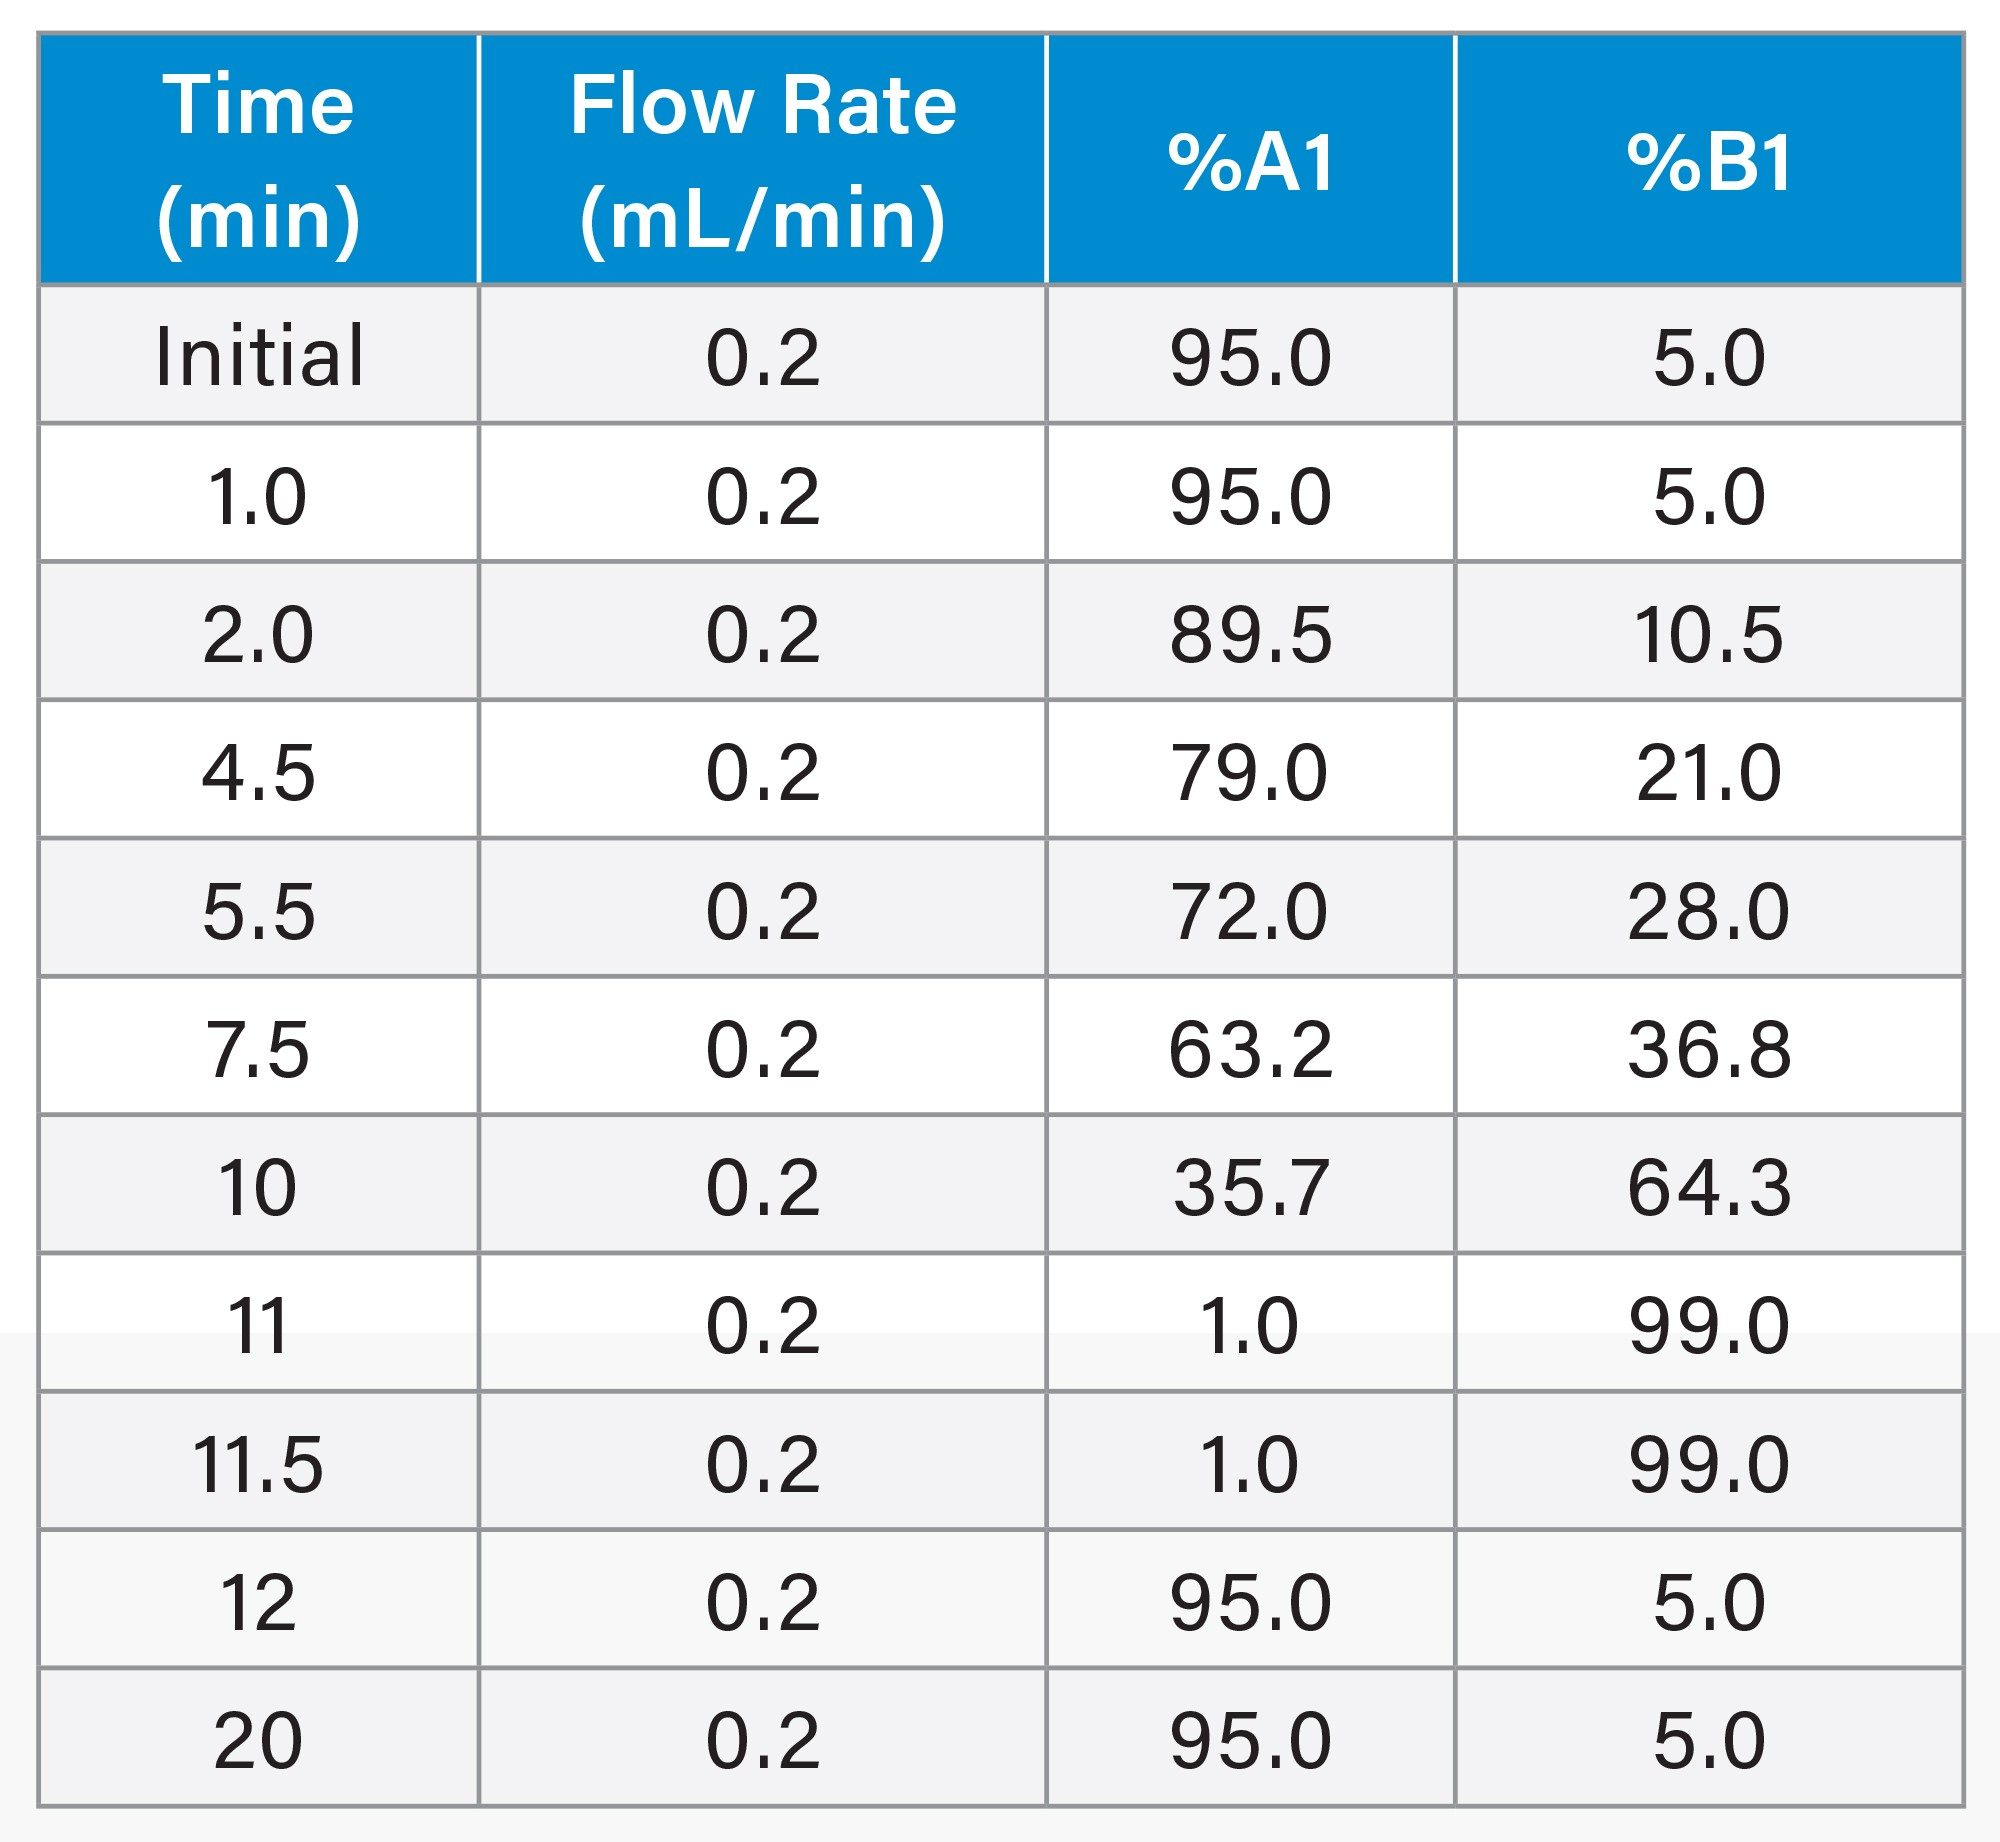
Chromatography Gradient for GLP Peptide Mixture Batch Test for PH+ Column Chemistry
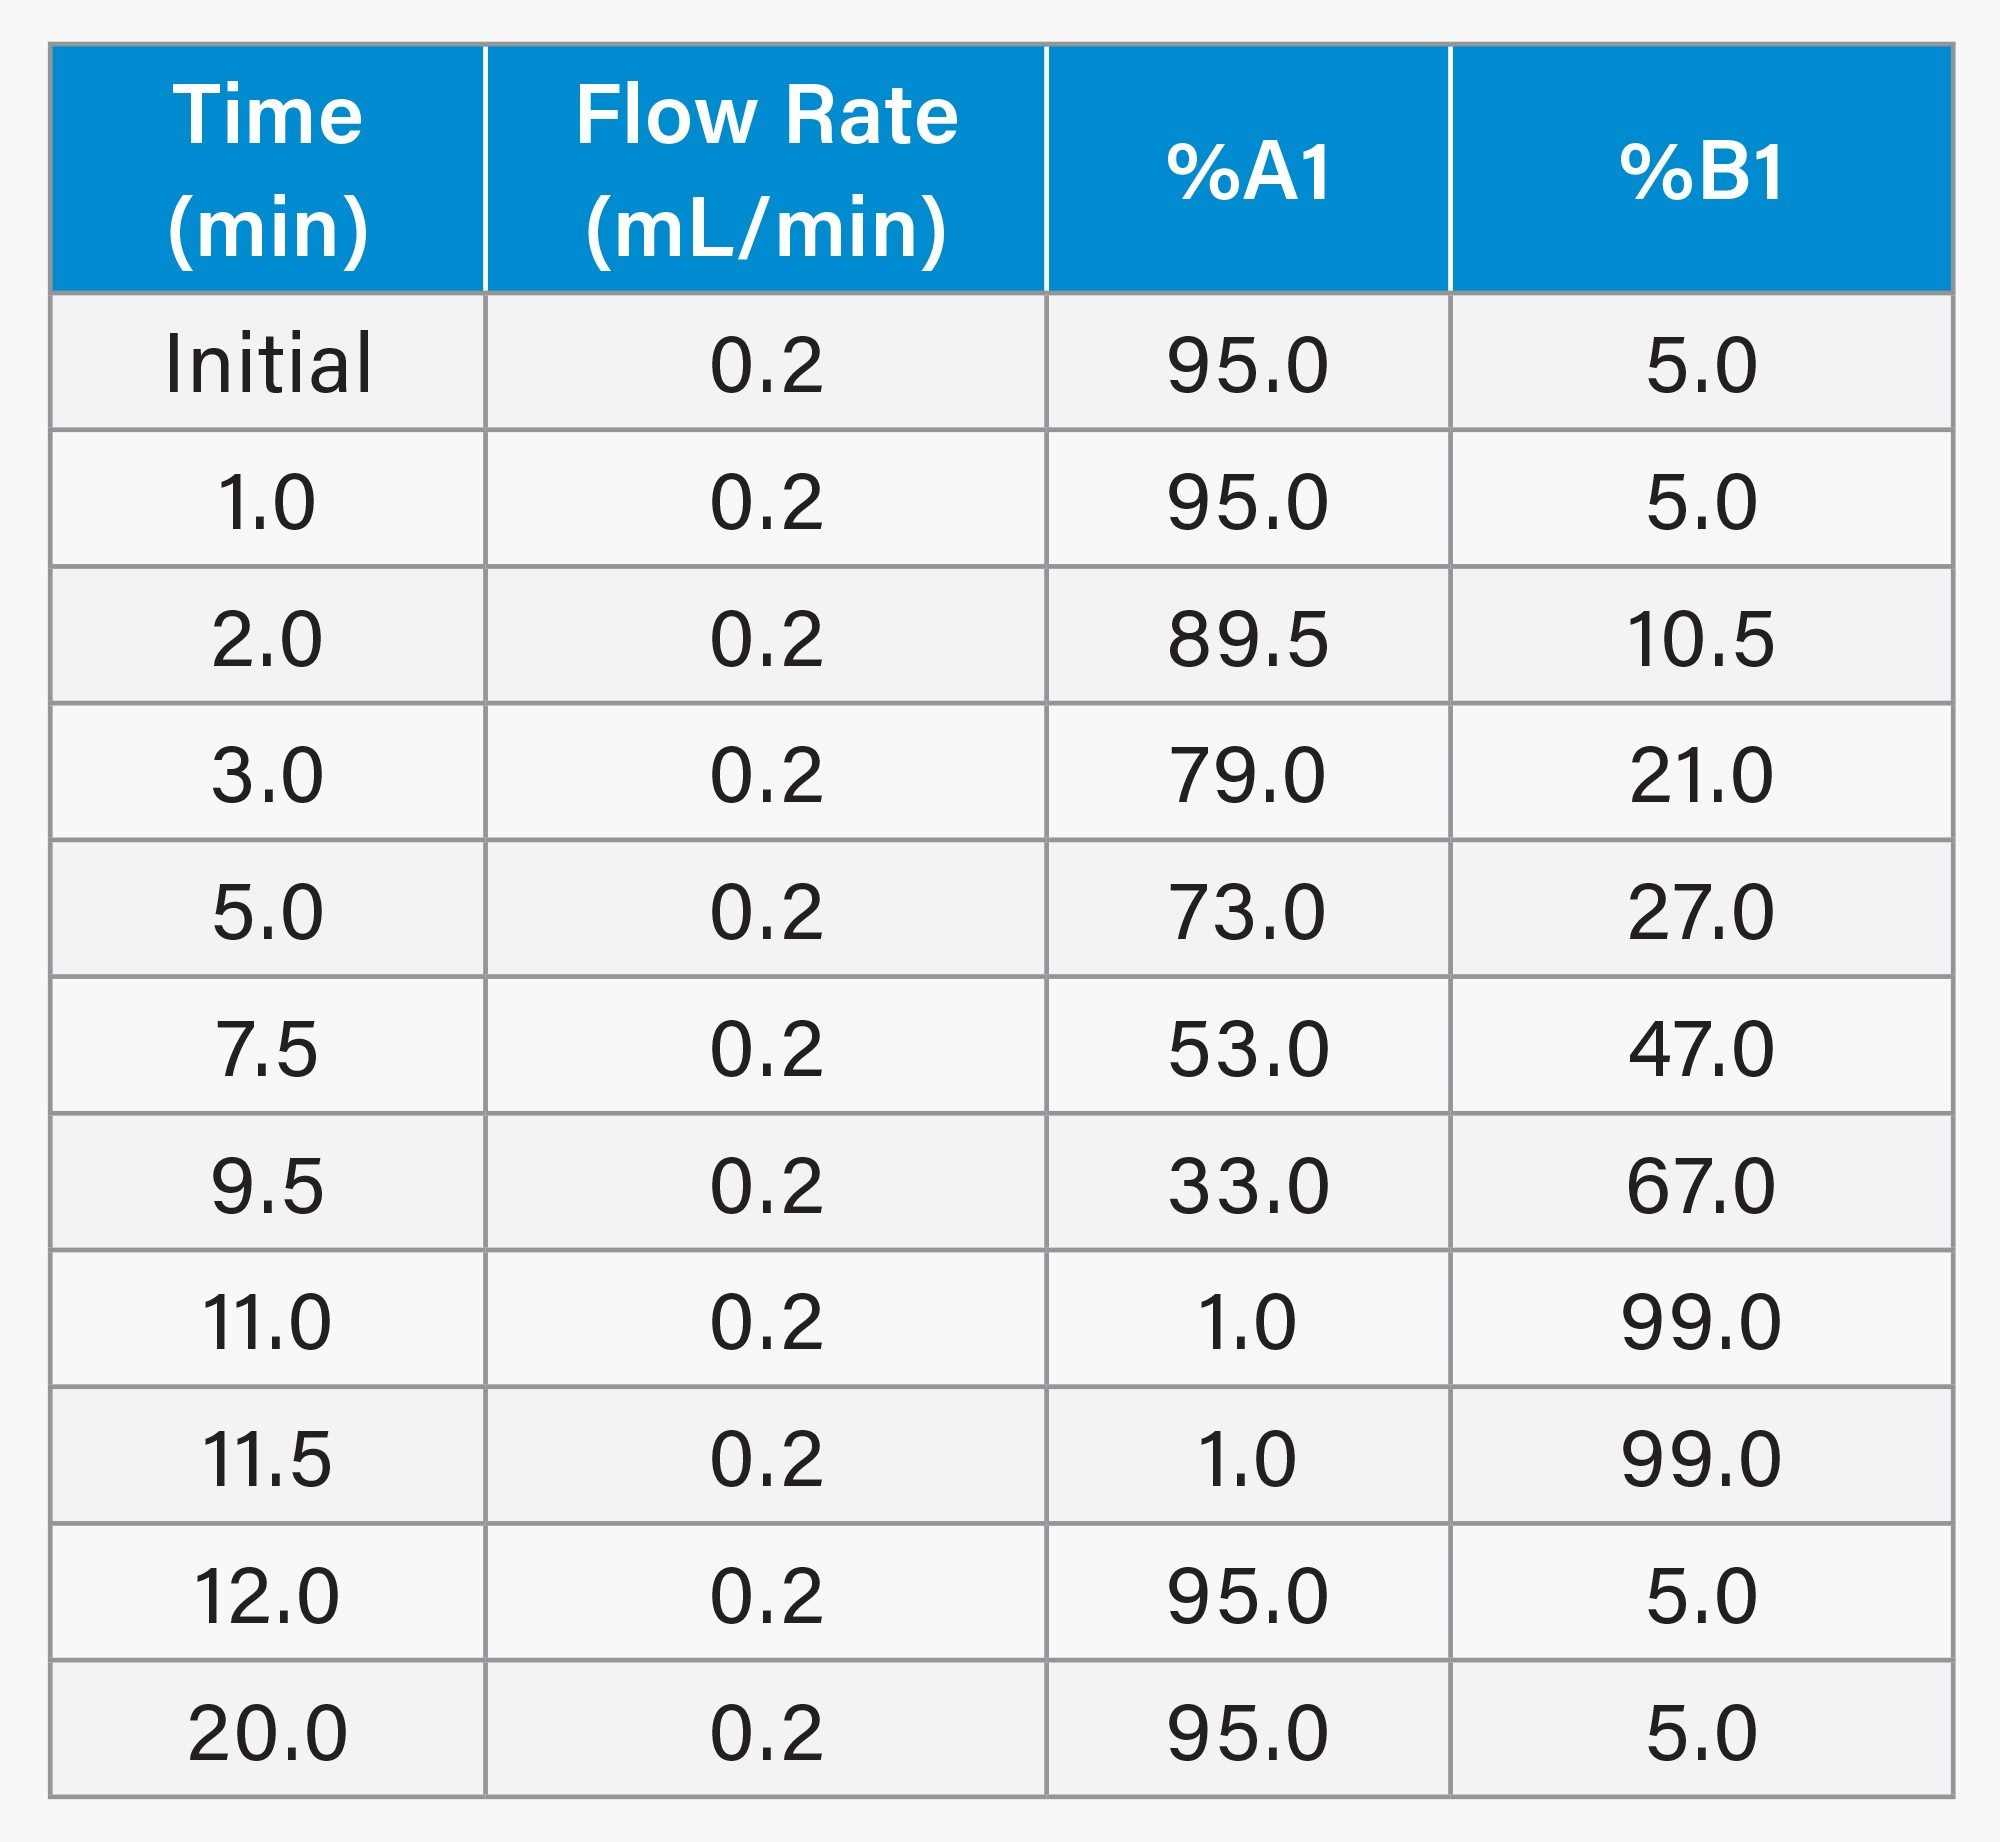
Chromatography Gradient for GLP Peptide Mixture Batch Test for C18+ Column Chemistry
MS Conditions
|
MS system: |
Waters BioAccord LC-MS System |
|
Mode: |
MSE |
|
Mass range: |
50-2000 m/z |
|
Polarity: |
Positive |
|
Scan rate: |
10 Hz |
|
Cone voltage: |
20 V |
|
Desolvation temperature: |
350 °C |
|
Capillary voltage: |
1.2 kV |
|
MSE collision energy ramp: |
100-150 V |
|
Lock mass correction: |
Standard |
Data analysis: The waters_connect Intact Mass Application (v1.9.0.2980), operating within the waters_connect Hub (v4.3.0.1318), was used to enable a high-throughput, automated data-processing workflow that minimized manual intervention. To further improve deconvolution performance and mass accuracy, target molecular assignments were refined using theoretical chemical formula information, as previously described.5
Results and Discussion
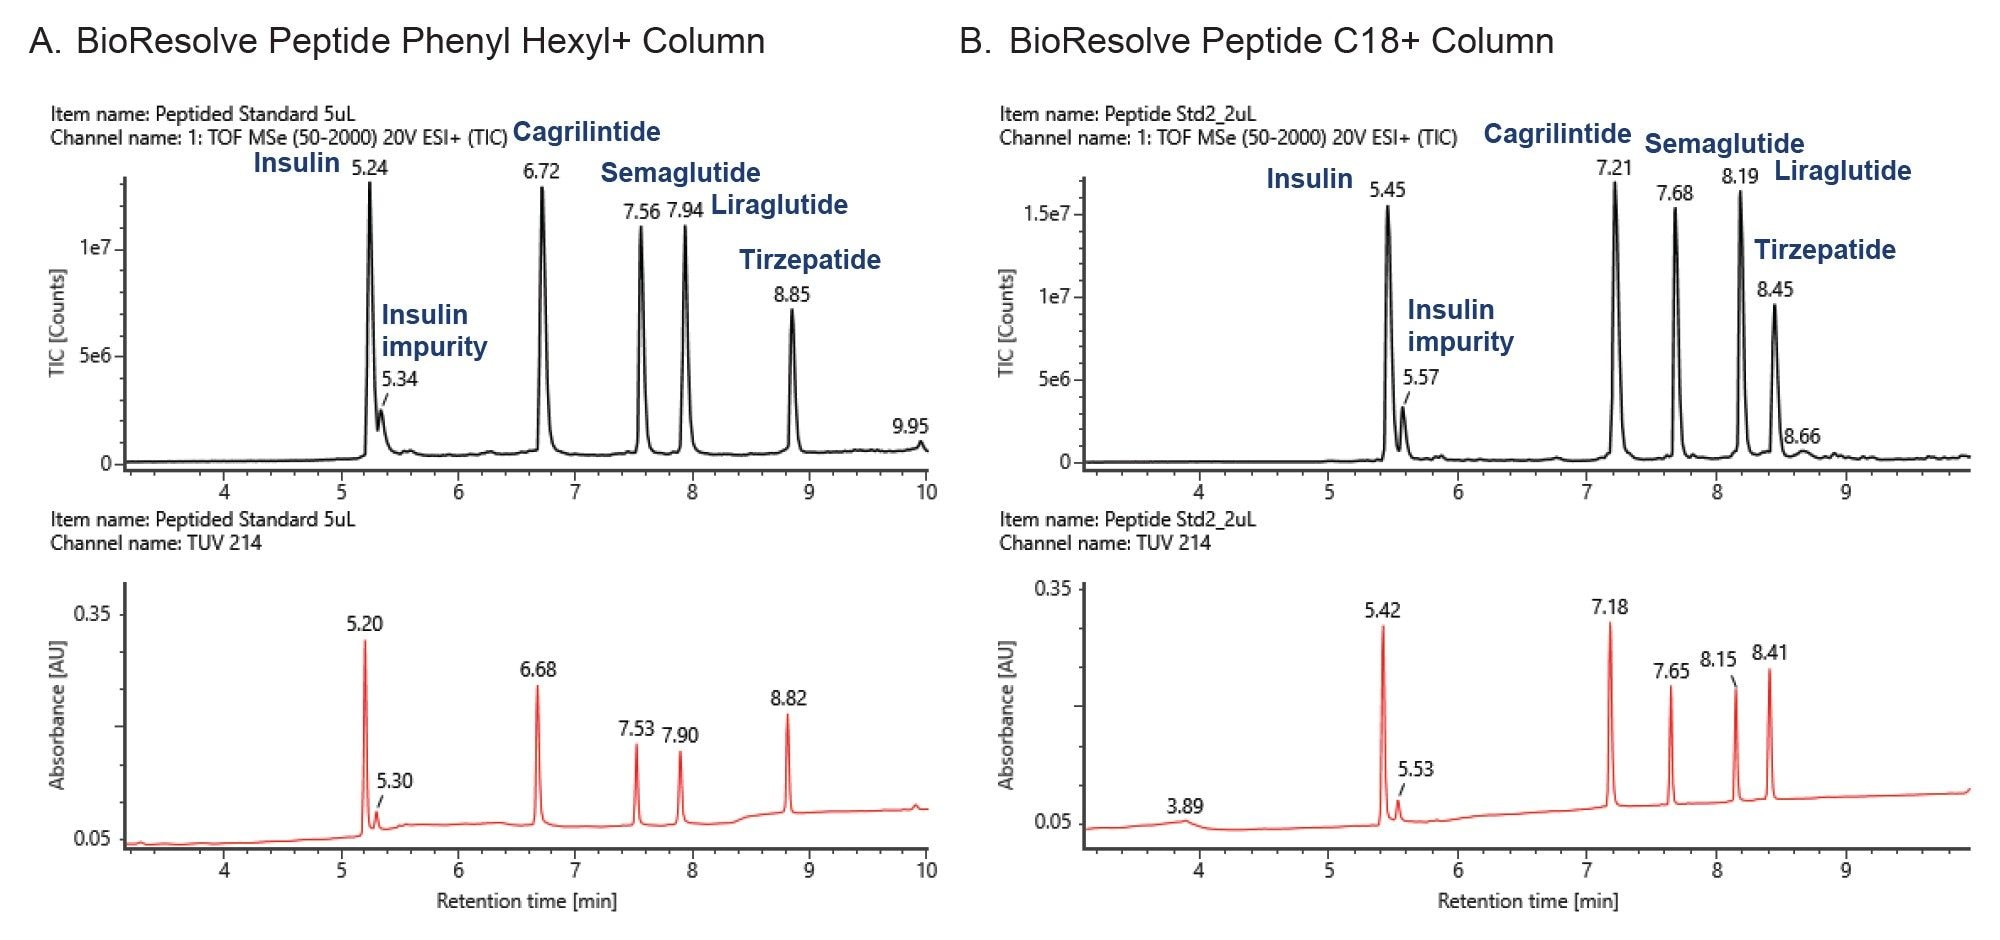
Rapid impurity profiling requires fast and robust chromatographic methods. As shown in Figure 2, BioResolve Peptide Phenyl-Hexyl+ (PH+) and C18+ Columns provided comparable separations of a complex peptide mixture containing insulin, its deamidation impurity, GLP-1 receptor agonists, and an amylin analogue. All analytes eluted within five to nine minutes, with baseline resolution of insulin and its deamidation impurity (ΔRT = 0.10-0.12 minutes) achieved using a short 2.1 × 50 mm column. Compared with methods requiring larger columns or longer capillary electrophoresis analyzes, this approach delivers rapid, high-resolution impurity characterization while reducing analysis time and solvent consumption.
Retention Behavior and Selectivity of PH+ and C18+ Columns
The GLP-1 receptor agonists and cagrilintide exhibited a consistent elution order on both PH+ and C18+ Columns, indicating similar overall hydrophobic selectivity. However, the additional π-π interactions provided by the PH+ chemistry resulted in subtle selectivity differences. Cagrilintide, semaglutide, and liraglutide were retained slightly longer on the C18+ Column (0.08-0.50 minutes), whereas tirzepatide exhibited approximately 0.4 minutes greater retention on the PH+ Column. These differences highlight distinct ligand-stationary phase interactions between the two chemistries.
Notably, all fatty-acid-conjugated peptides, including the GLP-1 receptor agonists and cagrilintide, were retained longer than bovine insulin despite containing fewer amino acid residues. This finding emphasizes the dominant role of lipid conjugation in governing reversed-phase retention and overall peptide hydrophobicity.
Mass Spectral Characterization of Insulin and Its Deamidation Impurity
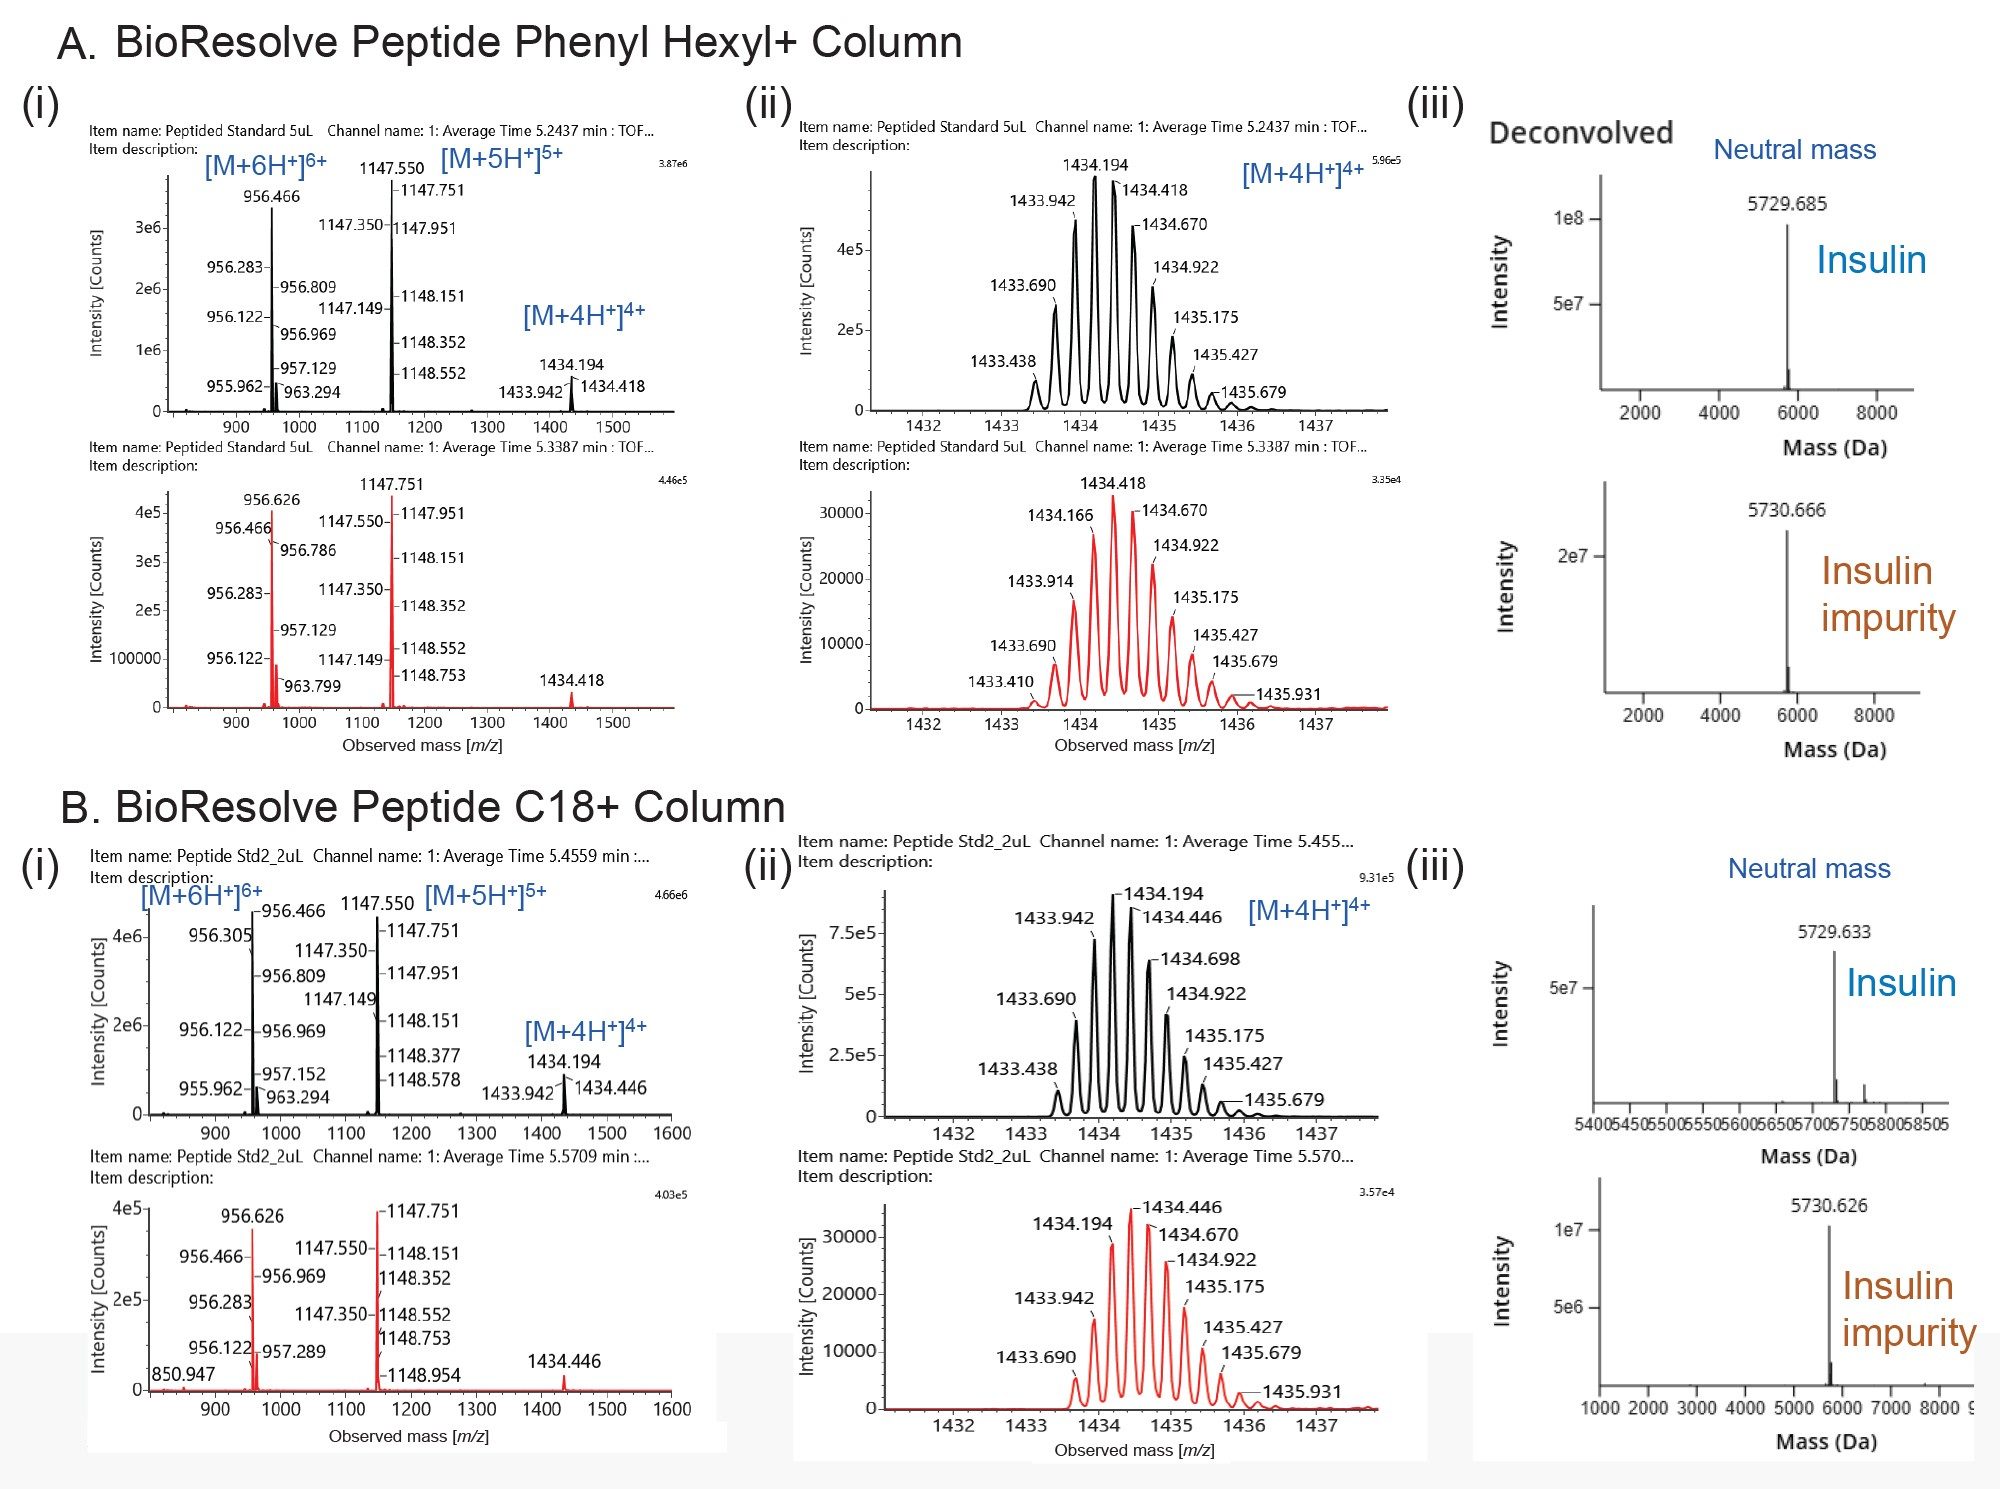
Despite the similarity of the raw mass spectra, deconvolution with the waters_connect Intact Mass Application revealed an approximately 1 Da mass increase for the impurity relative to bovine insulin (Figure 3). This mass shift is consistent with deamidation of a C-terminal asparagine residue, a well-established insulin degradation pathway reported in the literature. The impurity was slightly better resolved from the main insulin peak on the C18+ Column than on the Phenyl-Hexyl+ Column. On the Phenyl-Hexyl+ Column, a small native monoisotopic peak remained visible for all major charge states of the impurity in the raw spectra, whereas it was completely absent in the impurity spectra acquired on the C18+ Column. Despite this difference, automated data processing confidently assigned the correct masses in both cases.
The reproducibility of the chromatographic separation and mass assignment across both column chemistries and multiple injections highlights the robustness of the LC-MS workflow for insulin impurity characterization.
Mass Spectral Characterization of GLP-1 Receptor Agonists and Amylin Analogue
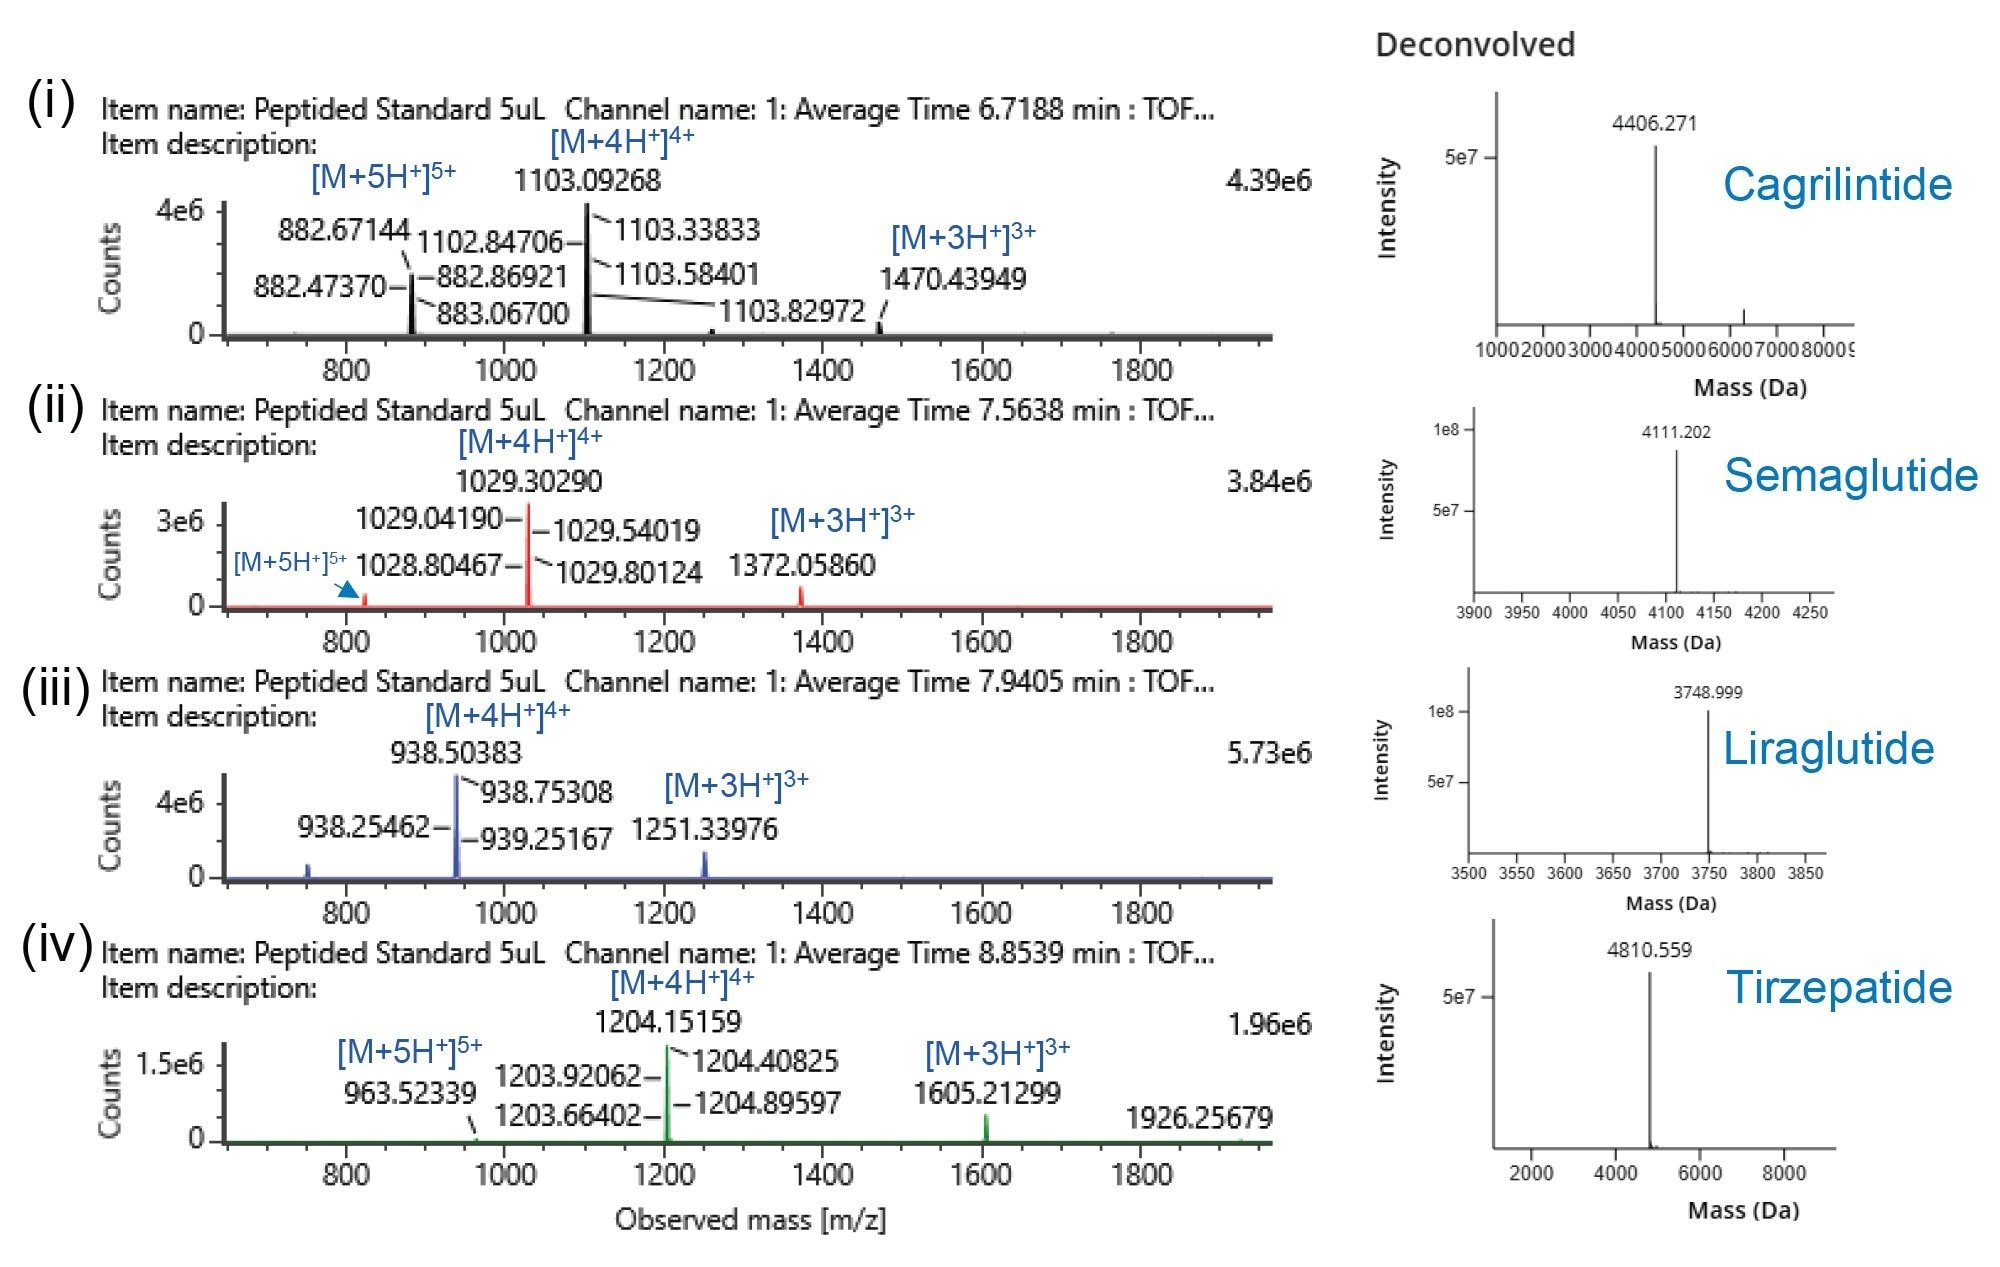
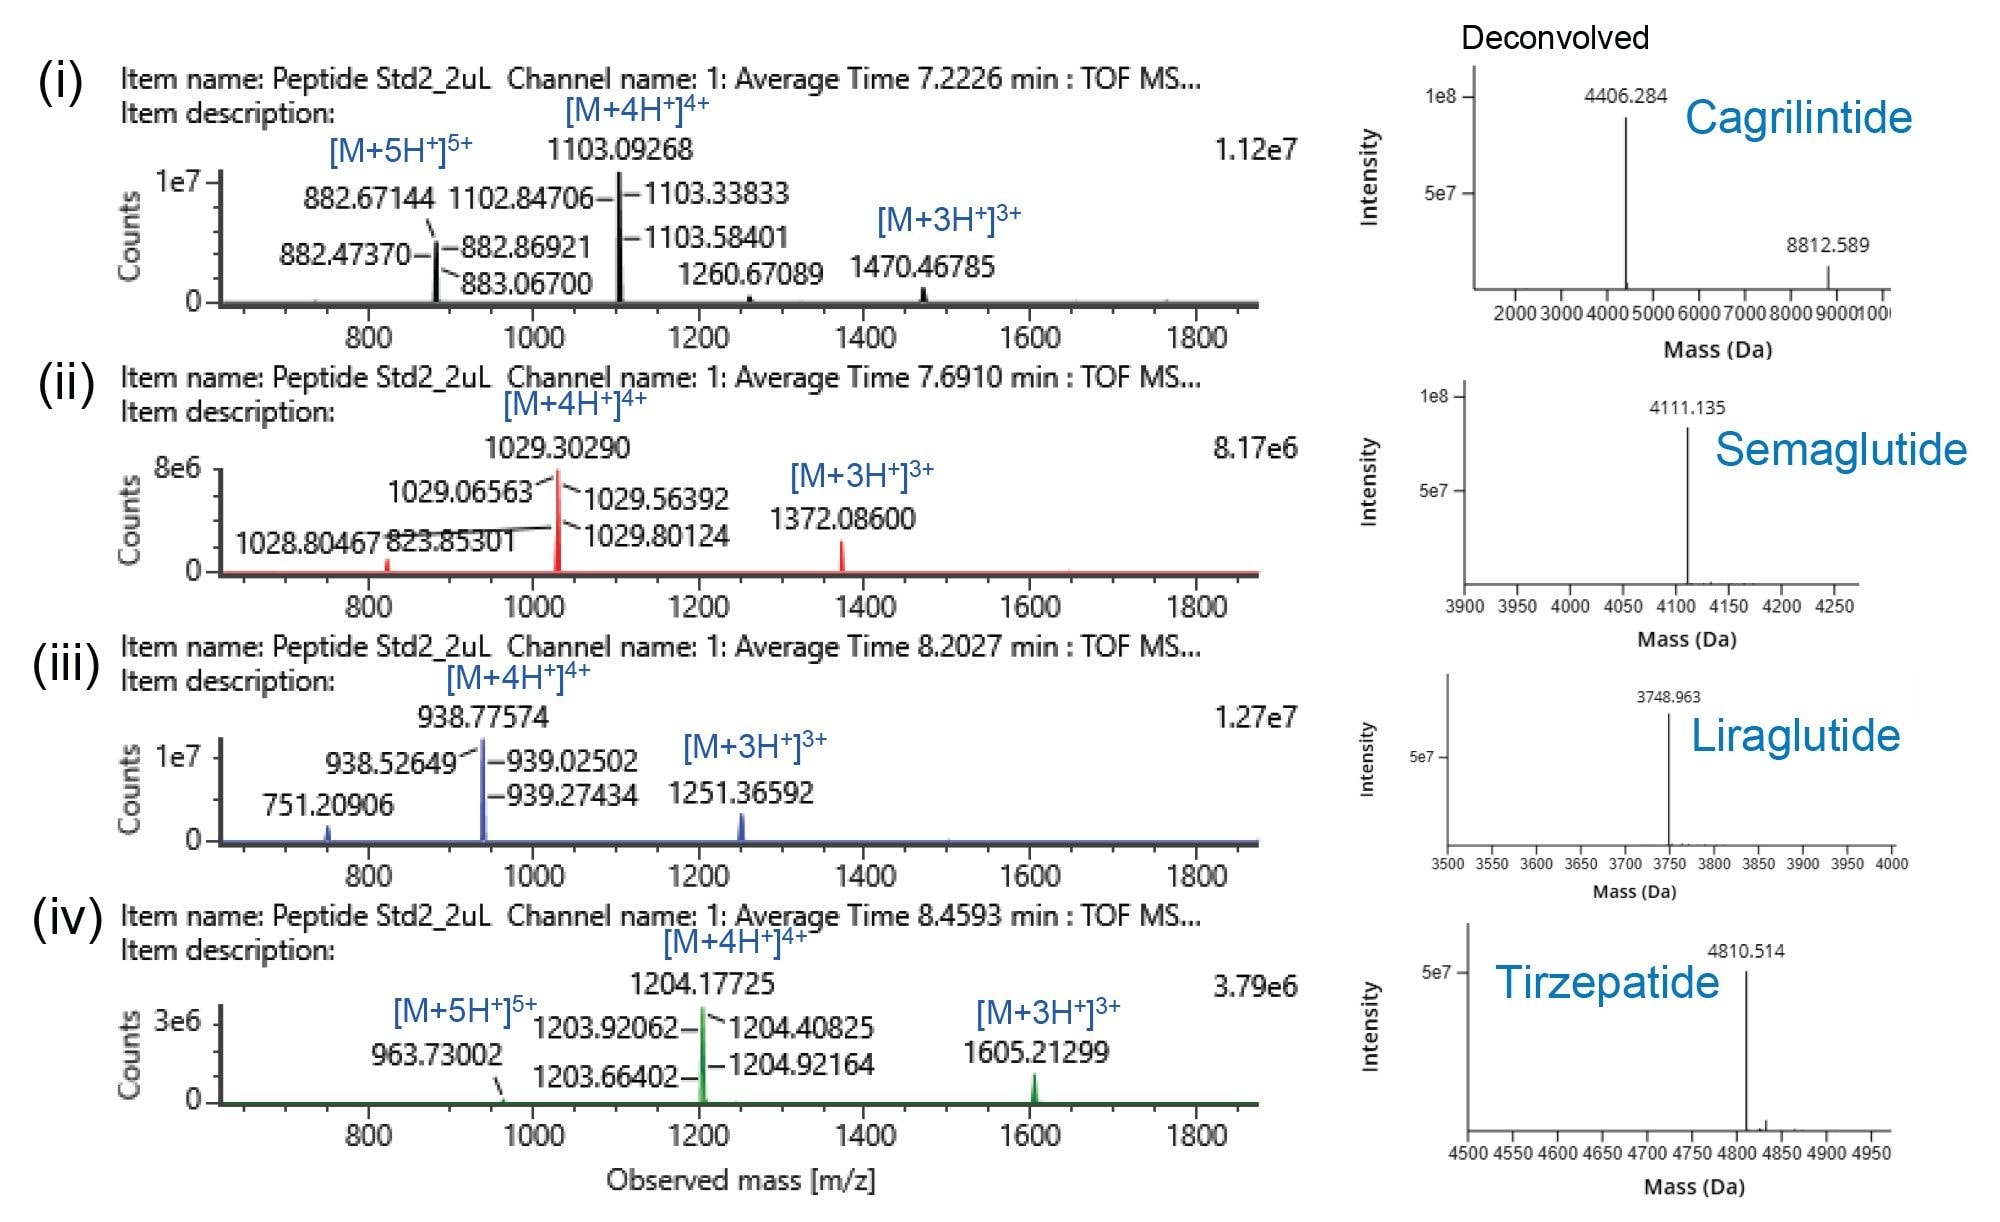
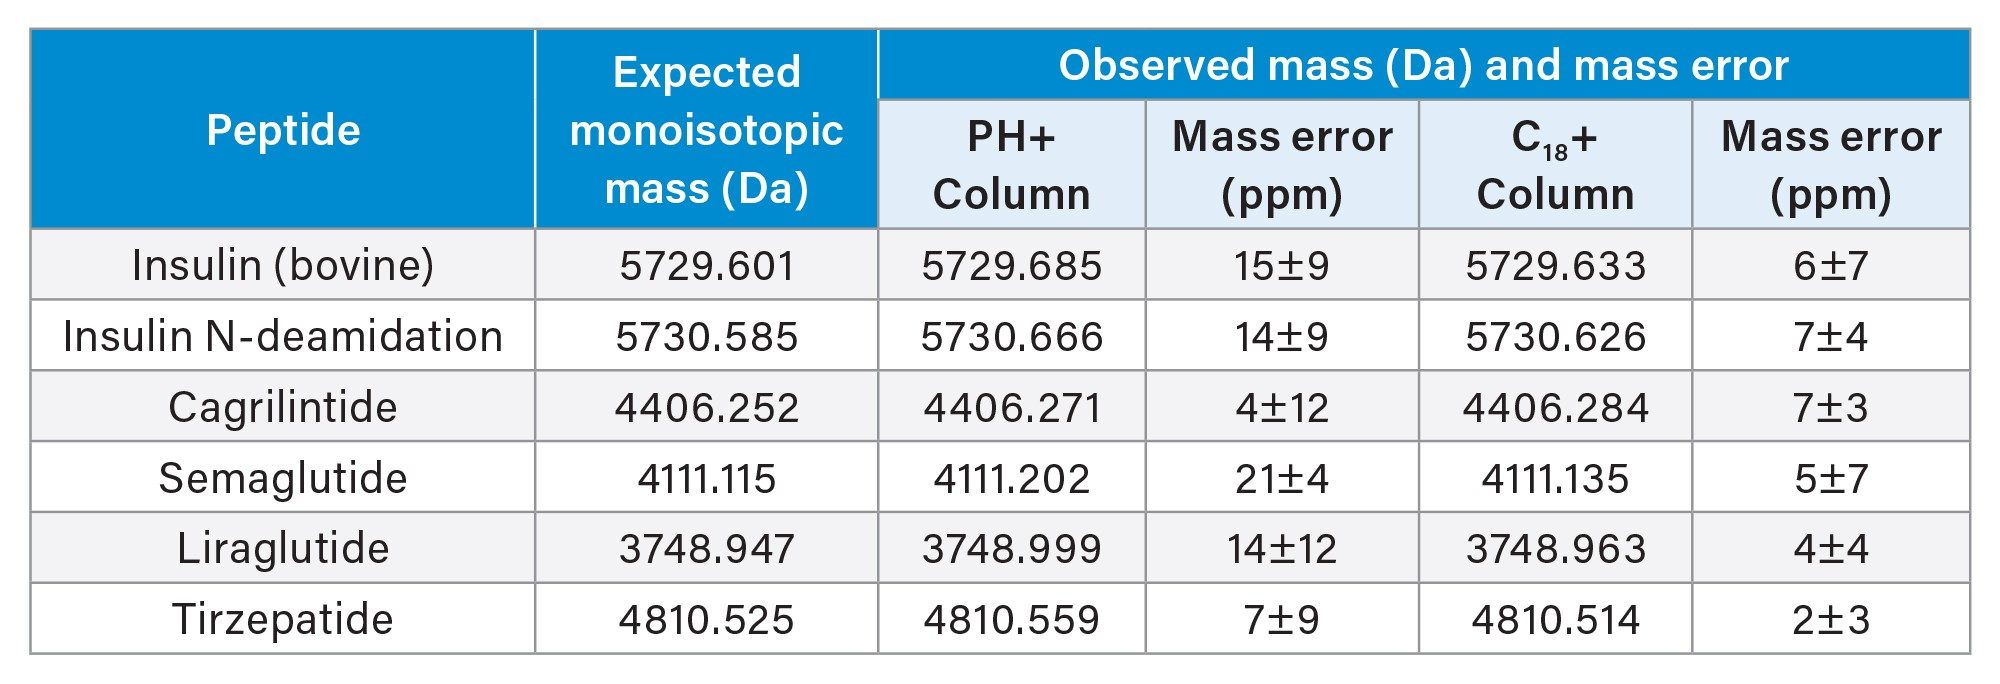
Mass spectral analysis of the GLP-1 receptor agonists and the amylin analogue cagrilintide revealed comparable ionization behavior and spectral quality when separated using either BioResolve Peptide Phenyl-Hexyl+ or C18+ Columns (Figures 4 and 5). Deconvolution of the charge-state distributions using the waters_connect Intact Mass Application enabled confident assignment of the monoisotopic masses for all analytes with low mass error, confirming accurate molecular identification.
Across replicate injections, measured neutral masses exhibited minimal variability, demonstrating the reproducibility and robustness of mass measurements obtained with both column chemistries (Table 3). In addition, the acquisition of clean mass spectra with minimal background interference facilitated straightforward charge-state assignment and mass deconvolution. These results confirm the suitability of both BioResolve Peptide Column chemistries for LC-MS characterization of peptide therapeutics, providing reliable chromatographic performance while maintaining high-quality mass spectral data for confident molecular confirmation. Information related to reproducible performance of analytes on these columns and impurity analysis of GLP-1 receptor agonist can be found in the previous works.
Conclusion
BioResolve Peptide Phenyl-Hexyl+ and C18+ Columns demonstrated excellent suitability for LC-UV-MS characterization of insulin, GLP-1 receptor agonists, and the amylin analog cagrilintide. When coupled with the BioAccord LC-MS System and the waters_connect Intact Mass Application, both column chemistries enabled robust chromatographic performance, accurate mass measurements, and confident molecular identification through automated mass deconvolution. The high chromatographic resolution achieved on a compact 2.1 × 50 mm column format allowed unambiguous separation and characterization of insulin and its deamidation impurity while maintaining rapid analysis times. Furthermore, the absence of significant UV or mass spectrometric interference confirmed the MS compatibility of both stationary phases. Collectively, these results establish BioResolve Peptide Phenyl-Hexyl+ and C18+ Columns as efficient and reliable platforms for the rapid characterization of peptide therapeutics and their related impurities in LC-UV-MS workflows.
References
- Smith, G. D.; Pangborn, W. A.; Blessing, R. H. The Structure of T 6 Bovine Insulin. Acta Crystallographica Section D 2005, 61 (11), 1476–1482. https://doi.org/10.1107/S0907444905025771.
- Heinemann, L.; Richter, B. Clinical Pharmacology of Human Insulin. Diabetes Care 1993, 16 (Supplement_3), 90–100. https://doi.org/10.2337/diacare.16.3.90.
- Brange, J.; Langkjsgmaeligr, L.; Havelund, S.; Vølund, A. Chemical Stability of Insulin. 1. Hydrolytic Degradation During Storage of Pharmaceutical Preparations. Pharm. Res. 1992, 9 (6), 715–726. https://doi.org/10.1023/A:1015835017916.
- Abdelrahman, R. M.; et al. Harnessing GLP-1 Receptor Agonists for Obesity Treatment: Prospects and Obstacles on the Horizon. J. Obes. 2025, 2025 (1), 9919810. https://doi.org/https://doi.org/10.1155/jobe/9919810.
- Fox, J.; Denbigh, L.; Berger, S.; Pittman, N. Accelerating GLP-1 Development with High-Throughput LC-MS Using the BioAccord™ LC MS System and the INTACT Mass Application; 2025. Waters Application Note 720009176.
- Fagan, A.; Bateman, L. M.; O’Shea, J. P.; Crean, A. M. Elucidating the Degradation Pathways of Human Insulin in the Solid State. J. Anal. Test. 2024, 8 (3), 288–299. https://doi.org/10.1007/s41664-024-00302-5.
- Andrasi, M.; et al. Determination of Deamidated Isoforms of Human Insulin Using Capillary Electrophoresis. J. Chromatogr. A 2020, 1626, 461344. https://doi.org/https://doi.org/10.1016/j.chroma.2020.461344.
- Yang, H.; Shiner, S. Separation of a GLP-1 Receptor Agonist and Structurally Similar Impurities Using BioResolve™ Peptide Phenyl‑Hexyl+ and C18+ Columns; Milford, 2026. Waters Application Note 720009465.
- Koza, S. M.; Shiner, S. J.; Lauber, M. A. Reversed-Phase LC-MS Analysis of Low-Abundance Impurities in a GLP-1a Therapeutic Using a Charged Surface 230Å Superficially Porous Phenyl-Hexyl Column. Milford, 2026. Waters Application Note 720009507.
- Domain, E.; Kozlova, N.; Addepalli, B.; Hanna, C.; Shiner, S. Unlocking Robust, Reproducible Separations for Modern Peptide Therapeutics with BioResolve™ Peptide Phenyl Hexyl+ Columns; Milford, 2026. Waters Application Note 720009487.
720009594, September 2026


