

For research use only. Not for use in diagnostic procedures.
- Main
-
For research use only. Not for use in diagnostic procedures.
Marshall McGoffa, Anuja Ranea, Yun Alelyunasb, Rui Chenb
a Incyte Corporation, Wilmington, Delaware, United States
b Waters Corporation, Immerse™ Lab, Delaware, United States
Published on September 21, 2026
For research use only. Not for use in diagnostic procedures.
Protein titer determination is a critical analytical measurement in bioprocess development, supporting cell selection, clone screening, and upstream process optimization. Rapid and reliable titer measurements are particularly important in development environments where large numbers of samples must be analyzed to support process decisions.
The analytical sciences team at Incyte Corporation’s Global BioPharmaceutical Development Group supports multiple internal bioprocess research and development programs in which hundreds of samples are routinely submitted for titer determination. To support these activities, the team has traditionally relied on a commercially available third-party Protein A Affinity Column for LC-based titer analysis.
While this Protein A Affinity Column has performed well historically, the group observed reduced chromatographic performance with several newer monoclonal and bispecific antibodies. In particular, some antibodies eluted as broad peaks, making integration and quantitation more challenging.
An evaluation of the Waters BioResolve Protein A Affinity Column was conducted to assess its performance for rapid antibody titer determination. This application note highlights a comparison between the BioResolve Protein A Affinity Column and the third-party column previously used at Incyte, focusing on chromatographic performance and suitability for routine titer analysis.
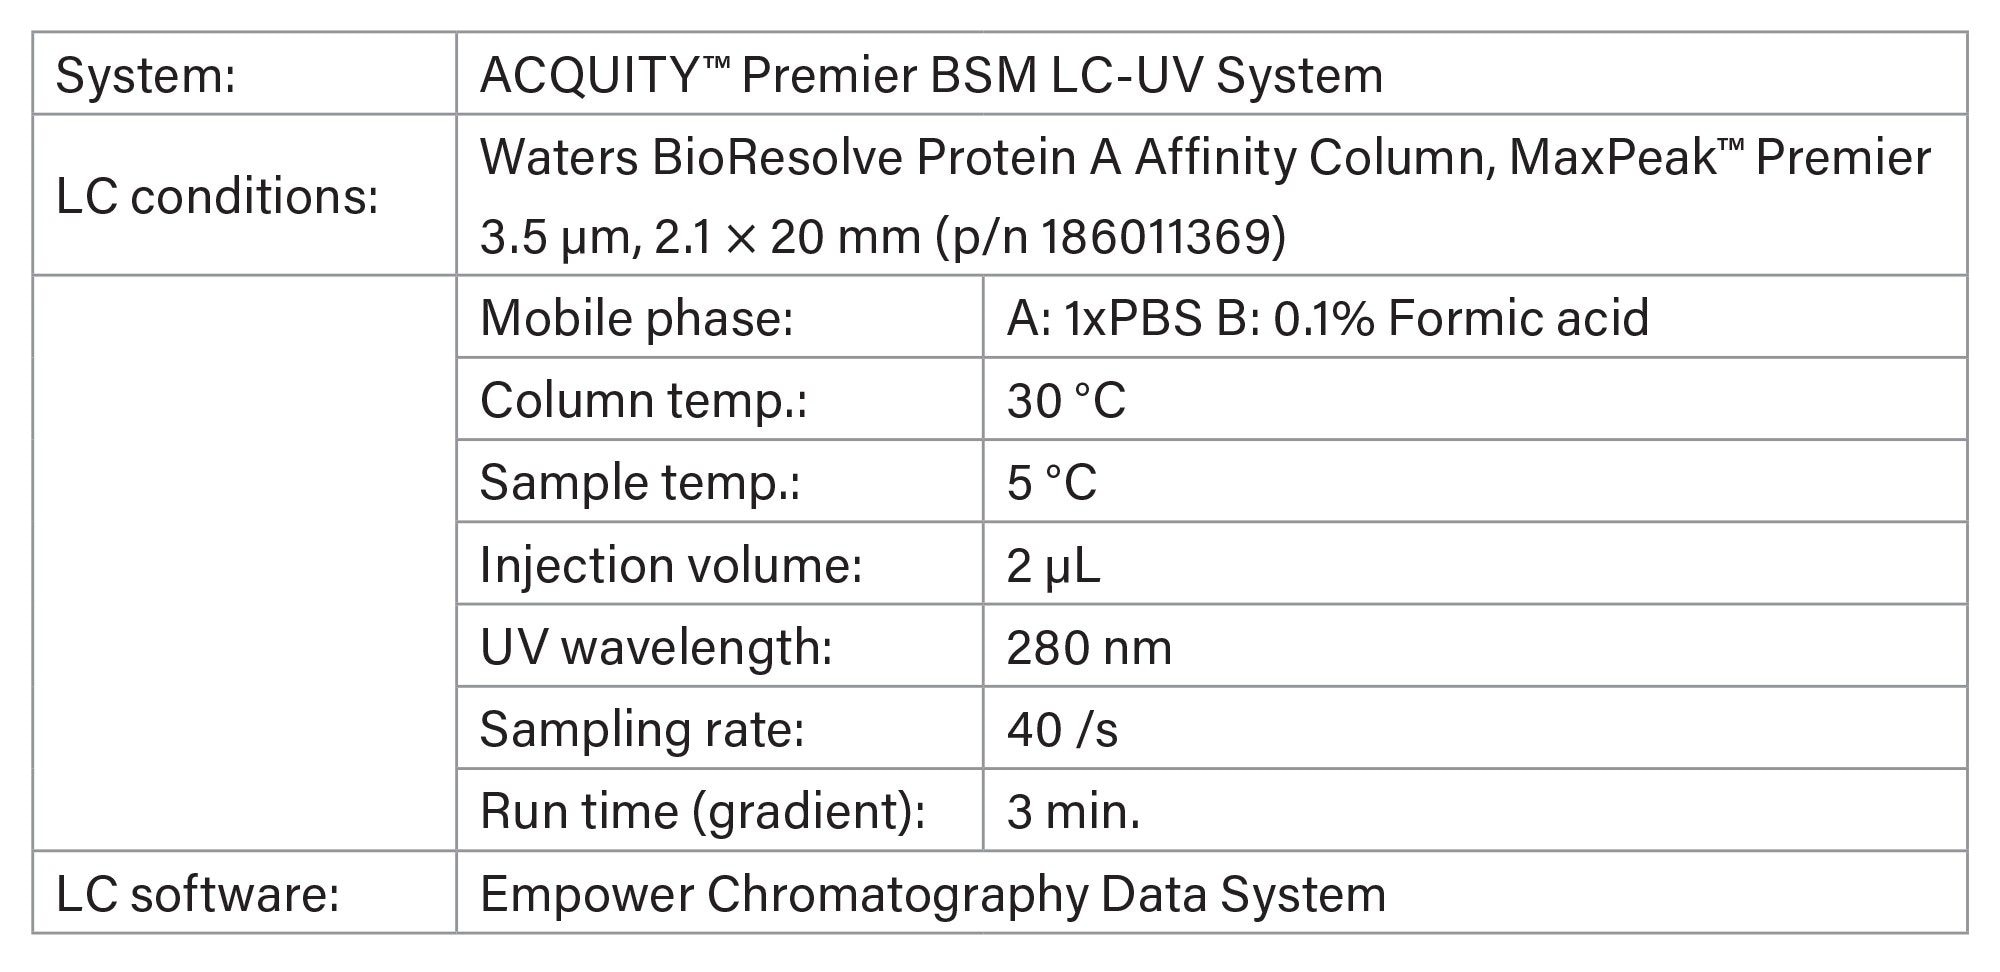
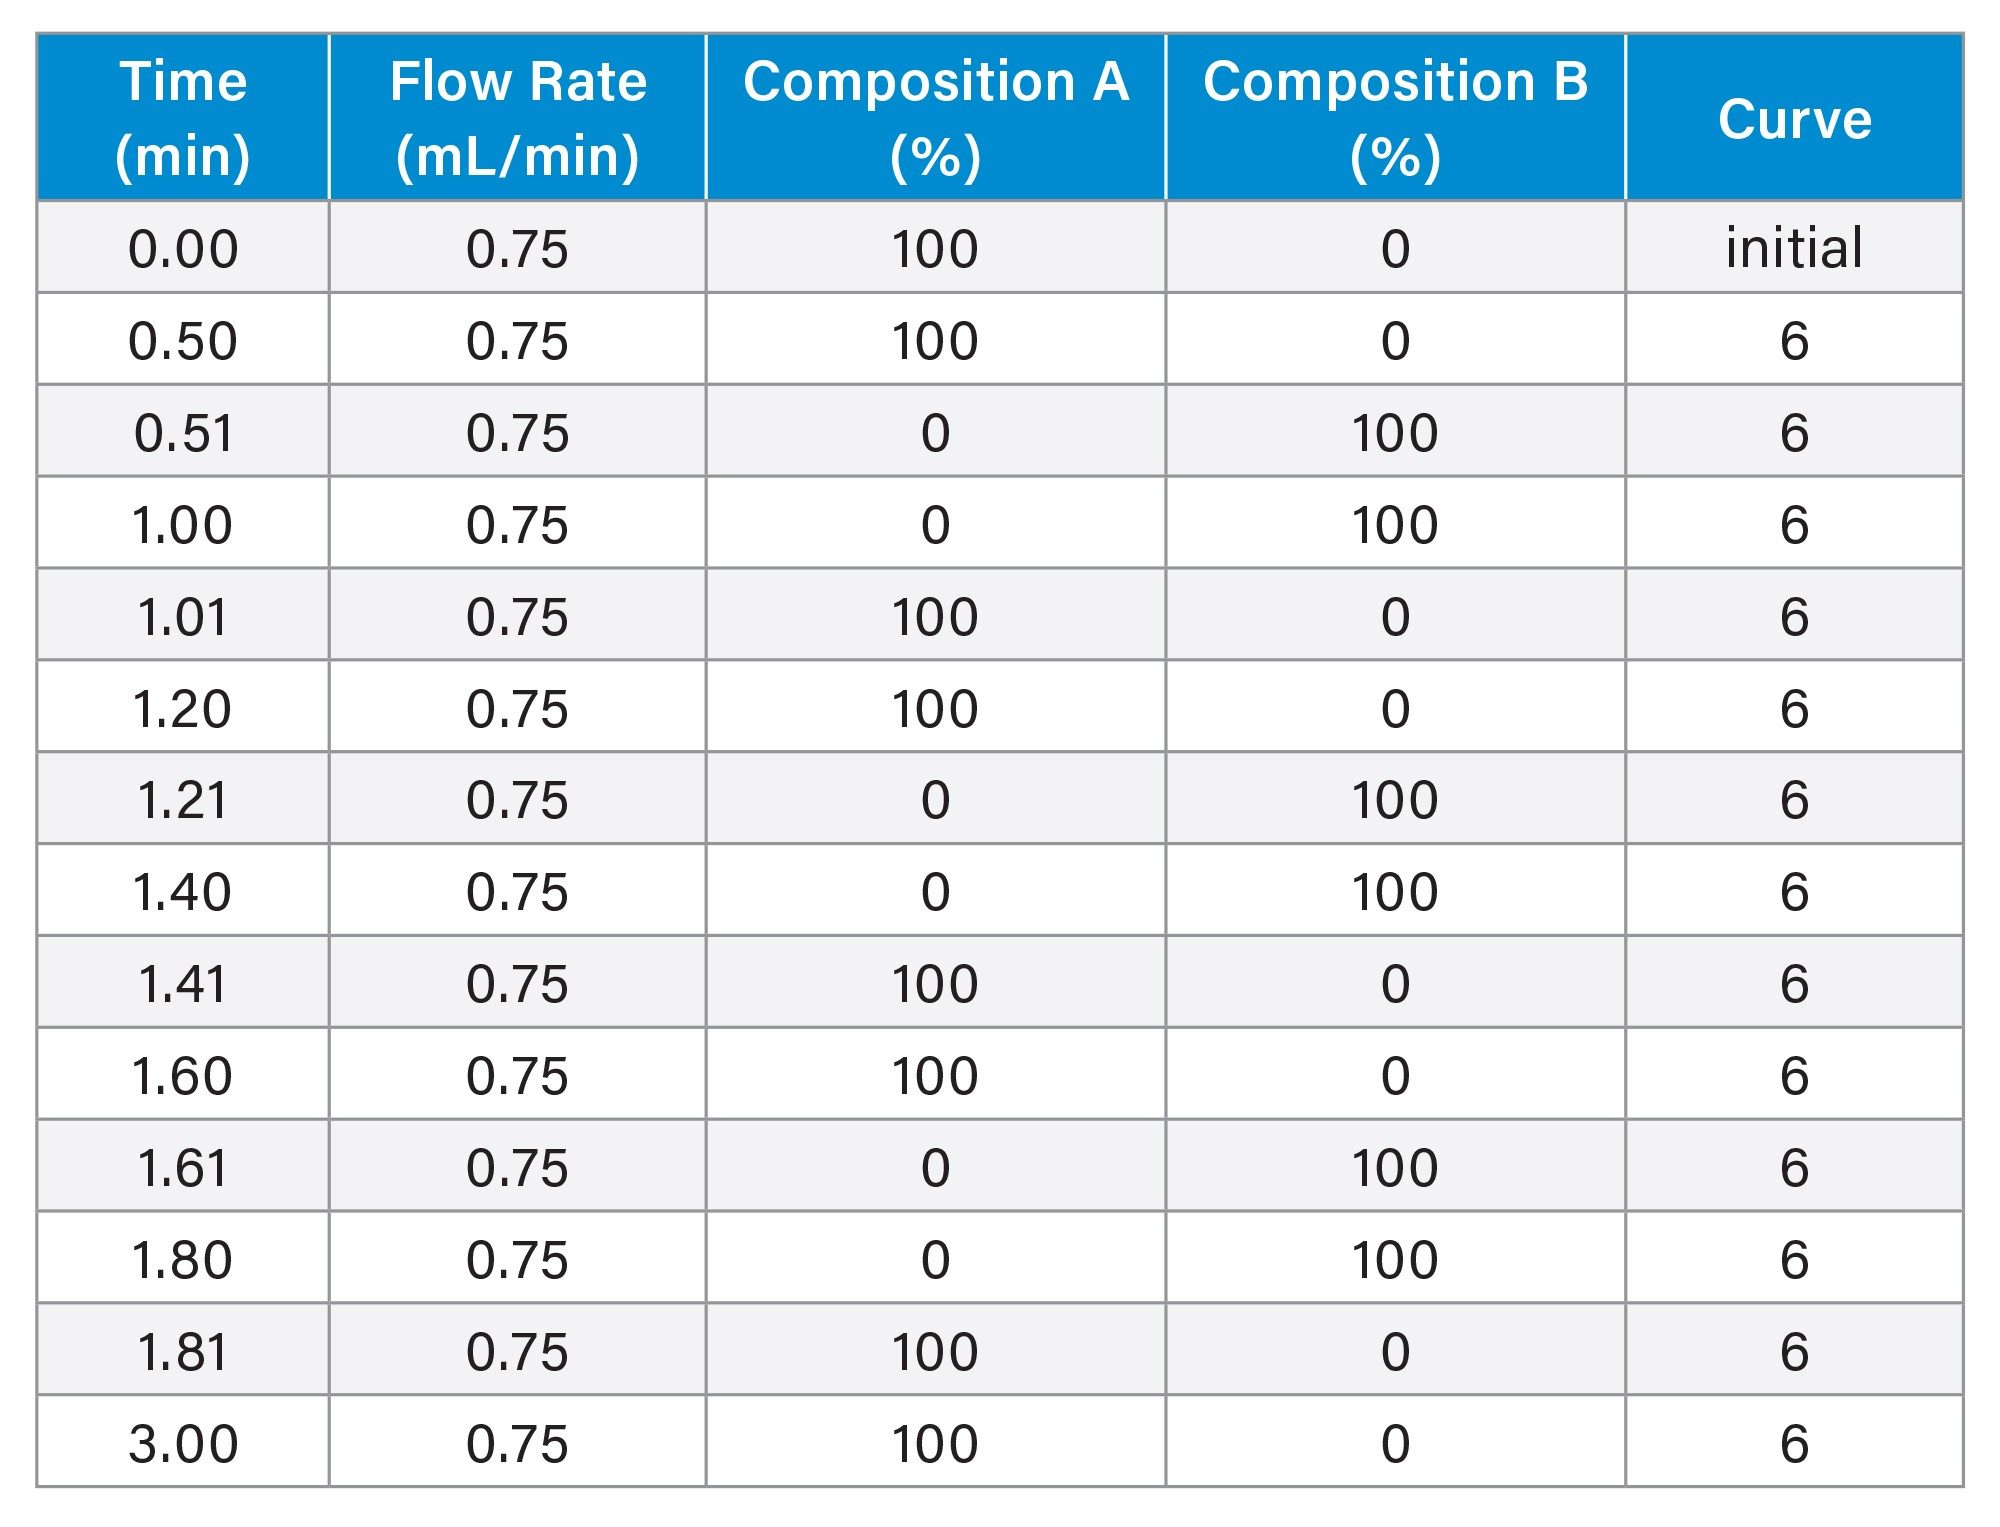
Bioreactor samples were clarified, filtered and centrifuged prior to analysis. Test samples were injected directly without dilution into the LC system.
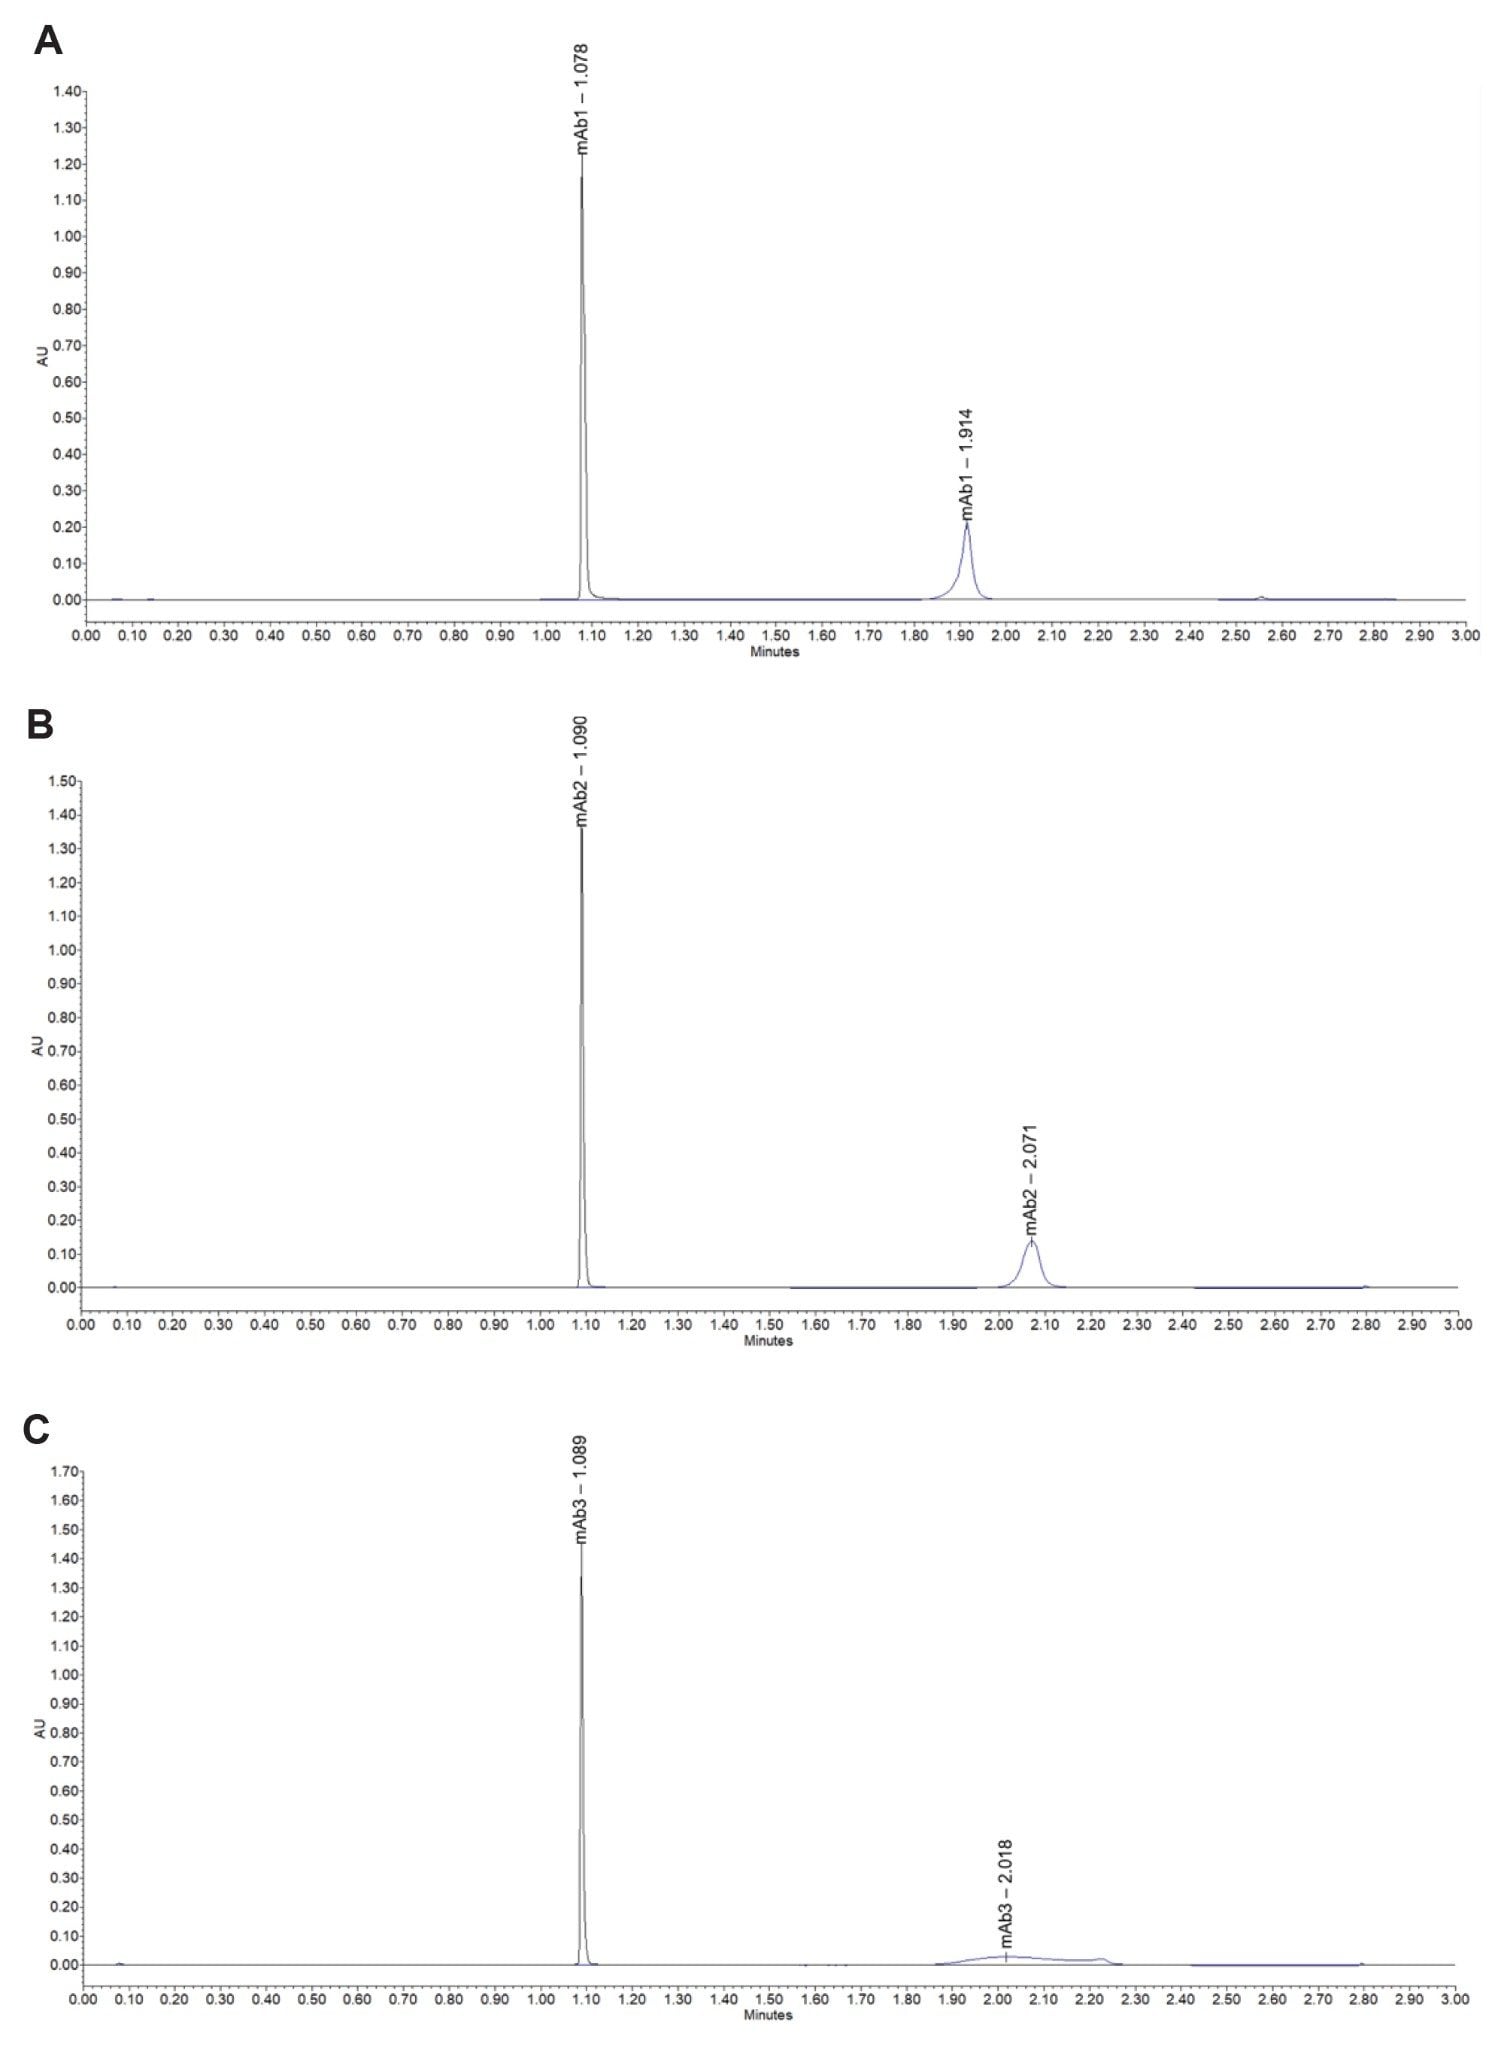
Three antibody profiles are shown as examples using both the BioResolve ProA Affinity Column and a third-party ProA titer column in Figure 1. These antibodies were challenging to quantify using the third-party column. The asymmetrical and broad peaks made peak integration and quantitation difficult, resulting in poor sensitivity and reduced reproducibility. When the same three antibodies were analyzed using the BioResolve ProA Affinity Column, sharp and symmetrical peaks were obtained. Compared to the third-party column, there was an approximately 80% reduction in peak width at baseline, from 18 seconds to 3.6 seconds. These shapened peak enabled confident and reproducible titer detrermination, supporting Incyte R&D bioprocess development efforts.
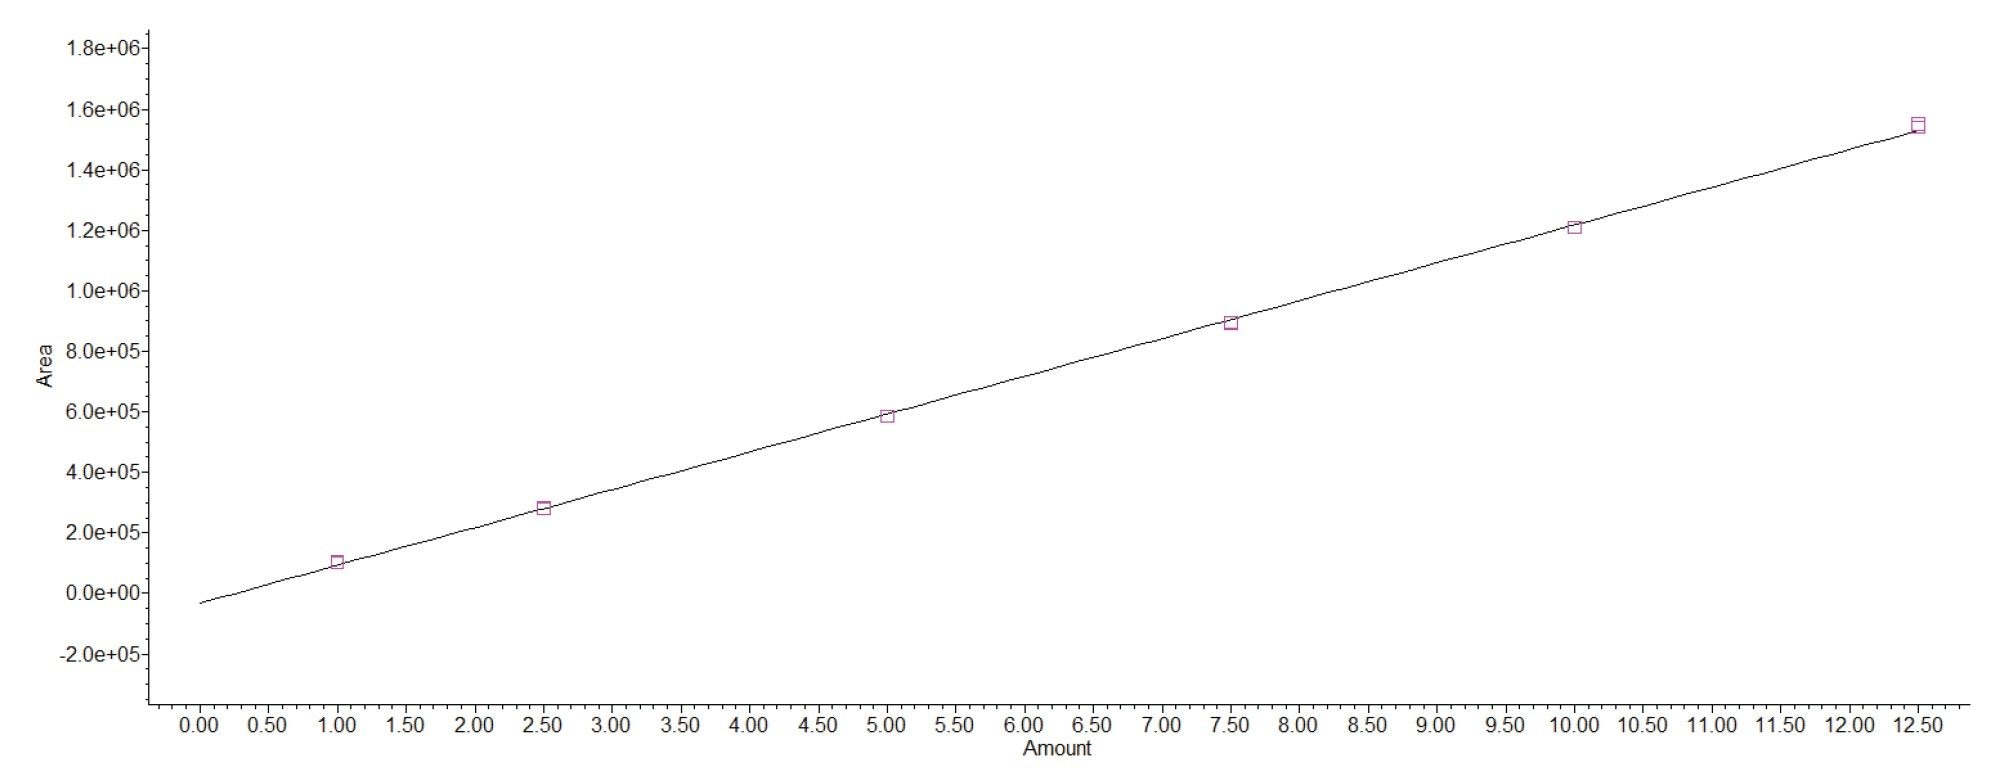
A calibration curve was generated by varying the injection volume of 1 mg/mL mAb 1 stock solution. The standard was injected at 1, 2, 5, 7.5, 10, and 12.5 µL, resulting in equivalent mass loads on column in the range of 1–12.5 ug. Figure 2 is a calibration curve of mAb 1 with n = 6 data points. The limit of quantitation (LOQ) was calculated at 0.4 µg using the standard curve standard deviation of the response (Sy) and the slope (S). For practical purposes, the LOQ will be rounded up to 1 µg. The results showed an excellent linear range from 1–10 µg on column with R2 = 0.9996.
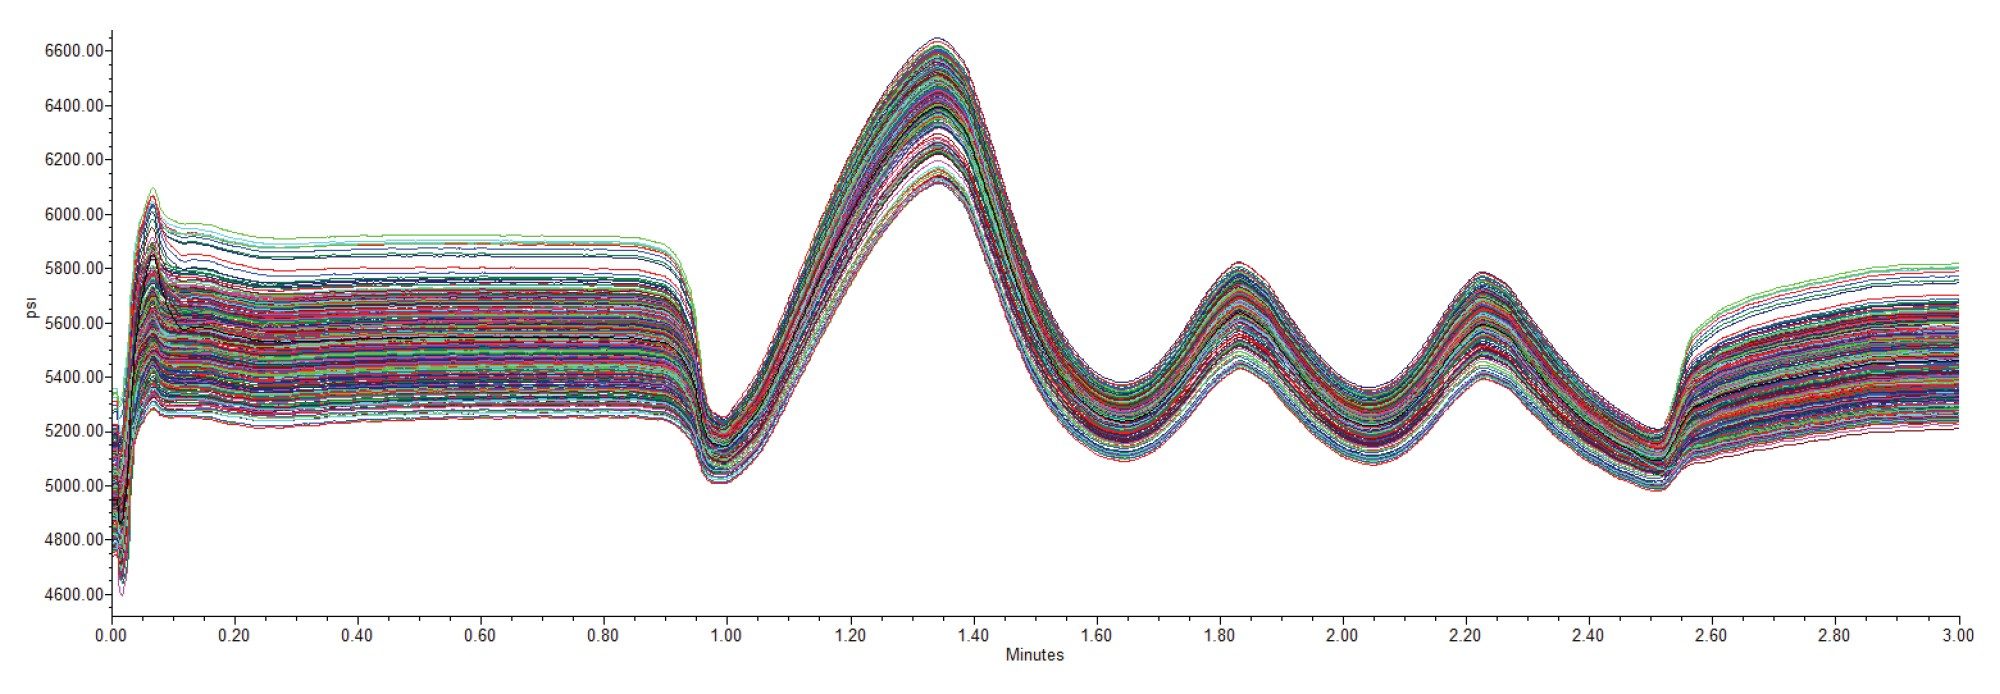
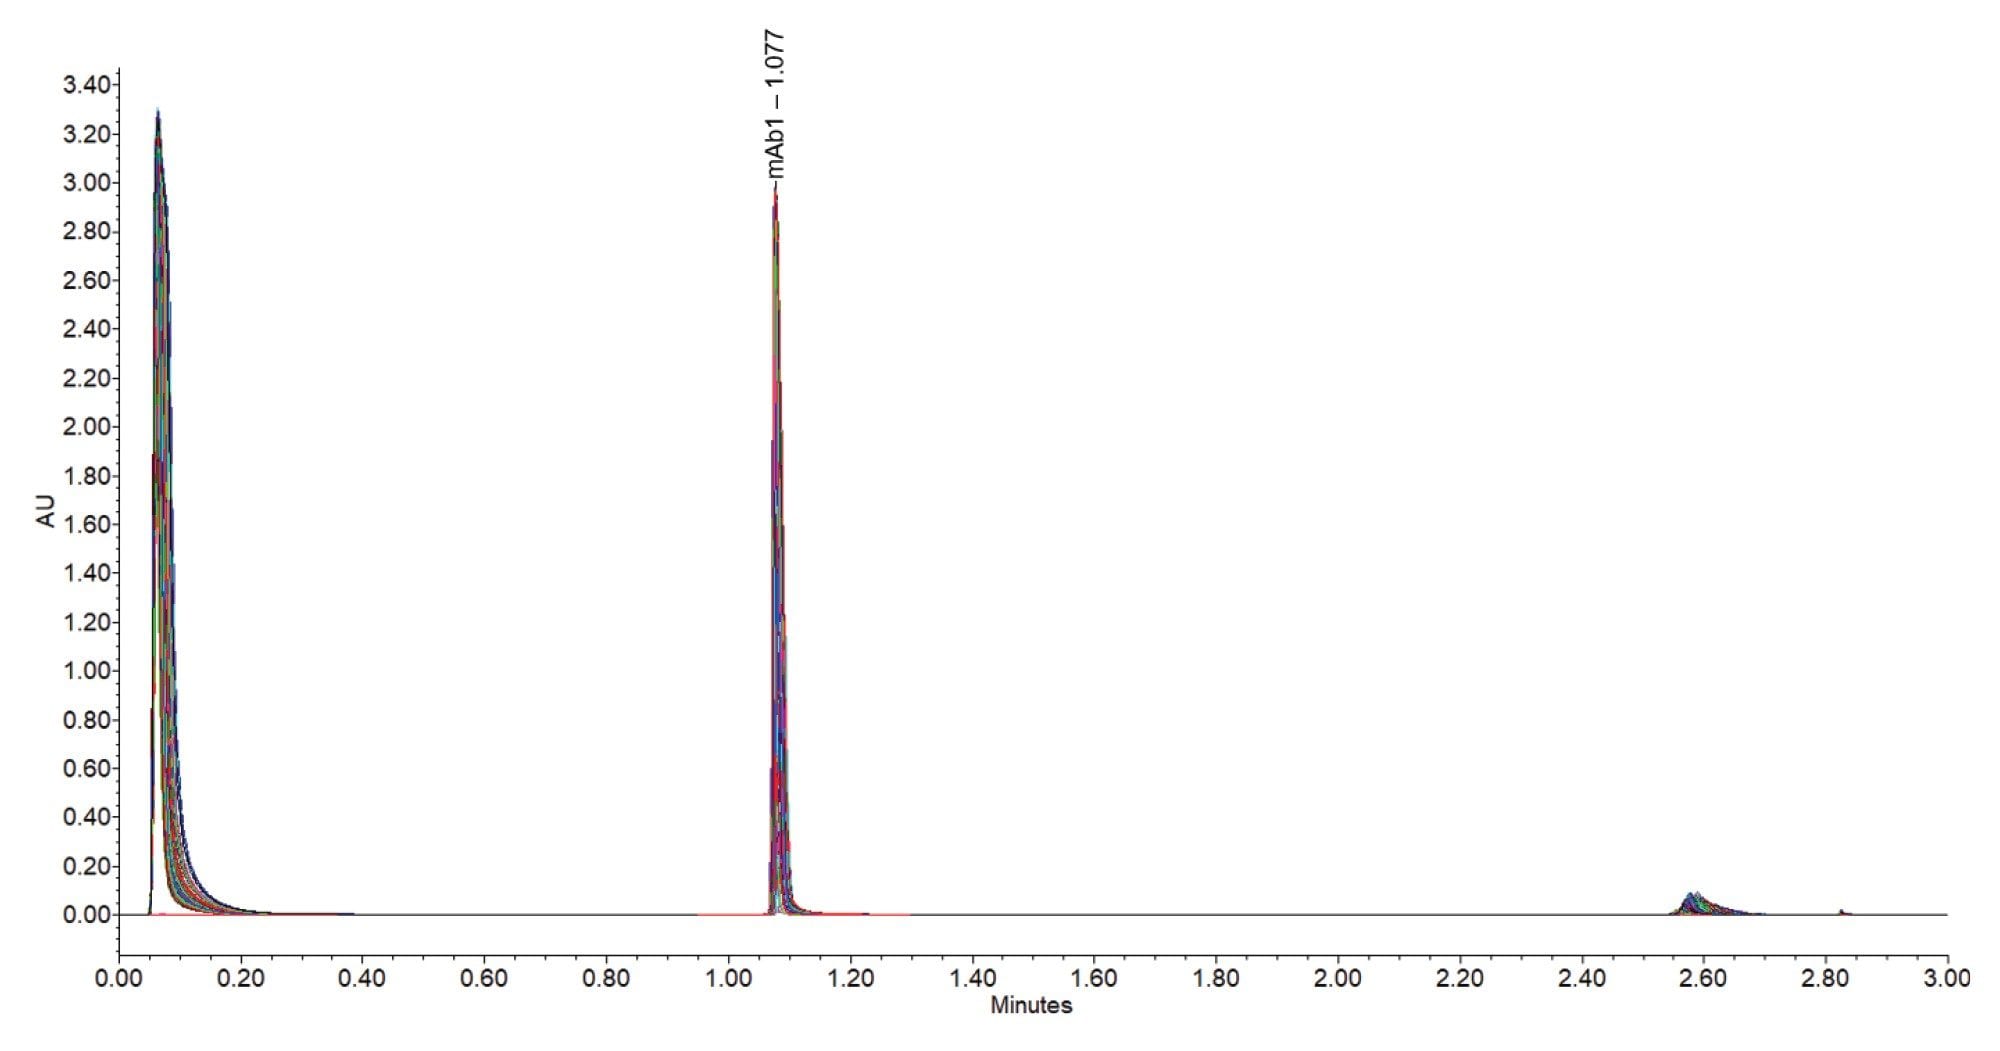
Column robustness was assessed by overlaying pressure traces for a 476 injection sequence. Figure 3 shows near-identical overlap of the pressure traces where the system pressure for the start and end of the run time ranged between 5200 and 6200 psi, suggesting robust system performance. Retention times for the eluted mAb were consistent throughout the run as shown in Figure 4.
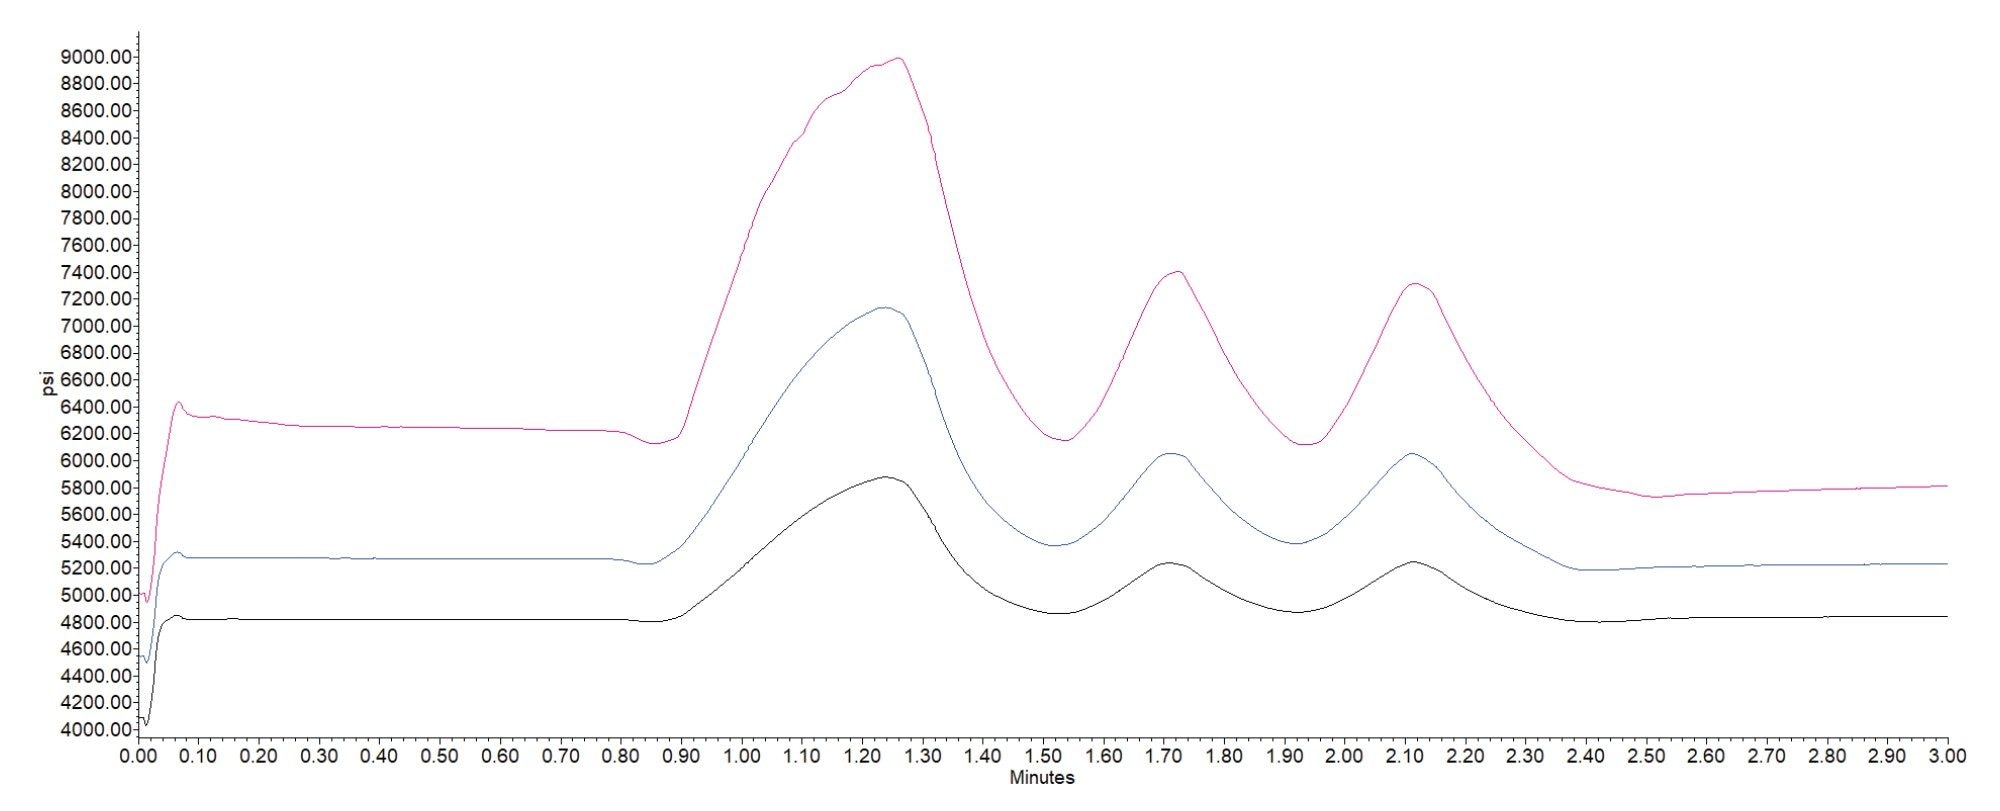
The performance of this BioResolve Protein A Affinity Column with a non-porous 3.5 μm particle size is highly linked to the quality of the bioreactor samples being tested. Unfiltered samples can result in quick pressure build-up and impact the column lifetime. Figure 5 displays the pressure traces of 200 injections on a brand new column; there is a notable difference of 4000 psi from the first to last injections. As such, all samples shoud be filtered prior to injection and incorporating cleaning injections every 10–20 samples to reduce pressure build-up. The robustness study showed consistent and reliable data over 400 injections on a single column with filtered samples.
These test results demonstrate that the performance of BioResolve ProA Affinity Column is superior to the third-party column for both mAb and bispecific antibodies tested at Incyte. The sharp and symmetrical antibody peaks enabled consistent and reproducible titer determination. Based on these evaluation studies, the BioResolve ProA Affinity Column has been adopted and pre-qualified for routine titer determination at Incyte.
Muriithi, B.; et al. High-Efficiency Analytical Protein A Columns for High Sensitivity Monoclonal Antibody Titer Analysis. Anal Chem. 2025 Dec 9;97(48):26349-26356.
Koza, S. M.; et al. 2025. Lowering Quantitation Limits for mAb Titer Measurements Using Small Volume 3.5 µm Particle-Size Protein-A Affinity Columns. Waters Application Note, 720008775, May 2025.
The authors would like to acknowledge Shannon Ford (PPD) for her enormous contribution to the work presented in this application note.
720009574, September 2026


