For research use only. Not for use in diagnostic procedures.
- Main
-
For research use only. Not for use in diagnostic procedures.
Robert Birdsall, Xiangsha Du, Pawel Bigos, Duanduan Han, Jennifer Simeone, Nikhil Bhiwankar
Waters Corporation, United States
Published on June 15, 2026
For research use only. Not for use in diagnostic procedures.
Liquid chromatography (LC) coupled with charged aerosol detection (CAD) is widely used for quantitative analysis of compounds that lack strong chromophores, including lipids, surfactants, carbohydrates, and small molecule impurities. As a universal, mass‑dependent detector, CAD enables detection of analytically challenging analytes; however, detector response is inherently non-linear as a result of aerosol formation and detection properties. To address this behavior, CAD instruments provide an adjustable power function value (PFV) setting that effectively extends the linear response range during data acquisition.
Traditionally, selection of PFV settings has relied on empirical trial‑and‑error experimentation requiring multiple calibration curves and repeated injections. This application note presents a model‑based approach that uses calibration data acquired at a single reference condition (PFV = 1.00) to characterize intrinsic detector response and to predict operating PFV ranges that provide linear behavior. Using an inverse power function framework, detector response is simulated forward to define confidence‑based working ranges.
This data-driven strategy enables objective optimization of CAD settings during method development and can be readily adapted to manufacturing environments. The approach reduces experimental burden while improving quantitative robustness and consistency.
Universal aerosol‑based detectors are widely employed for quantitative LC analysis of compounds that lack strong chromophores, including lipids, surfactants, carbohydrates, and selected small molecule impurities.1–5 Their broad applicability and mass‑dependent response make these detectors well suited for pharmaceutical research, method development, and quality control applications. However, detector response for aerosol‑based techniques is inherently non-linear with respect to analyte amount due to aerosol formation, particle size distribution, and properties intrinsic to detector operation.6
To manage this non-linear behavior, CAD instruments provide user‑defined response scaling parameters, such as PFV, that can be applied during data acquisition to extend the effective linear response range. In practice, selection of PFV settings is commonly performed empirically by evaluating calibration performance across multiple detector settings. While this approach is widely used, it can require repeated experimental iterations and does not inherently provide insight into the relationship between detector scaling, quantitative uncertainty, and usable working range.
This application note describes a model‑based, data‑driven approach for optimizing CAD response using an inverse power function framework. Calibration data acquired at a single reference setting (PFV = 1.00) is used to characterize intrinsic detector response behavior and to predict the effective linear operating range at alternative PFV settings. This strategy supports objective selection of detector parameters expediting method development and deployment in manufacturing environments.
All lipids in this study were used for research and demonstration purposes and were purchased from the following vendors: cholesterol and DSPC from Sigma-Aldrich; DMG-PEG 2000 and SM-102 from Cayman Chemical. Stocks of each lipid were prepared in methanol at 5 mg/mL and diluted to the appropriate concentration at 90/10 water/methanol (v/v). Data acquisition and analysis was performed in Empower CDS and Microsoft® Excel® Software.
|
LC system: |
ACQUITY™ Premier System (BSM) |
|
Detection: |
TUV, λ = 200 / 280 nm FC = 5mm Ti, 1Hz, time constant = normal |
|
Column: |
Waters GTxResolve™ Lipid Phenyl-Hexyl+ RP Column, MaxPeak™ Premier Technology, SPP, 1.6µm, 230Å, 2.1 x 50 mm (p/n: 186011698) |
|
Column temperature: |
50 °C |
|
Sample temperature: |
Ambient |
|
Injection volume: |
3 µL |
|
Flow rate: |
0.400 mL/min |
|
Mobile phase: |
A: 0.1% formic acid in water B: 50:50 MeOH:MeCN, 0.1% formic acid |
|
Chromatography software: |
Empower CDS |
|
CAD settings |
|
|
Sampling rate: |
10 Hz |
|
Time constant: |
Normal |
|
Ion trap: |
20 V |
|
Evaporation temperature: |
35 °C |
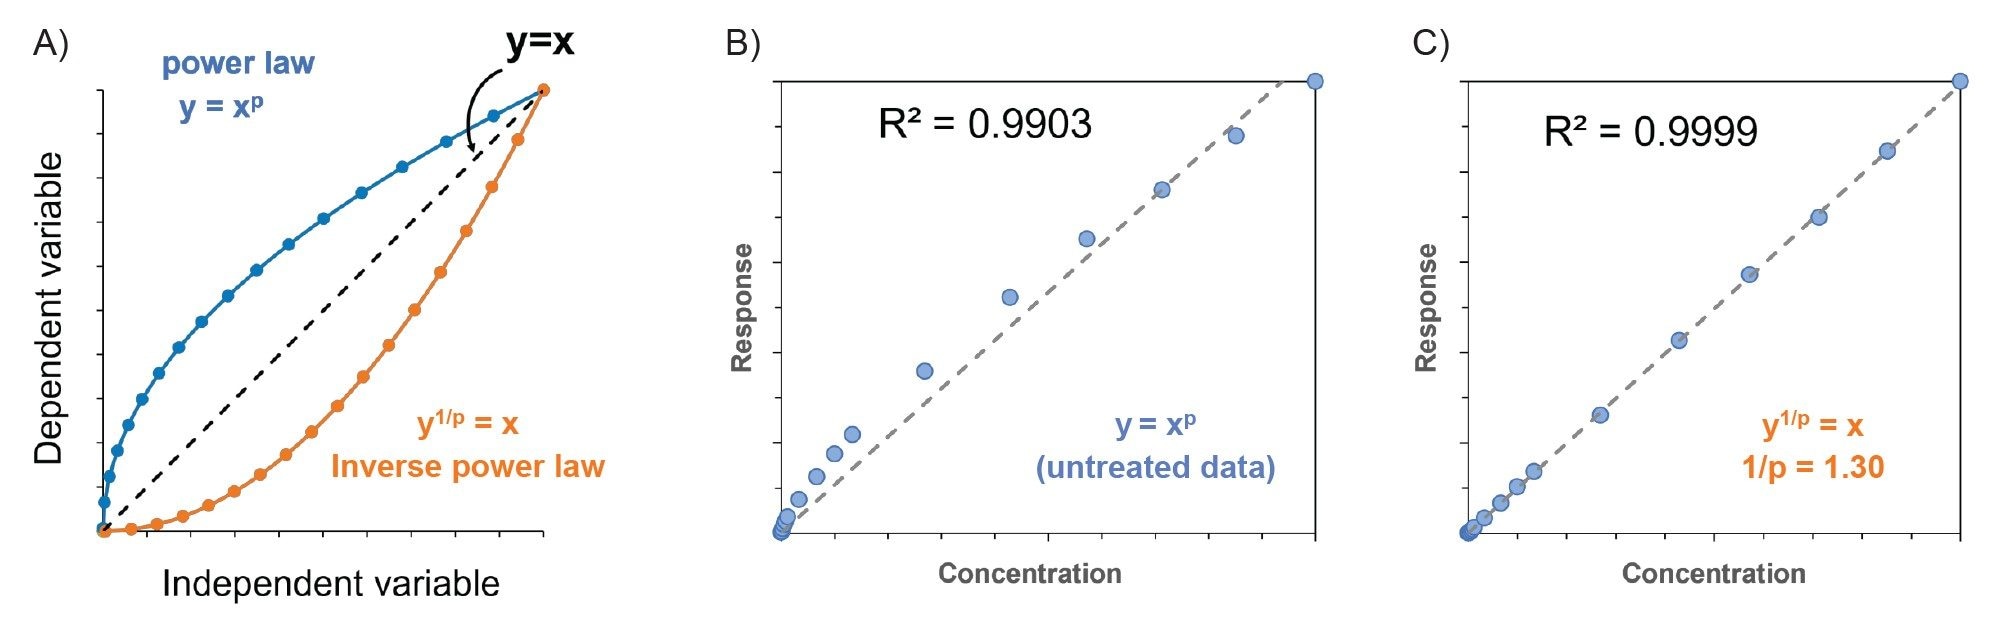
The response of a CAD can be described by a power law relationship, in which detector signal is proportional to analyte amount raised to an exponential term. When calibration data acquired at PFV = 1.00 are assessed on linear axes, this relationship results in a characteristic non-linear response across wide concentration ranges (Figure 1A, blue curve). This curvature reflects the intrinsic behavior of the detector rather than experimental artifacts. The PFV, described as the reciprocal of the exponent term of the power law response curve, serves as a correction factor during acquisition.5 By optimizing this setting, CAD response can be transformed such that the effective exponent term in the response curve approaches a value of 1.0 resulting in a linearized response over a defined operating range.
As shown in Figure 1A, the inverse power function provides a mathematical basis in determining a linear operating range post-acquisition. The exponent term describing intrinsic detector response is preserved wherein an optimal PFV (i.e. 1/p) can be estimated directly from PFV = 1.00 calibration data, enabling predictive modeling without modification of raw analytical results. An example of this approach is shown in Figure 1B, where calibration data acquired at PFV = 1.00 can be modeled using ordinary least squares regression to estimate the intrinsic response exponent necessary to achieve a linear response (Figure 1C).
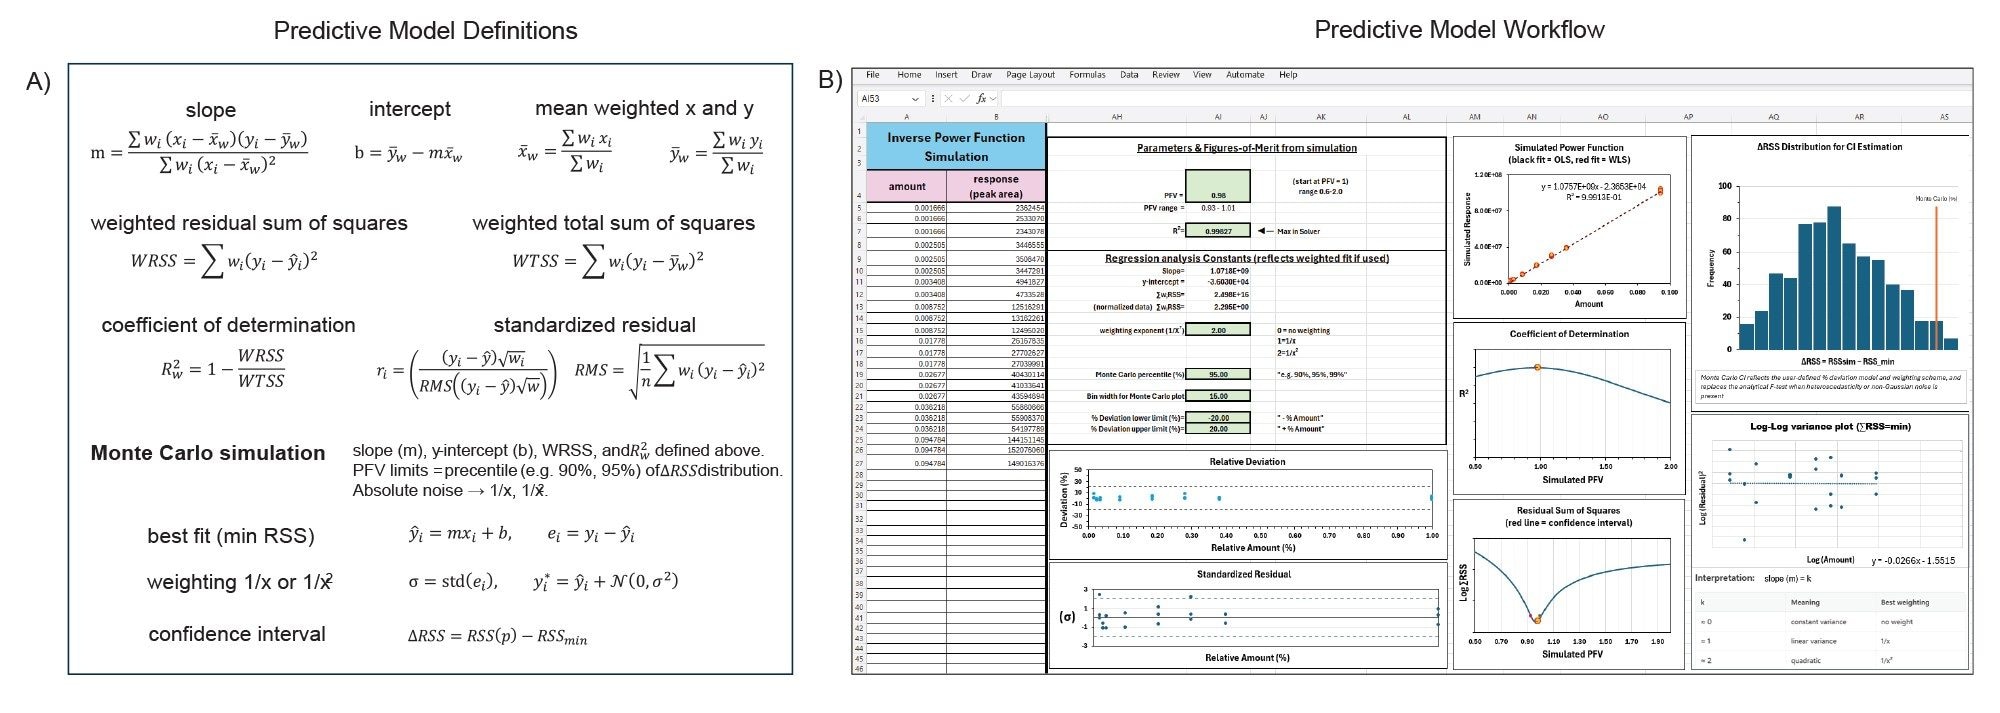
While Figure 1 establishes the theoretical basis for correcting intrinsic CAD nonlinearity using an inverse power function, practical application requires translating this relationship into a quantitative framework that can operate directly on experimental calibration data. To achieve this, PFV = 1.00 calibration data were modeled using standard regression techniques to estimate the intrinsic response exponent and forward‑simulate detector behavior across alternate PFV settings.
This predictive modeling framework enables objective estimation of expected linearity, deviation, and usable working range at different PFVs without acquiring additional experimental calibration data. The approach allows detector settings to be evaluated systematically using standard regression metrics rather than empirical trial‑and‑error experimentation, improving efficiency and robustness during method development.
Implementation of this framework can be deployed using commonly available statistical tools. An example of a globally accessible implementation using Microsoft Excel Software is shown in Figure 2, where model‑derived metrics including coefficient of determination (R²), residual behavior, and weighting effects, are dynamically linked to a user‑defined PFV setting. These metrics are presented both numerically for the current PFV under evaluation and visually across a continuous PFV sweep representing instrument range from 0.60 to 2.00, supporting global assessment of detector operating conditions.
Lipid nanoparticle (LNP) components were selected as a representative analytical system to demonstrate the utility of the inverse power function modeling approach (Figure 3). The formulation includes ionizable lipid (SM-102), cholesterol, phospholipid (DSPC), and PEGylated lipid (DMG‑PEG 2000), spanning a wide polarity and concentration range typical of LNP analysis. This chemical diversity provides a relevant and challenging test case for evaluating CAD linearity, dynamic range, and regression behavior.
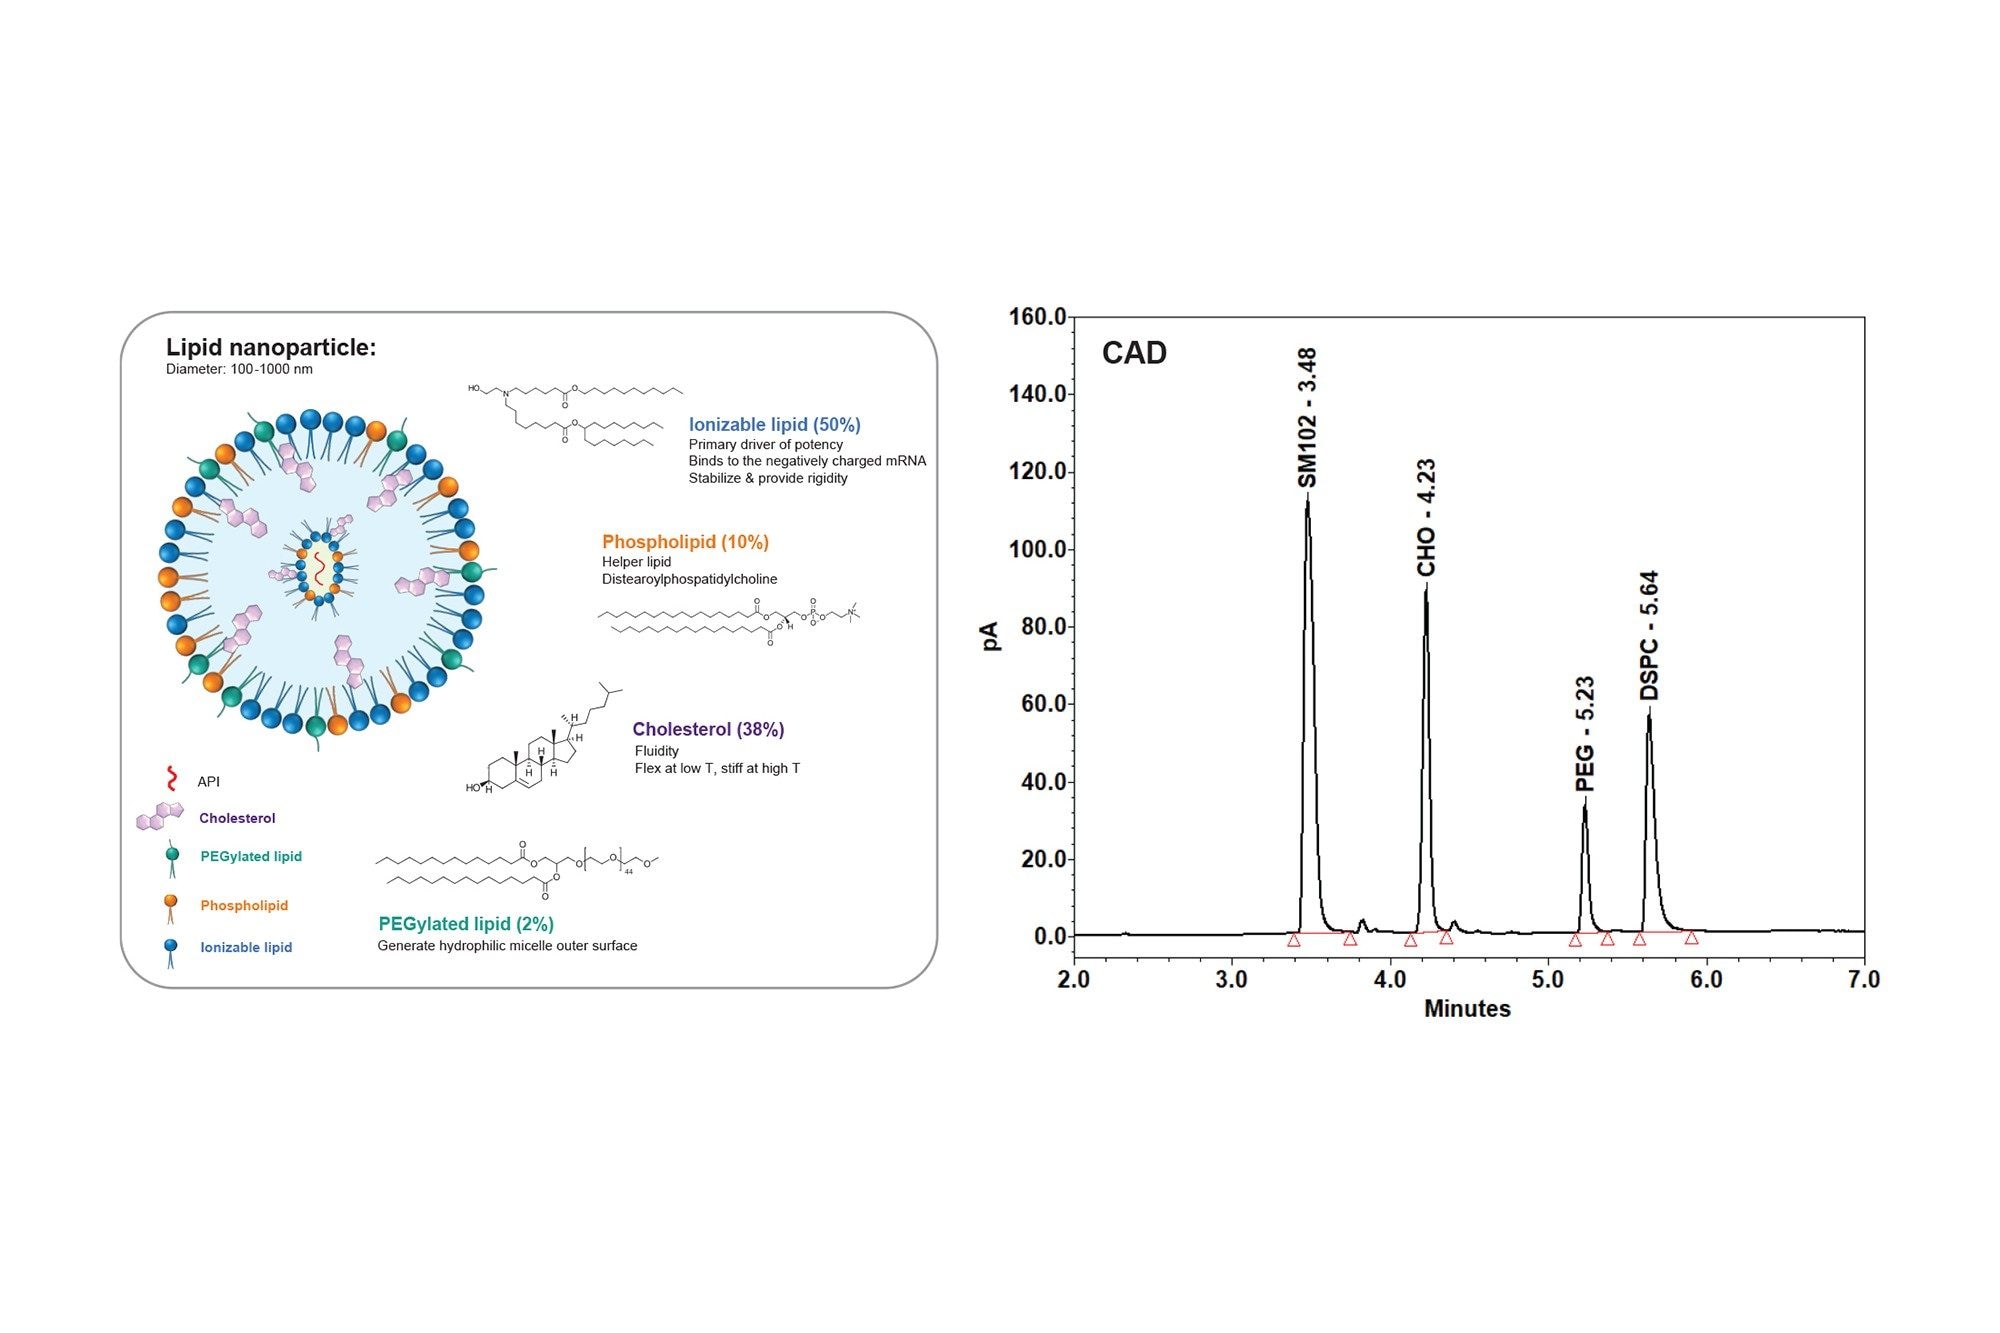
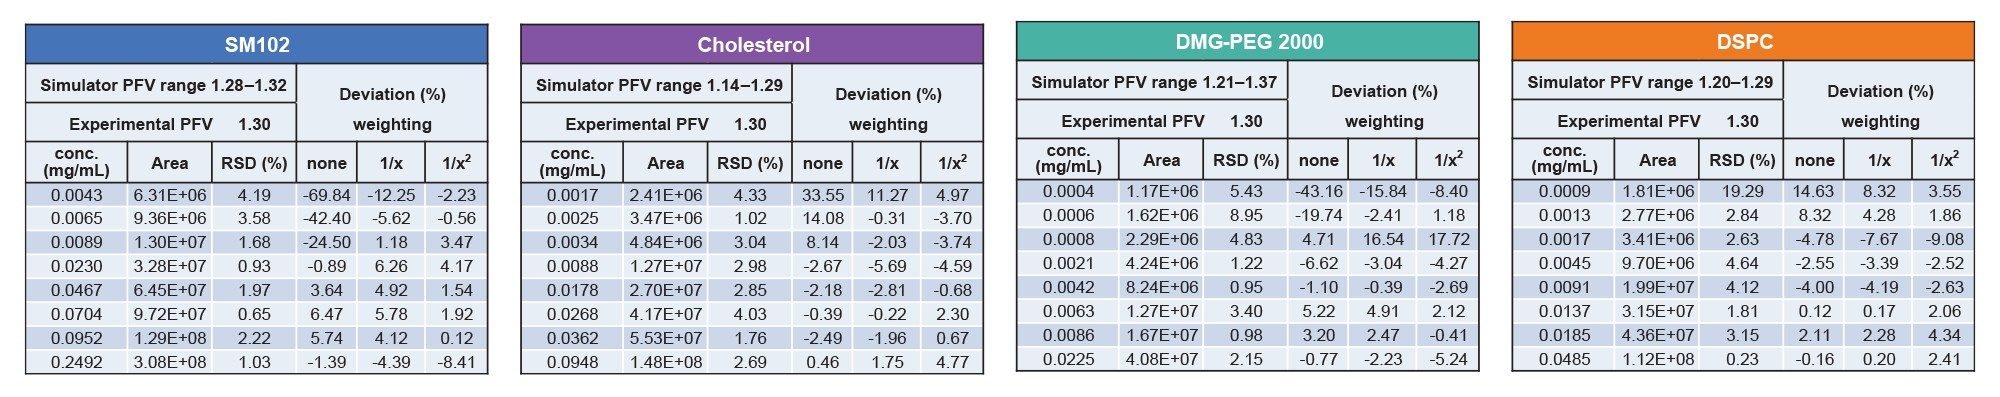
To determine the effective linear response range for each lipid species, concentration and associated peak area for a calibration plot acquired at an instrument setting of PFV = 1.00 were imported into the model (column A and B). The R2 cell was “maximized” using the solver tool in the Microsoft Excel Software to change the PFV cell within a range of 0.60-2.00. Confidence intervals were assigned at 95% using Monte Carlo simulation with Gaussian noise derived from the residual standard deviation. This effectively provides a range of PFVs to evaluate during optimization. Using this approach, PFV settings ranging between 1.14-1.34 were identified as offering predictable linear response for the four LNP species. To test the accuracy of the model, experimental data was acquired at PFV = 1.30 and is shown in the tables of Figure 4. While correlation coefficients provide a useful initial assessment of calibration performance, evaluation of residual behavior offers additional insight into quantitative reliability.
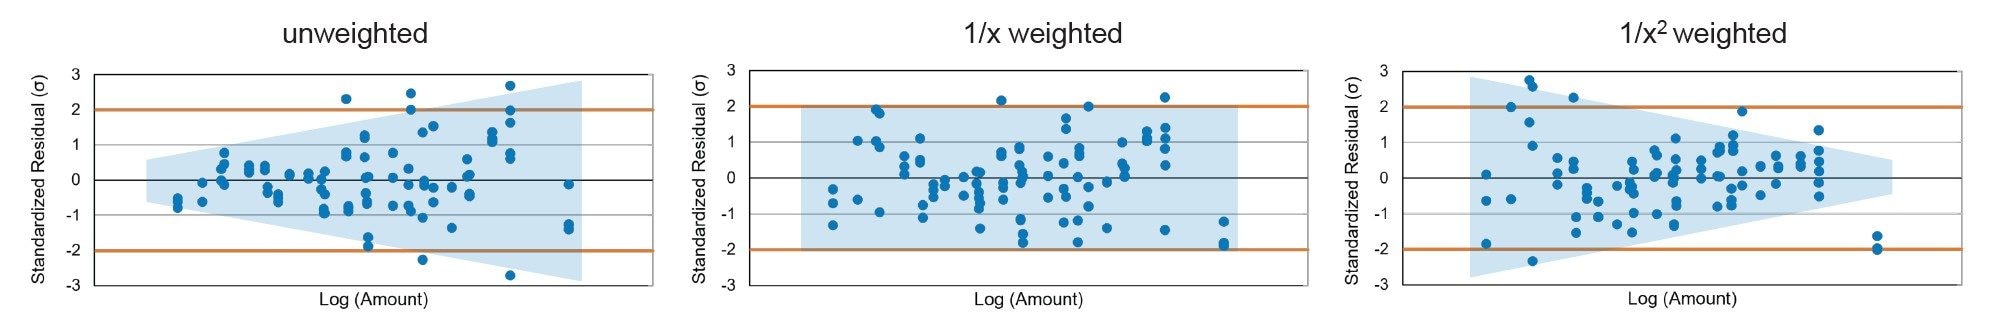
Because CAD calibration data inherently exhibit heteroscedastic variance across wide dynamic ranges, predicted linearity must be evaluated not only through correlation metrics but also through residual behavior and appropriate regression weighting. Application of 1/x and 1/x² weighting schemes improved accuracy relative to unweighted regression, as shown in Figure 4. To determine the most appropriate weighting strategy, standardized residuals were evaluated across all LNP species as a function of analyte amount. As shown in Figure 5, unweighted regression exhibited expanding residual variance across the calibration range, indicative of heteroscedasticity, while application of 1/x² weighting produced excessive compression of residuals, consistent with overweighting at lower concentrations. In contrast, 1/x weighting resulted in approximately constant variance across the concentration range, with most residuals contained within ±2 standardized deviation units and were therefore selected for comparative analysis.
These diagnostics support objective definition of an effective linear working range and inform appropriate selection of regression weighting strategies. This variance‑ and residual‑based evaluation of linearity is consistent with the principles outlined in ICH Q2 for defining method linearity and range as well as provides a more informative basis for assessing quantitative performance than correlation metrics alone.6
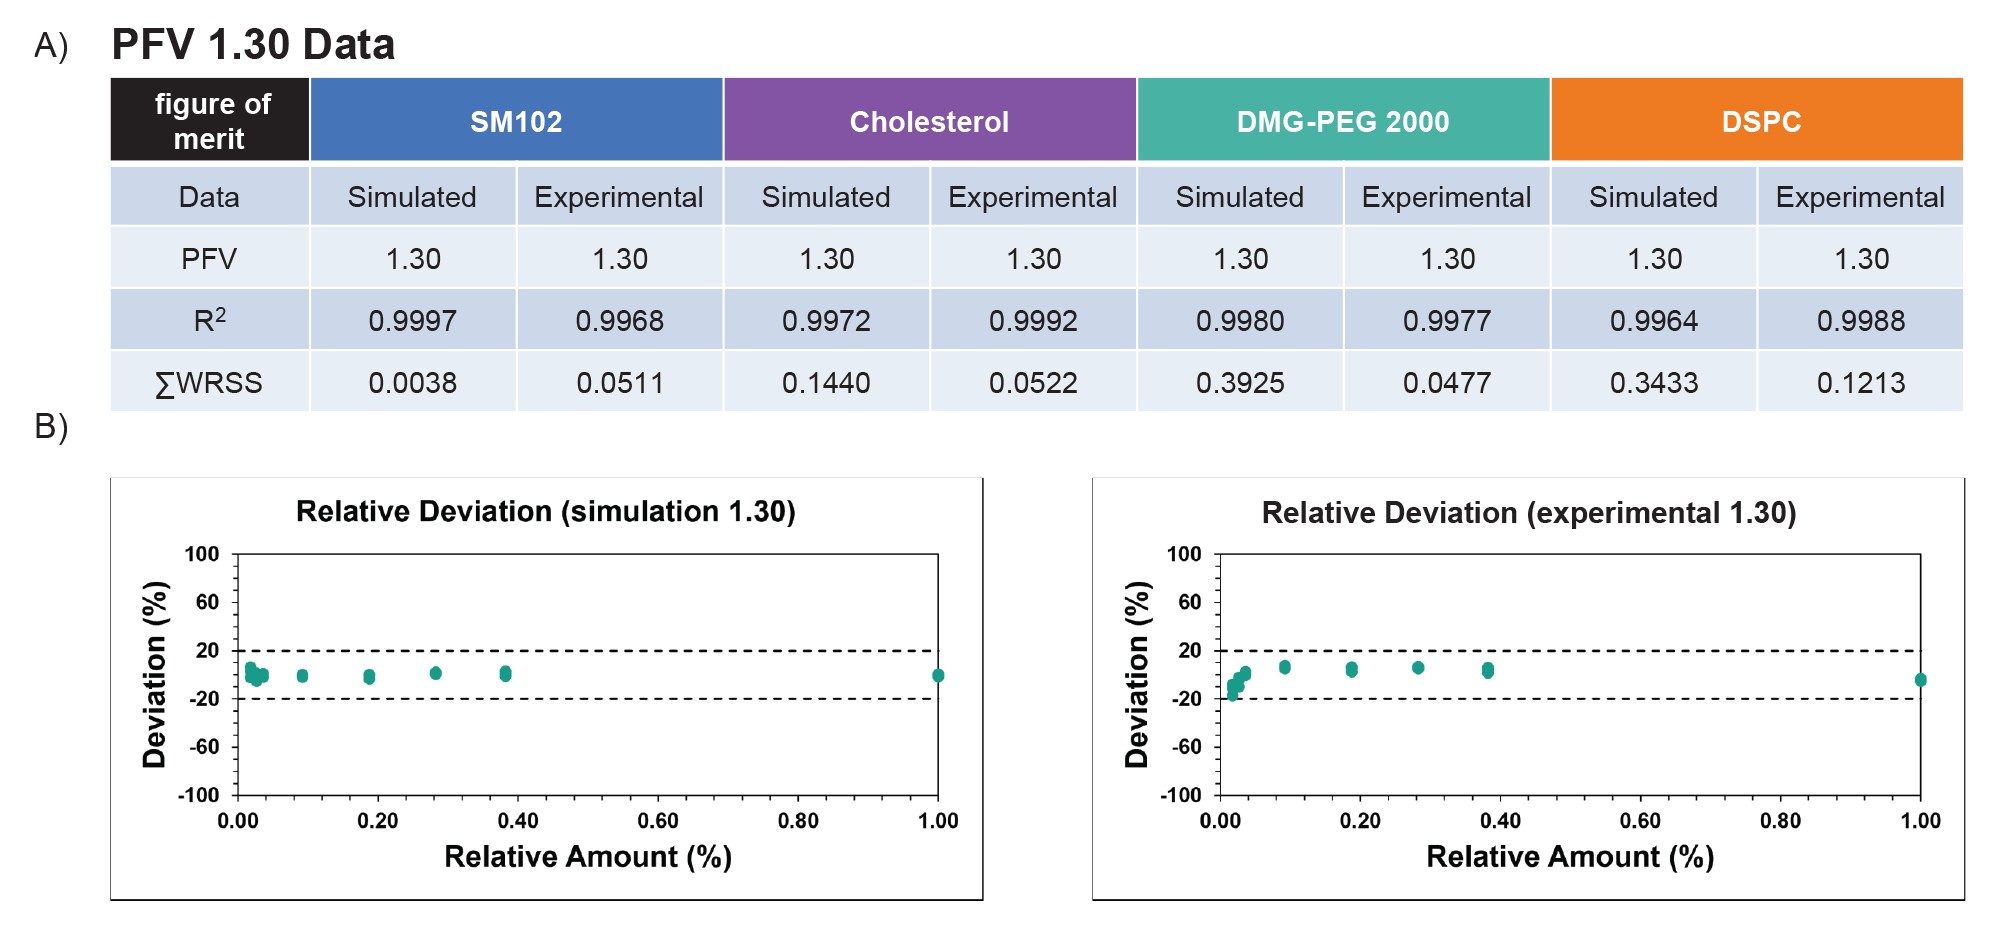
Regression statistics derived from experimentally acquired calibration data acquired at PFV = 1.30 were compared to simulation raw data (PFV = 1.00) using a simulator setting of 1/p=1.30. Both data sets were evaluated with 1/x weighting. As summarized in Figure 6A, experimental data was in good agreement with the simulation in terms of correlation factor and residual behavior. Notably, experimental data for all LNP species were within ≤ 0.08 of their optimal PFV when imported into the simulator, demonstrating the ability of the model to predict key experimental performance characteristics, including correlation coefficients, residual trends, and relative deviation across the calibration range (Figure 6B).
Collectively, these results demonstrate that inverse power function modeling based on PFV = 1.00 calibration data provides an accurate representation of intrinsic CAD response behavior and can be used to inform detector configuration decisions.
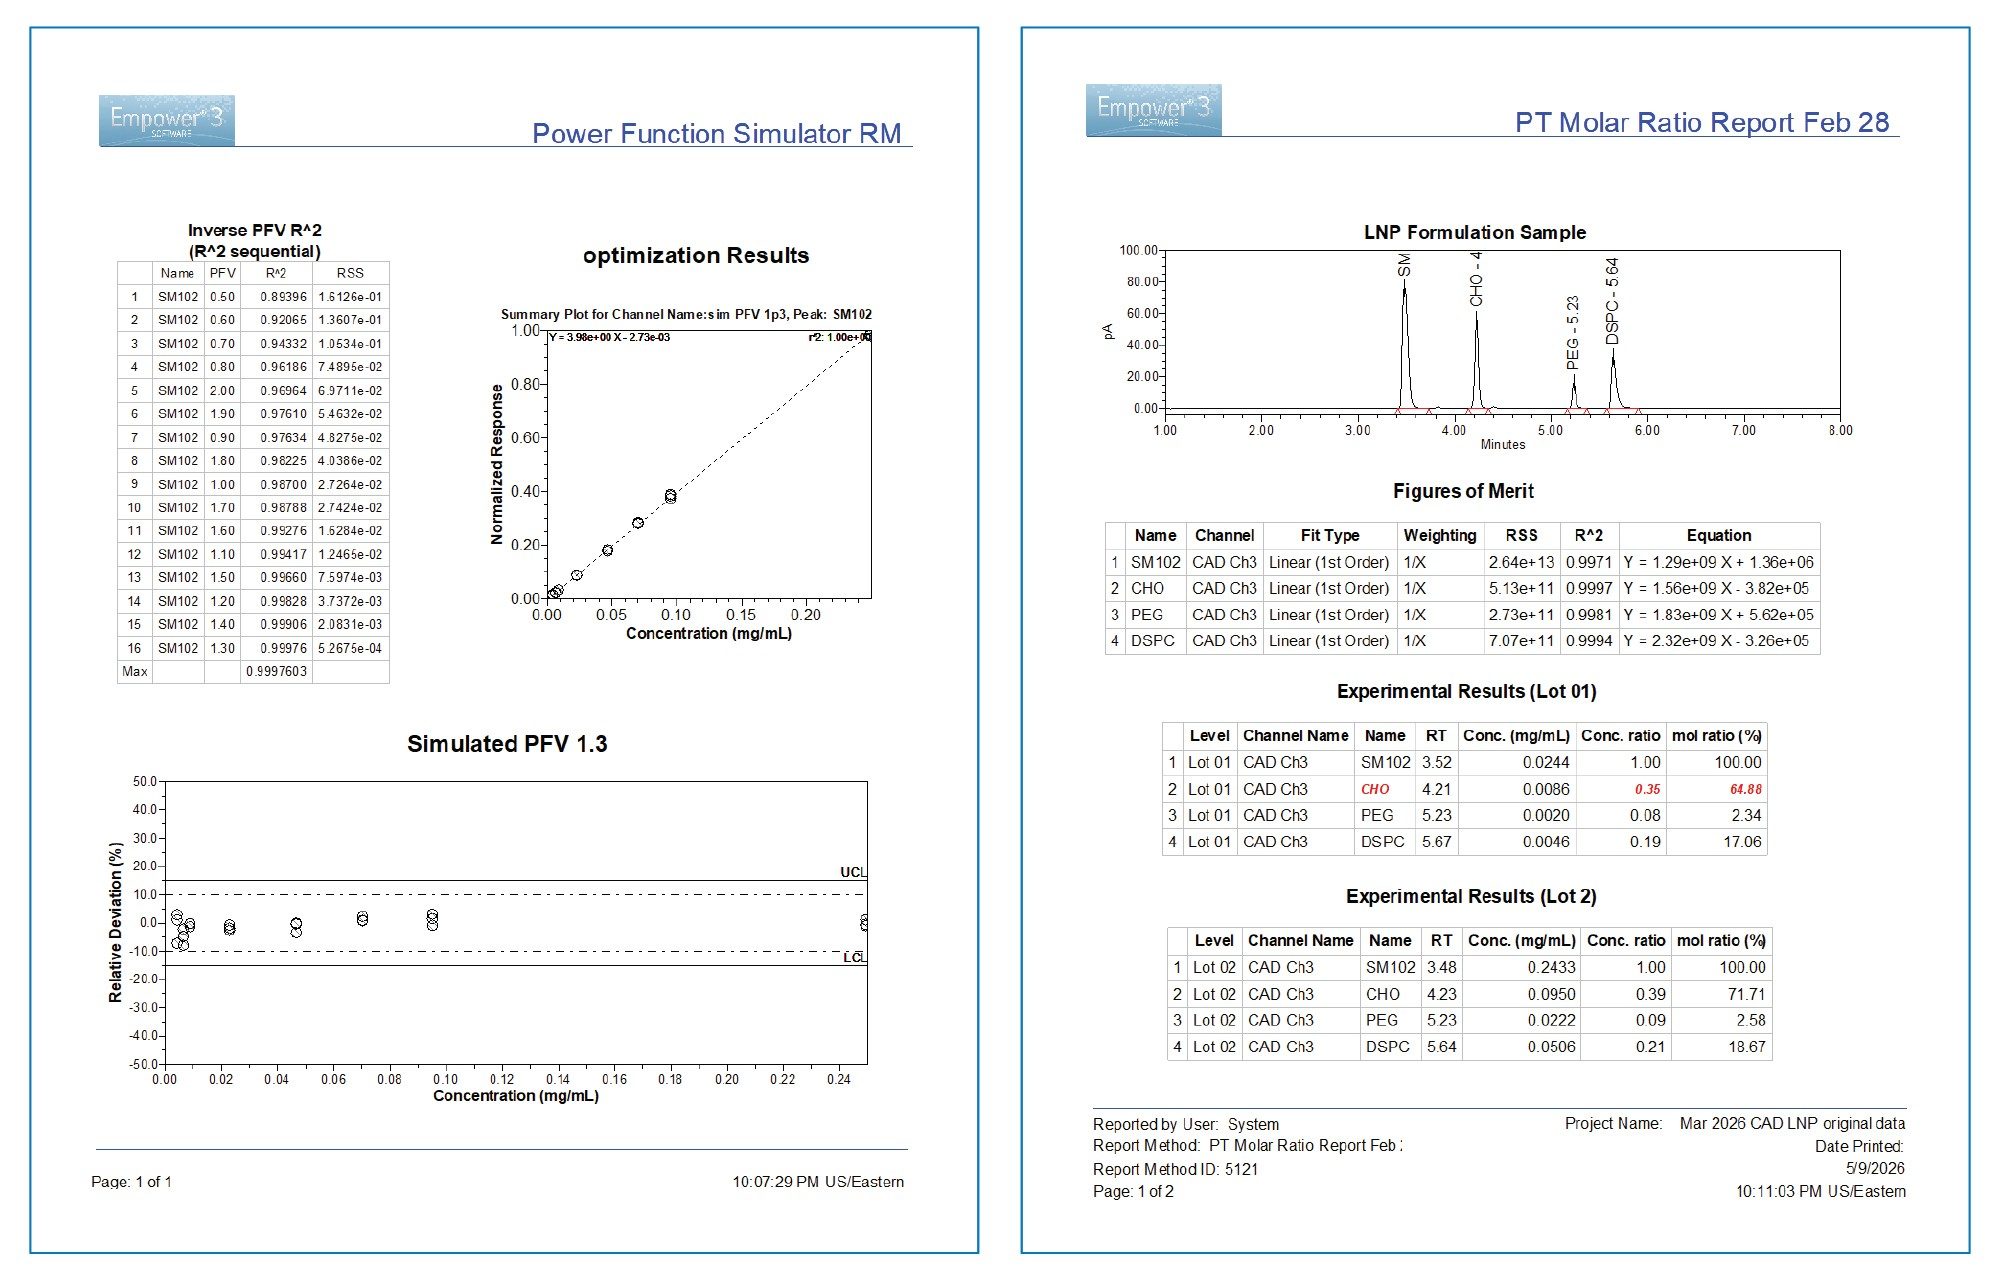
Because this approach relies exclusively on experimentally acquired calibration data, it can be readily implemented within the Empower CDS Software. The workflow supports structured review, traceable documentation, and objective justification of detector settings while maintaining established data integrity expectations (Figure 7). By reducing reliance on repeated experimental recalibration and subjective optimization, this data‑driven strategy can improve efficiency during method development while remaining suitable for use in regulated laboratory environments.
720009440, June 2026