Evaluating Volume Effects in SEC for Large Biomolecules on the Alliance™ iS Bio System With GTxResolve™ SEC 2000 Å Columns
Abraham S. Finny, Balasubrahmanyam Addepalli
Waters Corporation, United States
Published on March 27, 2026
Abstract
Analytical size-exclusion chromatography (SEC) is routinely used to characterize size-based heterogeneity in biotherapeutics, yet nucleic-acid analytes introduce method sensitivities that protein-centric workflows do not fully address. This work evaluates SEC performance on the Alliance iS Bio HPLC System, a platform designed for straightforward implementation with an inert flow path, integrated PDA detection, and native support for wide-bore columns up to 300 mm, using a GTxResolve 2000 Å SEC Column, MaxPeak™ Premier Column (3 µm, 7.8 X 300 mm), across both protein and nucleic-acid sample types under varied mobile-phase and loading conditions. The consistency and repeatability of results across sample types suggest these methods are well-suited for adoption by new users or transfer into QC environments. Triplicate injections of a multi-component protein standard demonstrated strong method repeatability, and thyroglobulin profiles were equivalent in 1X DPBS and 1X DPBS + 1.0 M NaCl, confirming that ionic strength adjustment does not meaningfully perturb large-protein SEC behavior. In contrast, the DNA vector mixture (comprising pBR322 dsDNA and ΦX174 virion ssDNA) responded markedly to both ionic-strength and enzymatic modifications. Elevated NaCl suppressed shoulder features visible in 1X DPBS, while treatment with topoisomerase I (an enzyme that relaxes supercoiled DNA topology) produced a comparable reduction, together indicating that these shoulders reflect plasmid conformation rather than chromatographic artifact. Injection-volume studies yielded linear UV responses for both thyroglobulin and the DNA vector mixture across the full range tested, showing that the wider-bore, longer column format extends the usable analytical window without sacrificing quantitative fidelity. Relative to prior work on a 4.6 X 150 mm format, the 7.8 X 300 mm configuration provides greater separation space, increased injection-volume headroom, and improved resolution of late-eluting species, capabilities that are particularly valuable when characterizing subpopulations of plasmids or other covalently closed DNA molecules.
Benefits
- Strong repeatability under routine DPBS conditions provides a stable baseline even for high-load protein SEC profiling.
- High-resolution separations resolve major protein and DNA populations, while also exposing load- and condition-sensitive shoulder structure in the pBR322 and ΦX174 peak regions.
- Ionic strength and topoisomerase treatment provided orthogonal evidence of plasmid subpopulations with distinct conformational or topological states.
- Increased injection volumes deliver linear UV responses for both thyroglobulin and the DNA vector mixture, extending the usable analytical window without changing the core SEC method.
- Low-adsorption MaxPeak High Performance Surfaces in the Premier Column, together with inert packing materials and the bio-inert Alliance iS Bio HPLC System flow path, reduced nonspecific analyte-surface interactions and hardware-derived artifacts, enabling accurate characterization of analyte subpopulations.
Introduction
SEC is a primary analytical tool for monitoring size-based distributions in biomolecules, including aggregates, high-molecular-weight species, and fragments. As nucleic-acid modalities expand, analytical teams are increasingly asked to generate consistent, interpretable SEC readouts across various modalities, including both proteins and plasmids, using a single instrument platform and an operationally simple method set. A practical challenge is that these analyte classes do not necessarily respond to method conditions in the same way. Conditions acceptable for protein SEC may not preserve informative plasmid peak shape, instead oversimplifying plasmid chromatograms and obscuring real profile detail. DPBS (Dulbecco’s Phosphate-Buffered Saline) is widely used in bioanalytical laboratories as a convenient, formulation-relevant buffer system.1 However, its ionic strength may need to be adjusted to meet the analyte requirements or to eliminate non-specific interactions on a stainless-steel column. An important practical question is therefore whether ionic-strength adjustment affects proteins and plasmids similarly, or whether plasmid SEC requires a different interpretive framework under otherwise comparable conditions.
Previous Waters work demonstrated high-resolution SEC of megadalton-sized DNA vectors and plasmids using a GTxResolve 2000 Å SEC Column in a 4.6 X 150 mm format. That work also showed that the uracil peak was not fully separated from nearby low-molecular-weight signals, highlighting a practical limitation when late-eluting features must be interpreted with confidence. The present study extends that foundation by moving to a 7.8 X 300 mm format on the Alliance iS Bio System platform to determine whether additional separation space and greater injection-volume headroom broaden the usable analytical window. The Alliance iS Bio System platform was also well-suited to this study because its integrated PDA detection, inert sample flow path with MaxPeak HPS technology, and native support for a single column up to 300 mm in length and 8 mm i.d. allowed the 7.8 X 300 mm SEC format to be implemented directly, without the need for an added secondary column heater or external column-management configuration.
This application note evaluates both protein and nucleic acid samples using a single SEC column format. The work focuses on three practical issues: whether protein and plasmid SEC respond similarly to ionic-strength adjustment, whether treatment with topoisomerase I, a type IB enzyme that relaxes supercoiled DNA by transiently nicking and resealing a single strand, can clarify the origin of plasmid peak shoulders, and whether increased injection volume can be used as a reliable sensitivity lever while preserving linear UV response.2,3
Experimental
Sample Preparation
Four sample types were used to evaluate SEC performance across proteins and nucleic acids and to probe how ionic strength and enzymatic relaxation influence plasmid shoulder structure:
- Thyroglobulin (Sigma-Aldrich, 609310-100MG) was prepared at 2 mg/mL in 1X DPBS (without Ca/Mg).
- BEH450 SEC Protein Standard Mix (Waters, p/n: 186006842) was reconstituted with 1000 µL 1X DPBS (without Ca/Mg) and injected as reconstituted.
- Waters DNA Vector Mixture Standard (Waters, p/n:186011285) was used as the nucleic-acid test system. The vial contains 25 µg pBR322 dsDNA, 25 µg ΦX174 virion ssDNA, and 2 µg uracil (void marker). The standard was reconstituted to 100 µL with nuclease-free water.
- Topoisomerase-treated DNA Vector Mixture was prepared from the same Waters DNA Vector Mixture Standard by reconstituting the vial to 100 µL with 80 µL nuclease-free water, 10 µL rCutSmart™ Buffer (10X, NEB B6004), and 10 µL Topoisomerase I (E. coli, NEB M0301L). The reaction was incubated at 37 °C for 15 minutes, as recommended by the manufacturer, then heat-inactivated at 65 °C for 20 minutes and injected as-is. A longer 60 minutes incubation at 37 °C was also evaluated in-house, but did not yield a meaningful additional reduction in shoulder area.
Unless otherwise noted, injections were 50 µL. At this injection volume, thyroglobulin corresponds to 100 µg at 2 mg/mL, while the DNA mixture corresponds to 12.5 µg pBR322, 12.5 µg ΦX174, and 1.0 µg uracil.
Increased injection-volume studies were performed to evaluate linearity and higher-load behavior for thyroglobulin at 25, 50, 75, and 100 µL and for the Waters DNA Vector Mixture Standard at 12.5, 25, 50, 75, and 100 µL.
Ionic-strength comparisons were performed using 1X DPBS and 1X DPBS + 1.0 M NaCl for the thyroglobulin comparison and for the stacked DNA chromatograms. Protein repeatability was evaluated using triplicate injections of the BEH450 mix in 1X DPBS.
UV detection was acquired at 280 nm for proteins and 260 nm for DNA. Data was acquired and processed using Empower™ 3.10.x (tested with 3.10.0). Peak integration and shoulder-area measurements were performed using consistent integration settings within each experiment to support direct comparison of chromatograms.
|
LC system: |
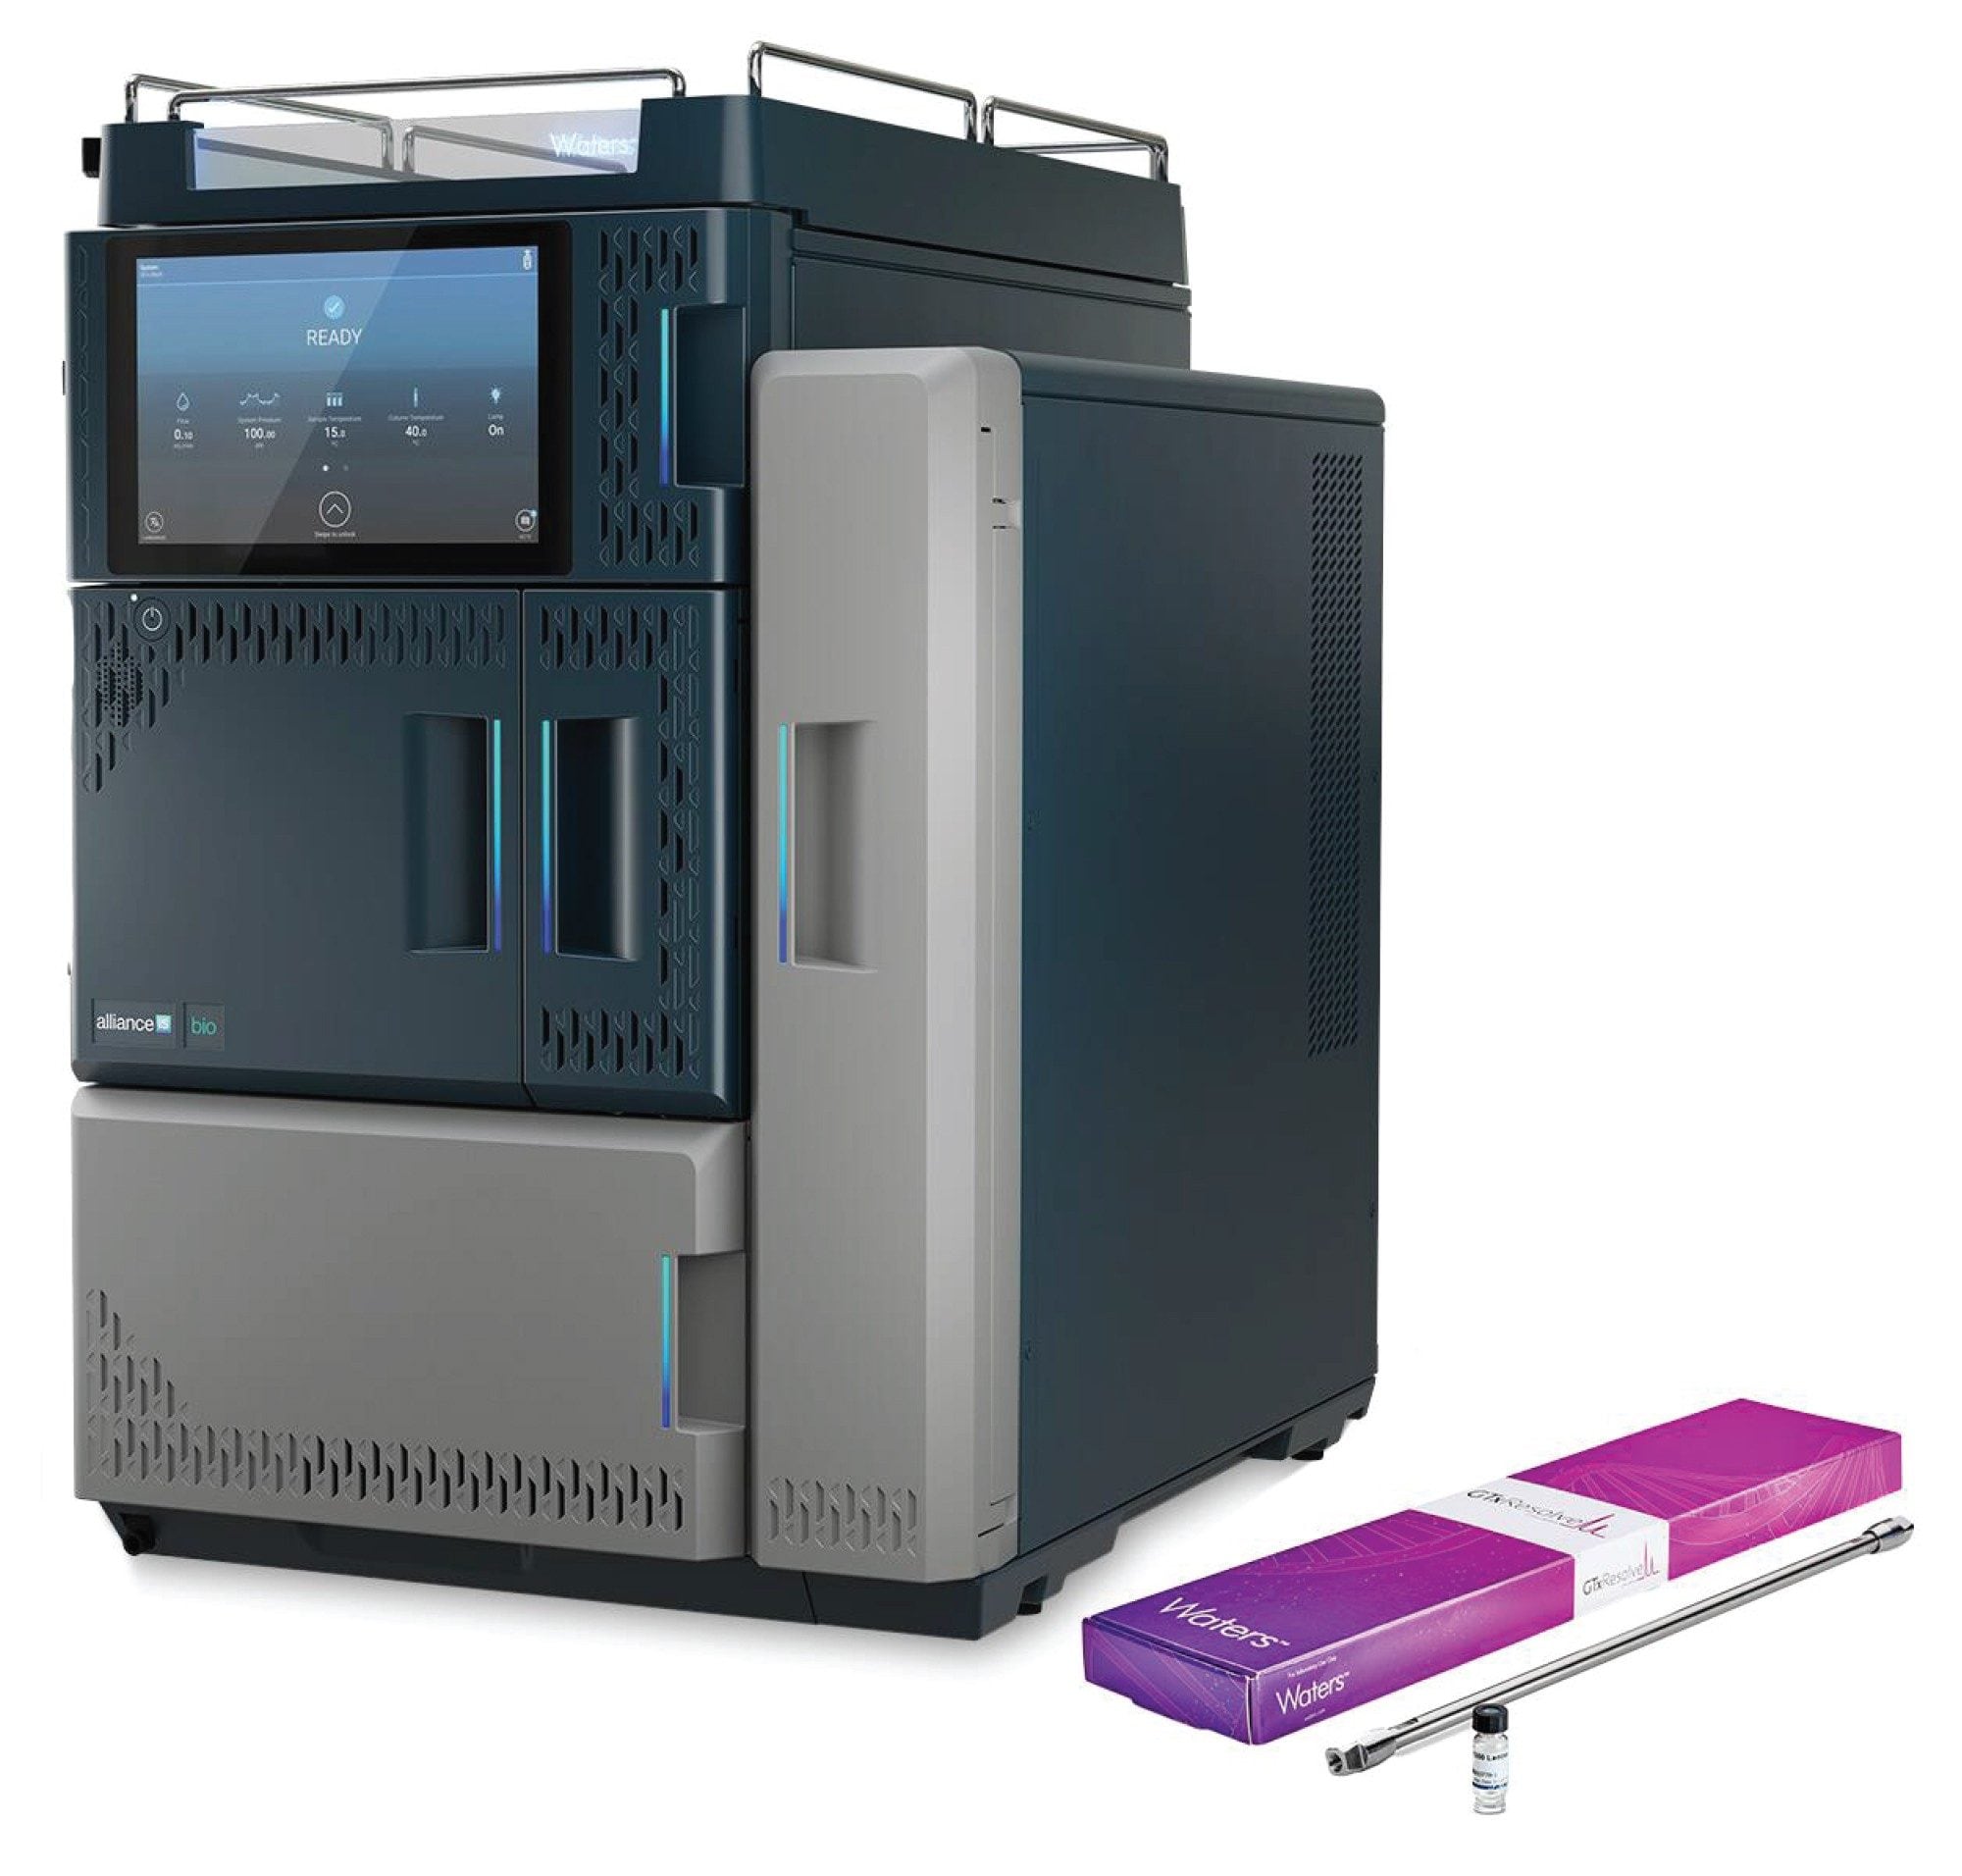
Alliance iS Bio HPLC System with PDA Detector (p/n: 176030001) |
|
Detector: |
Alliance iS HPLC Photodiode Array Detector |
|
Flow cell: |
Analytical 8.4 µL volume, 10 mm path length (p/n: 205001023) |
|
Wavelength: |
UV detection (DNA at 260 nm, proteins at 280 nm) |
|
Sampling (data) rate: |
20 Hz |
|
Digital resolution: |
1 nm |
|
Column(s): |
GTxResolve 2000 Å SEC Column, MaxPeak Premier Column, 3 µm, 7.8 mm X 300 mm and DNA Vector Mixture Standard (p/n: 176006050) |
|
Mobile phase A: |
1X DPBS (without Ca/Mg) |
|
Mobile phase B: |
1X DPBS (without Ca/Mg) with NaCl spiked to 1.0 M final concentration |
|
Seal wash: |
10% HPLC-grade Methanol / 90% 18.2 MΩ*cm resistivity (Milli-Q®) water (v/v) |
|
Column temperature: |
35 °C |
|
Sample temperature: |
2–8 °C |
|
Flow rate: |
0.60 mL/min |
|
Run time: |
31 minutes per injection |
|
Injection volume: |
Standard injections: 50 µL (DPBS vs DPBS + 1.0 M NaCl comparisons; BEH450 triplicates; topo comparison) DNA injection-volume study: 12.5, 25, 50, 75, 100 µL Thyroglobulin injection-volume study: 25, 50, 75, 100 µL |
|
Samples: |
Thyroglobulin: 2 mg/mL in 1X DPBS BEH450 SEC Test Mix: reconstituted with 1000 µL 1X DPBS; injected as reconstituted Waters DNA Vector Mixture: 25 µg pBR322 dsDNA, 25 µg ΦX174 virion ssDNA, 2 µg uracil (p/n: 186011285); reconstituted to 100 µL total Topo-treated DNA: 80 µL nuclease-free water + 10 µL rCutSmart buffer + 10 µL NEB topoisomerase I; at 37 °C for 15 minutes then at 65 °C for 20 minutes; injected as-is; chromatogram acquired in 1X DPBS |
|
Vials: |
TruView™ pH Control LCMS Certified Clear Glass Vials, 12 X 32 mm, Screw Neck (p/n: 186005663CV) |
|
Mode: |
Isocratic SEC |
|
System control and data acquisition: |
Empower 3.10.x (tested with 3.10.0) Alliance iS HPLC System Software version 2.0 |
Results and Discussion
Protein Studies
Repeatability of the SEC Method on a Multi-Component Protein Mixture
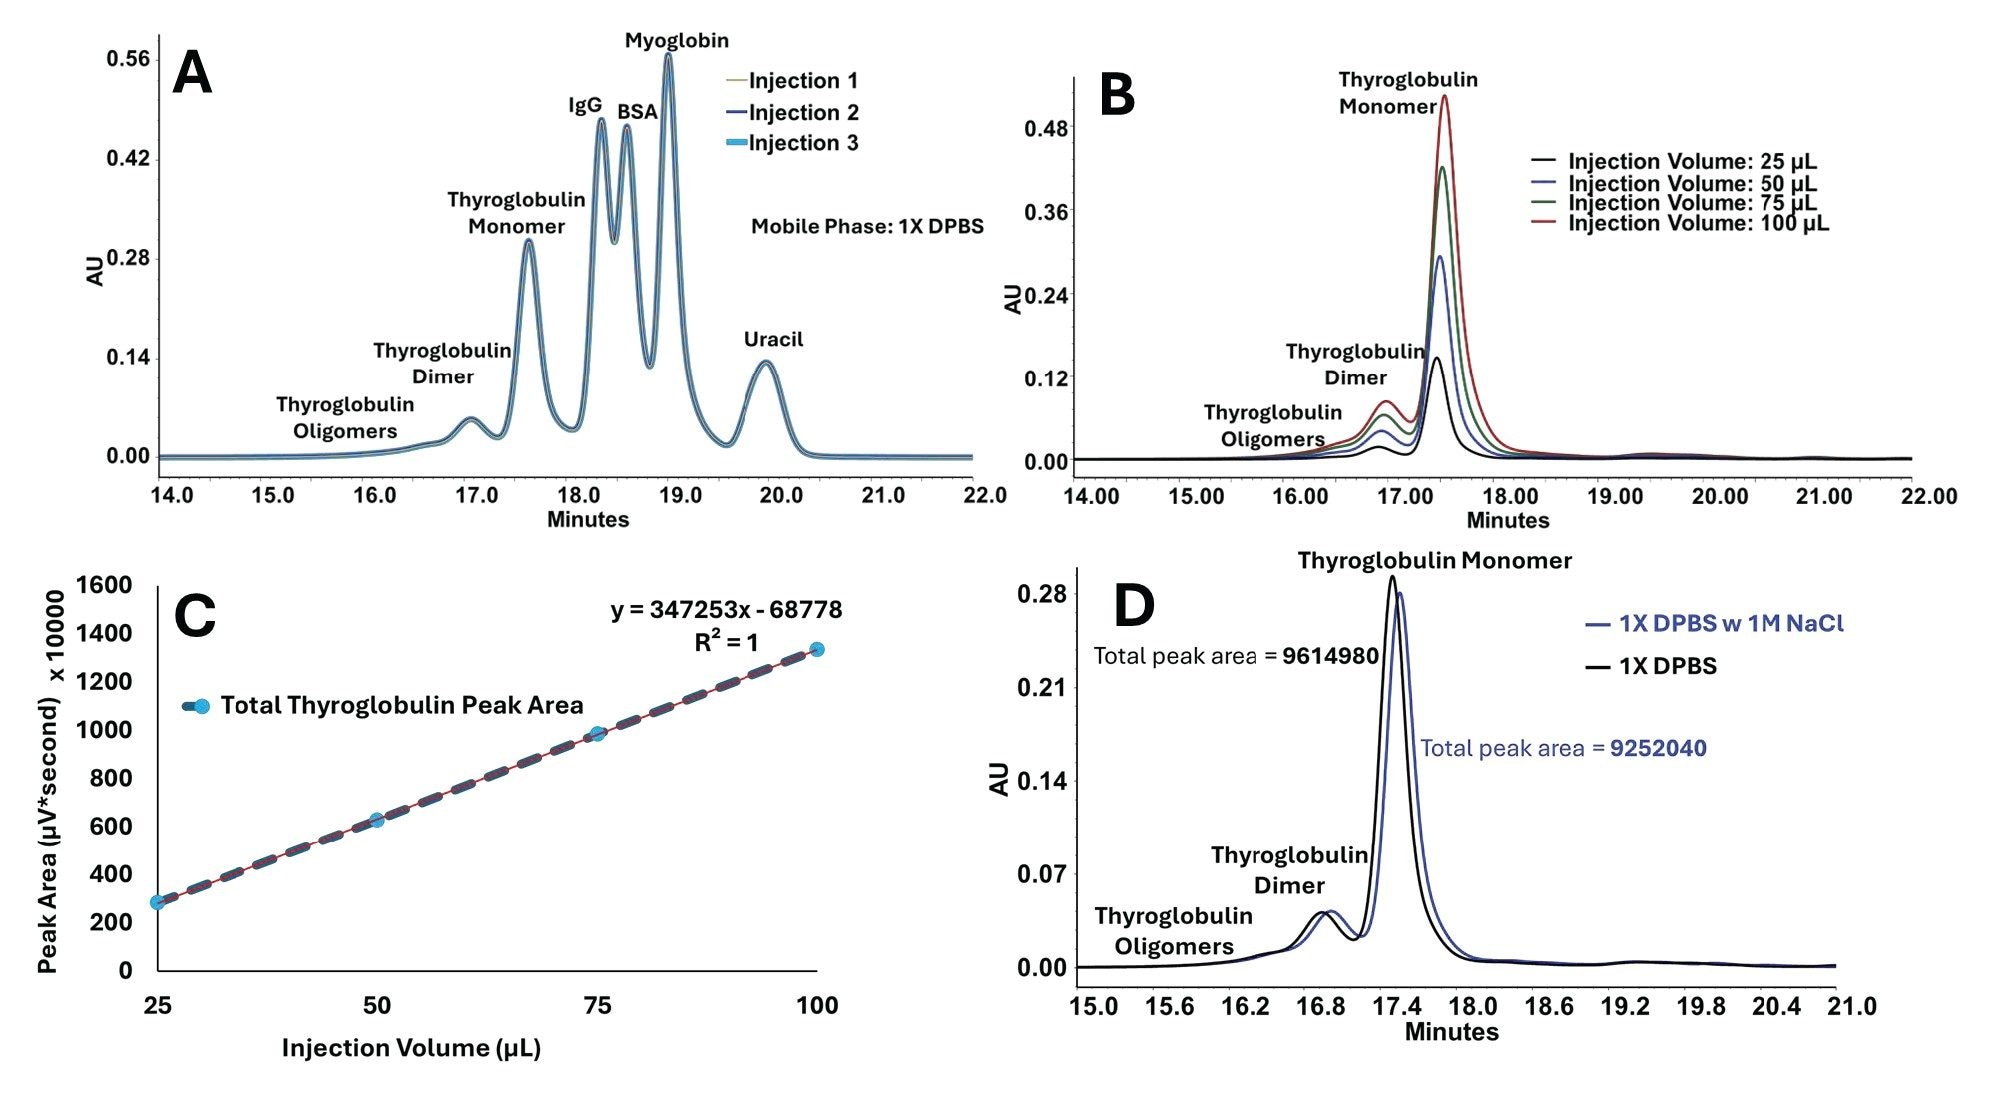
Triplicate injections of the BEH450 SEC Protein Standard Mix in 1X DPBS produced chromatograms that were closely overlaid across the protein and uracil regions. The close overlay across thyroglobulin, IgG, BSA, myoglobin, and uracil establishes repeatable retention and peak shape across a broad molecular-weight range within a single DPBS-based run (Figure 2A). This result provides a stable protein baseline and shows that the system and column configuration support routine SEC profiling under common bio-buffer conditions.
Injection Volume Linearity for Thyroglobulin
The thyroglobulin injection volume study was used to determine whether increased injection volume could be used as a practical sensitivity lever without compromising chromatographic interpretability. Across the tested range of 25 to 100 µL, the oligomer, dimer, and monomer regions remained well defined (Figure 2B), while total peak area increased linearly with injection volume (Figure 2C). At 2 mg/mL, this corresponds to 50 to 200 µg injected thyroglobulin.
The linearity study also highlights the Alliance iS Bio autosampler’s standard injection volume capability. Injections from 25 to 100 µL were accommodated within the system’s standard configuration, allowing increased analytical sensitivity without requiring additional higher-volume loop hardware or more complex plumbing. Together, these results show that the protein SEC workflow was quantitatively scalable with increased injection volume while preserving a stable and interpretable chromatographic profile.
Ionic-Strength Comparison for Thyroglobulin
With protein repeatability and injection-volume linearity established, thyroglobulin was then used to determine whether ionic-strength adjustment altered the SEC profile of a large protein standard under the conditions tested. Thyroglobulin chromatograms acquired in 1X DPBS and in 1X DPBS + 1.0 M NaCl were highly similar in peak shape, elution pattern, and aggregate-to-monomer distribution, with total integrated peak area differing by less than 4% between the two conditions (Figure 2D). Under the conditions tested here, ionic-strength adjustment did not materially alter the protein SEC readout.
Plasmid Vector Studies
Rationale for the 7.8 × 300 mm SEC Format
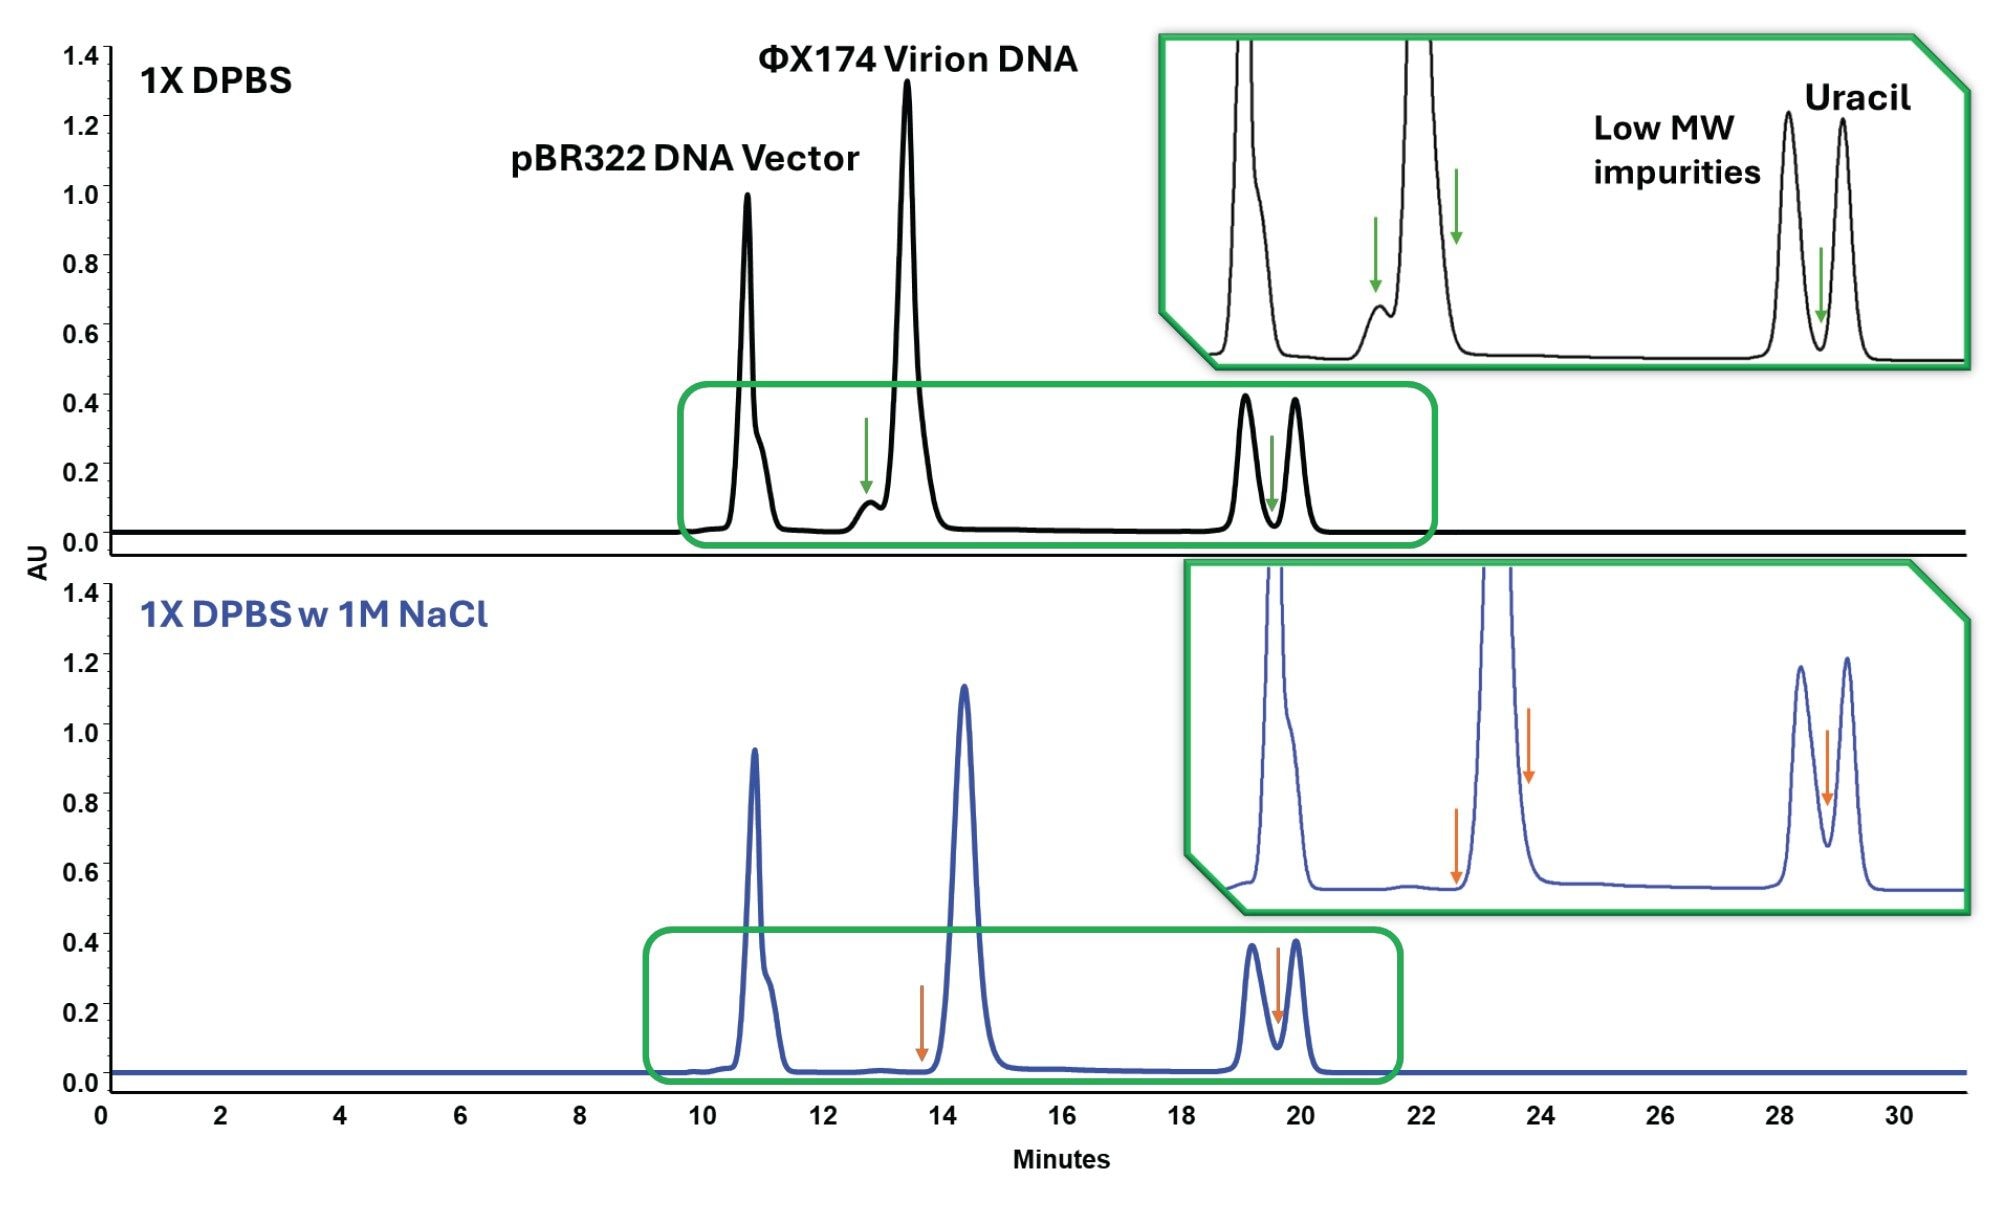
Previous Waters work established high-resolution SEC of megadalton-sized DNA vectors and plasmids using GTxResolve 2000 Å SEC Columns in a 4.6 X 150 mm format.4 That work also showed that the uracil peak was not fully separated from closely eluting low-molecular-weight signals, limiting interpretability at the end of the chromatogram. In the present study, a 7.8 X 300 mm format was selected to broaden the usable analytical window. The longer bed provides greater separation space, while the larger column volume provides more injection-volume headroom and higher resolution due to diminished impact of system dispersion.5 Under these conditions, higher-load (50 µL) injections revealed peaks with a shoulder structure on both the pBR322 and ΦX174 regions, creating a useful framework for evaluating whether those features reflect fixed-size-based species or method-sensitive plasmid structure (Figure 3).
Ionic Strength Reveals that the Plasmid Peak Structure is Method-Dependent
Unlike the protein samples, the DNA vector mixture responded strongly to ionic-strength adjustment. In 1X DPBS, the chromatogram shows shoulders adjacent to the primary DNA peaks together with additional low-level signal in the later-eluting region. When the mobile phase is changed to 1X DPBS + 1.0 M NaCl, those shoulders are suppressed, artificially making the chromatograms easier to interpret (Figure 3). This behavior is best interpreted as a selectivity change rather than simply improved peak shape. In practical terms, the result shows that plasmid peak structure depends strongly on method conditions, and that higher-salt conditions can collapse profile detail that remains visible under 1X DPBS. This distinction matters analytically. If the method is configured only to produce the simplest or the best-looking chromatograms, structurally informative plasmid features may be lost. For plasmid analysis, method selection therefore influences not only robustness and ease of integration, but also the structural details that remain visible in the chromatogram.
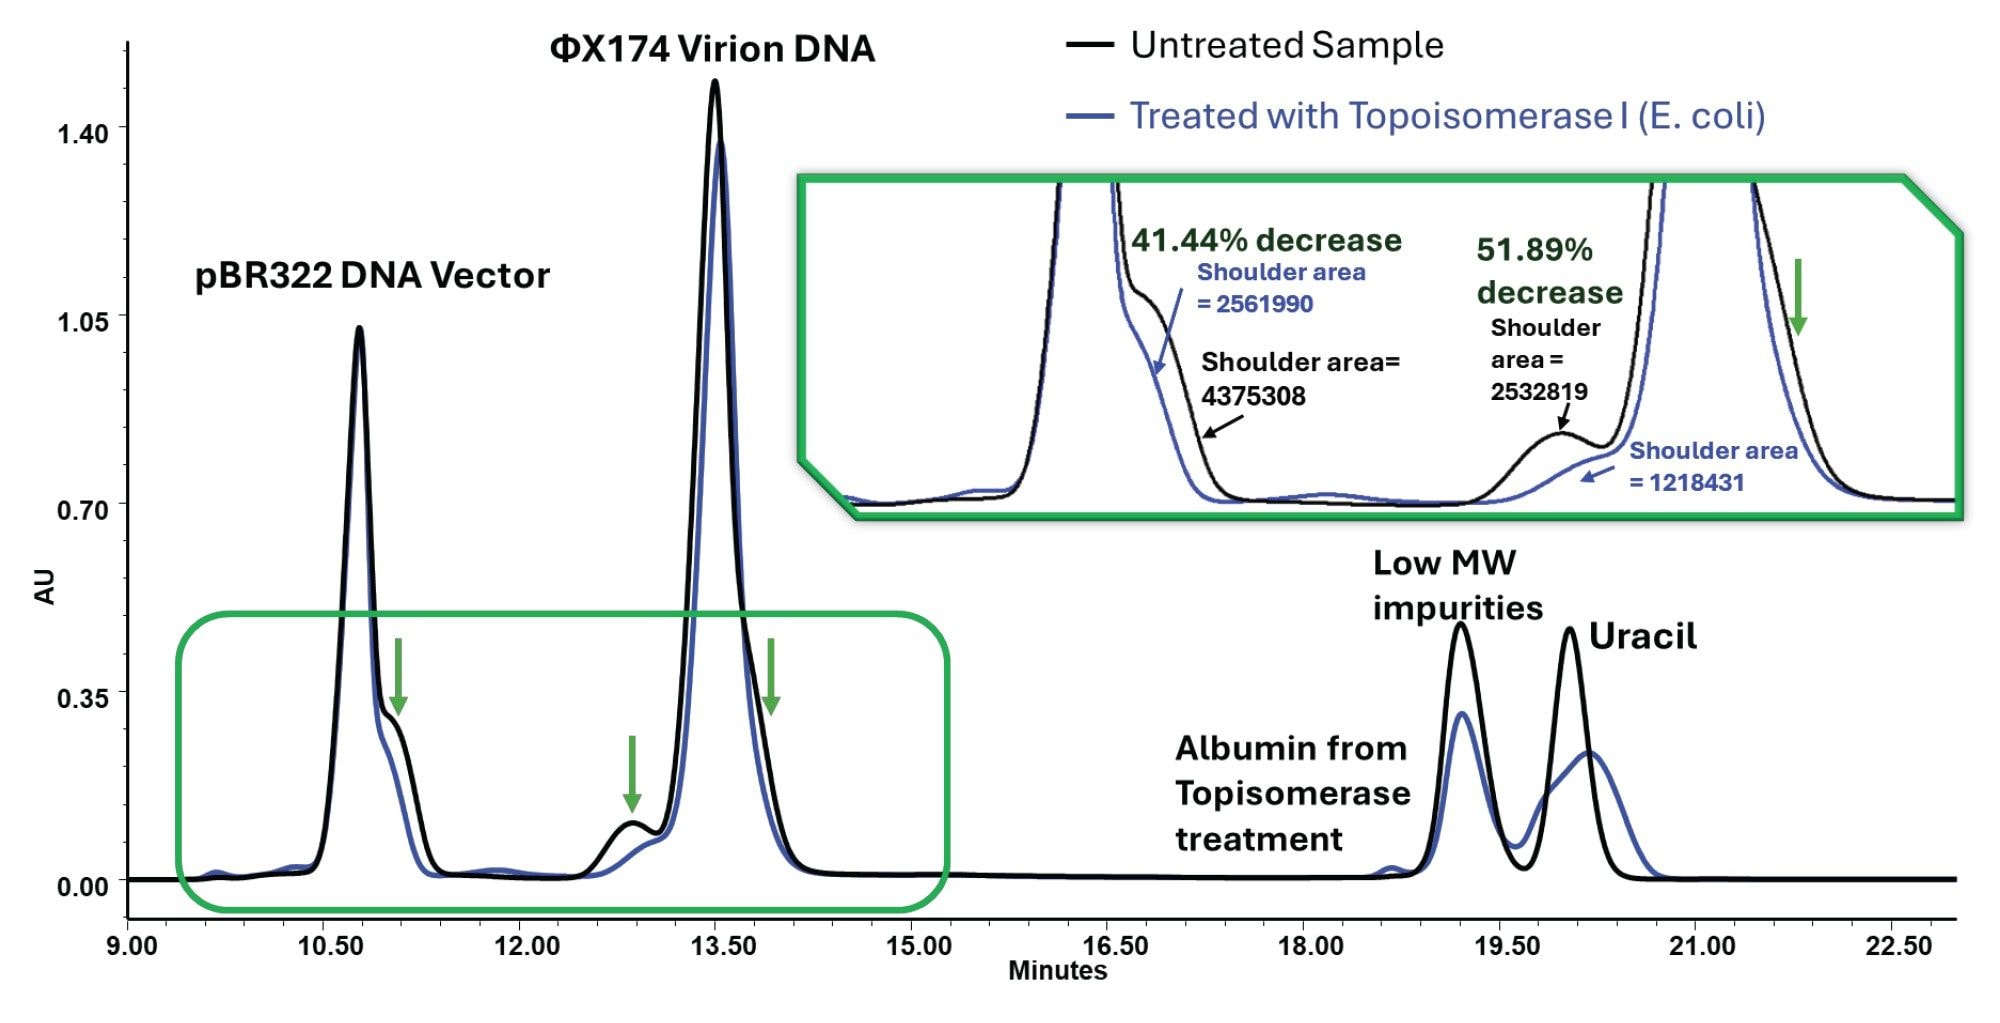
Topoisomerase Treatment as an Orthogonal Check on DNA Vector Peak Shoulder Assignment
Topoisomerase I is a type IB enzyme that relaxes supercoiled DNA by transiently nicking one strand, allowing rotational unwinding, and then resealing the break. Topoisomerase I treatment of the DNA vector mixture, performed and analyzed in 1X DPBS, produces the same directional effect seen in the high-salt comparison: the shoulder regions decrease substantially. The integrated shoulder areas decreased by approximately 41.44% and 51.89% in the highlighted regions (Figure 4). Because the same shoulders are reduced by enzymatic relaxation in DPBS, they are not adequately explained by salt-dependent chromatographic effects alone.
Instead, the data support the interpretation that these features are at least partly associated with plasmid conformation and topology. The salt experiment shows that these features are method-sensitive. The topoisomerase experiment shows that they are also sample-structure-related and can be enzymatically altered. Together, these observations indicate that plasmid SEC requires different interpretive considerations than protein SEC under the conditions tested here. A distinct, later-eluting signal from treatment-related protein components is also observed, demonstrating that SEC can simultaneously detect plasmid peak changes and reagent-derived signals in the same run.
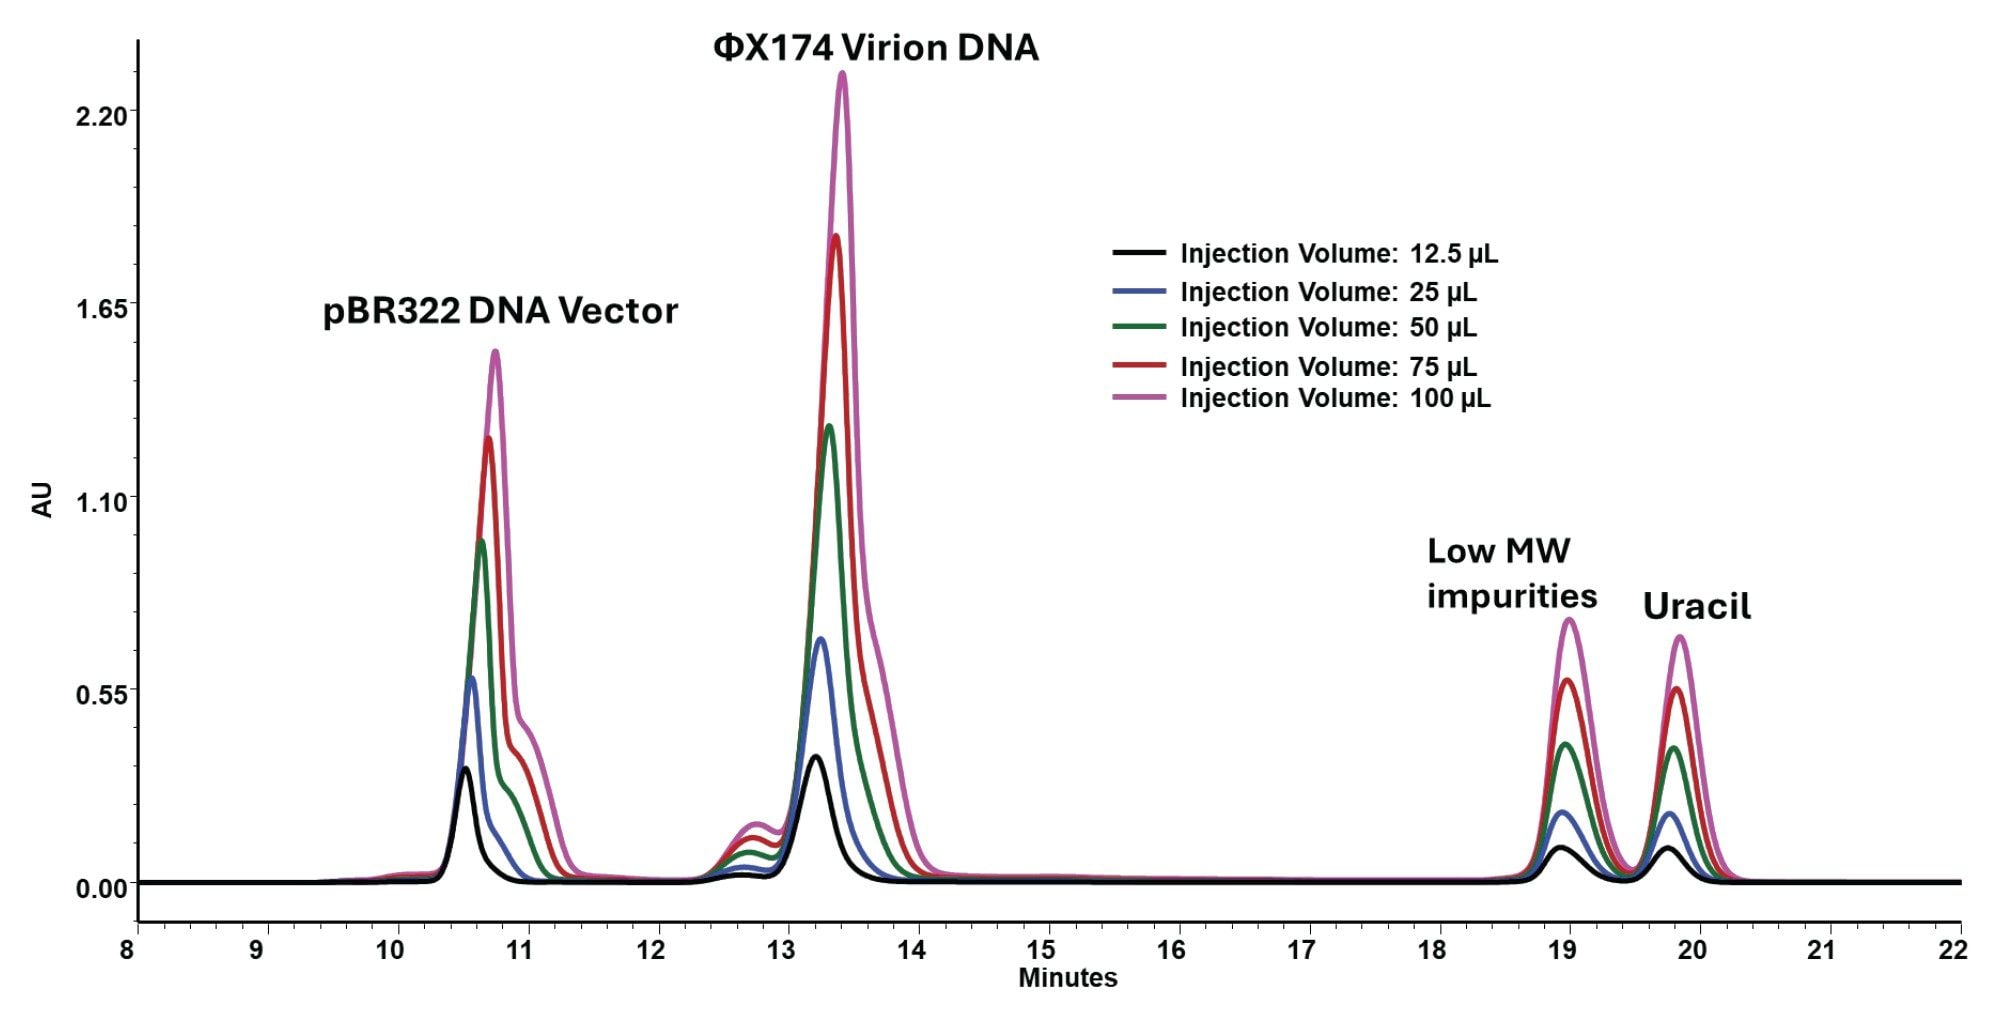
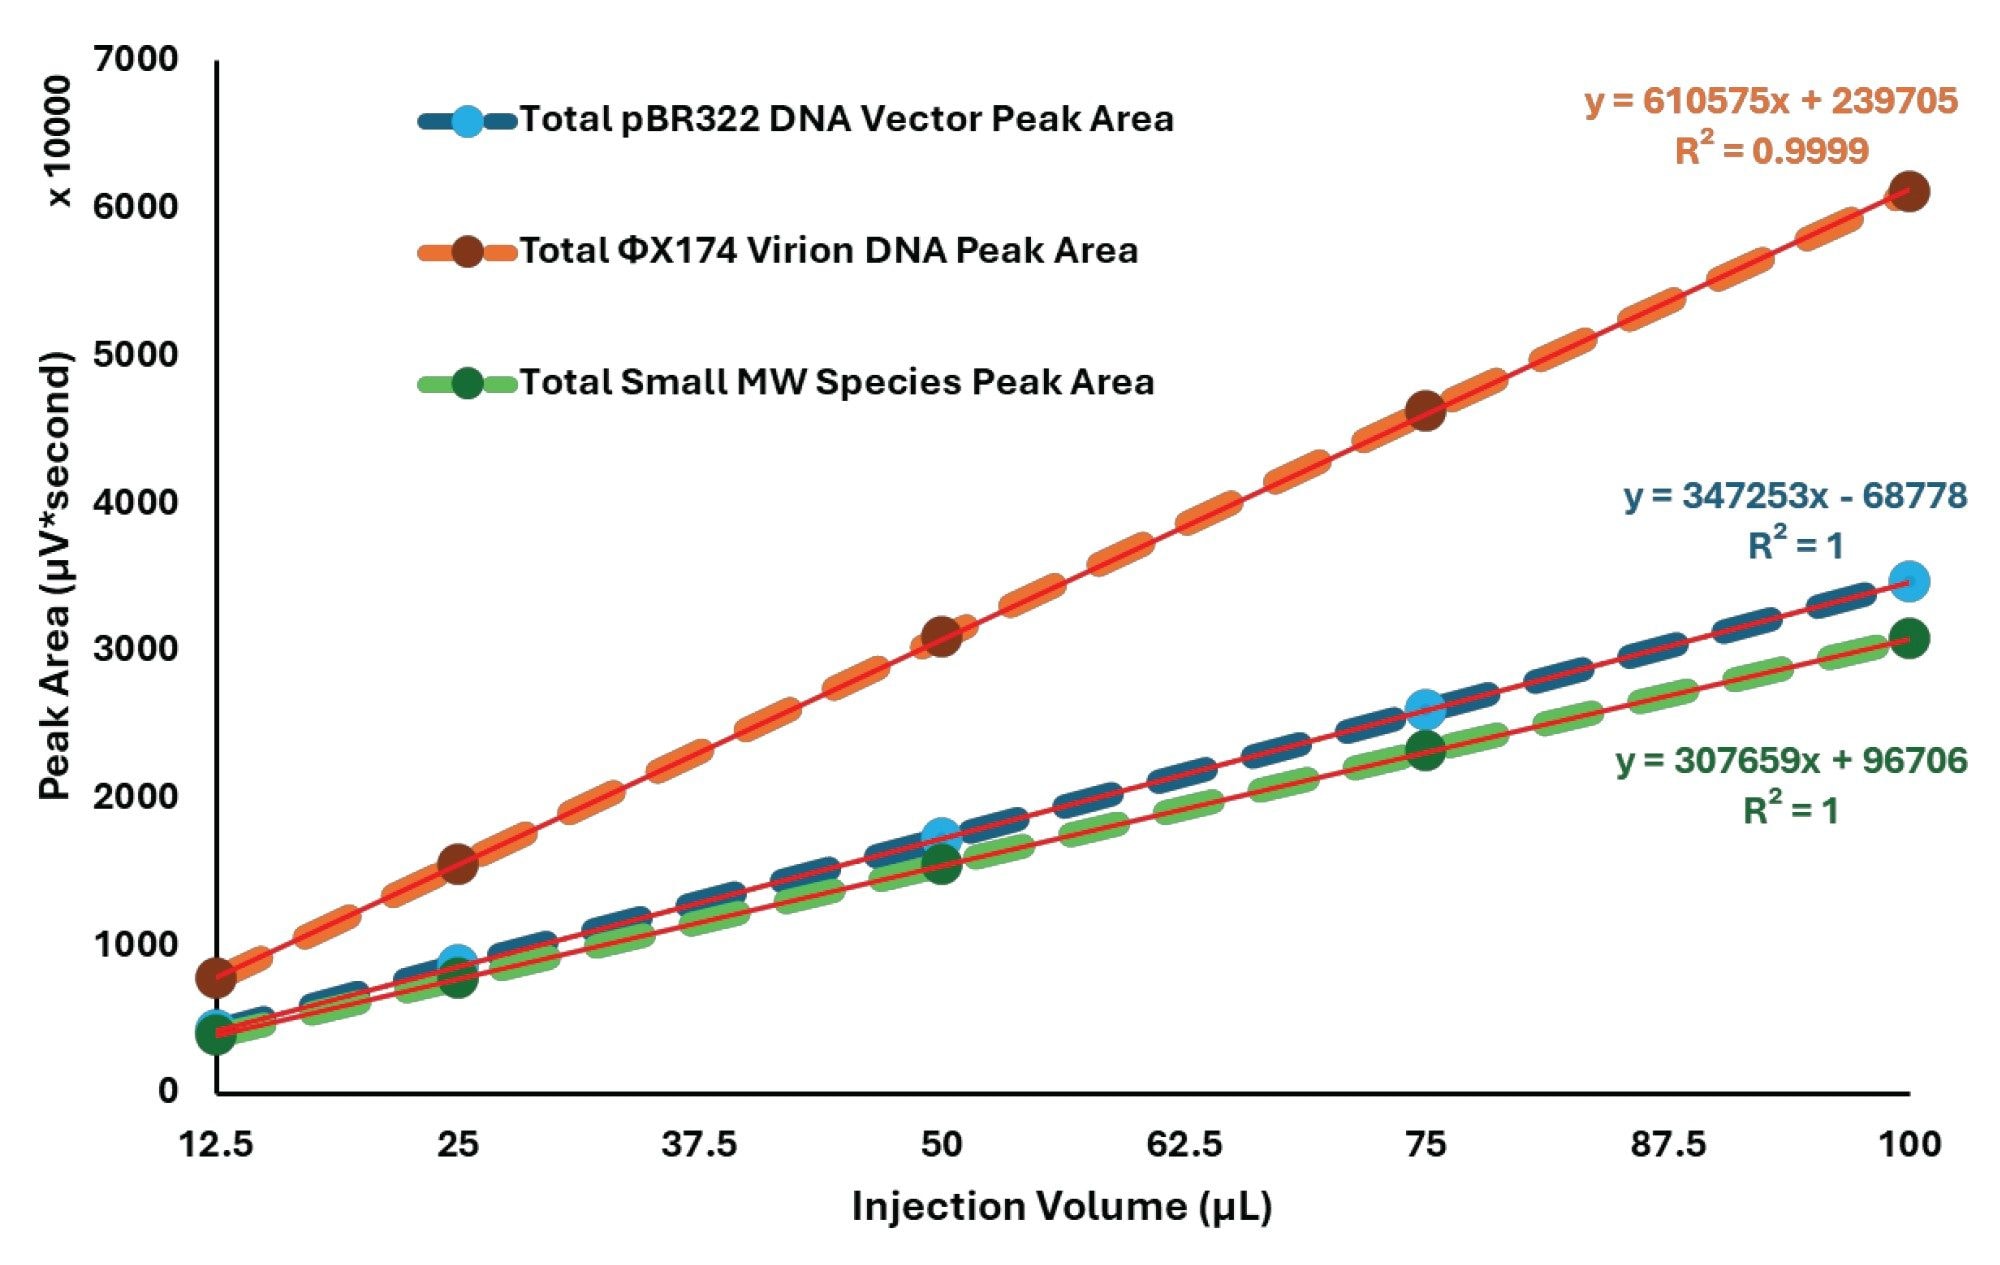
Increased Injection Volumes Preserve a Linear Response for the DNA Mixture
The DNA injection volume study was used to determine whether the 7.8 X 300 mm SEC format could support increased injection volumes without compromising interpretability or quantitative response. Across the range of 12.5 to 100 µL, the chromatograms show proportional increases in signal for both the main DNA region and the later-eluting low-molecular-weight region (Figure 5), and the regression plots show linear UV response across the tested range (Figure 6). Across this range, the injected DNA mass increased from 3.125 to 25 µg per DNA component.
This result expands the practical use of the method. The wider, longer format does not simply reproduce earlier plasmid separations. It also supports increased injection volume as a usable sensitivity lever while preserving the ability to observe load-sensitive plasmid structure.
Conclusion
High-resolution SEC of proteins and nucleic acids was demonstrated on the Alliance iS Bio System using a GTxResolve 2000 Å SEC Column, MaxPeak Premier Column (3 µm, 7.8 × 300 mm). In addition to the analytical advantages of the 7.8 X 300 mm format, the Alliance iS Bio System platform supported direct implementation of that column geometry within its standard configuration, enabling a single integrated SEC workflow without additional column-management hardware. The protein data established a stable baseline for the method: thyroglobulin profiles were unchanged between 1X DPBS and 1X DPBS + 1.0 M NaCl, BEH450 protein mixtures showed repeatable overlays in DPBS, and increased injection volumes preserved linear response for thyroglobulin.
In contrast, the plasmid data showed that nucleic-acid SEC required different method considerations under the same platform conditions. Relative to the previously reported 4.6 X 150 mm format, the 7.8 X 300 mm configuration broadened the usable analytical window by providing greater separation space and increased injection-volume headroom. Under these conditions, higher-load injections showed analyte-peak-related shoulder structure in both the pBR322 and ΦX174 regions. Increasing ionic strength suppressed those shoulders, while topoisomerase treatment in 1X DPBS reduced the same features, indicating that they are not adequately explained by salt-dependent chromatographic effects alone and instead are consistent with contributions from plasmid supercoil-related conformation and topology. Together, these results show that inappropriate SEC conditions can mask profile features that remain visible under more discriminating conditions; therefore, analyte-specific method considerations are paramount.
References
- Arakawa, T.; Ejima, D.; Li, T.; Philo, J. S. The critical role of mobile phase composition in size exclusion chromatography of protein pharmaceuticals. J. Pharm. Sci. 2010, 99 (4), 1674–1692. doi: 10.1002/jps.21974.
- Wang, J. C. Cellular roles of DNA topoisomerases: a molecular perspective. Nat. Rev. Mol. Cell Biol. 2002, 3(6), 430–440.
- Champoux, J. J. DNA topoisomerases: structure, function, and mechanism. Annu. Rev. Biochem. 2001, 70, 369–413.
- Finny, A.S.; Reidy, C.; Addepalli, B.; Lauber, M.A. High-Resolution Size Exclusion Chromatography of Megadalton-Sized DNA Vectors and Plasmids Using Waters GTxResolve 2000 Å SEC Columns. Waters Application Note, 720008847, June 6, 2025.
- Koza, S.M.; Reed, C.E.; Chen, W. Evaluating the Impact of LC System Dispersion on the Size-Exclusion Chromatography Analysis of Proteins. Waters Application Note, 720006337, June 2019.
720009287, March 2026