Benchmarking Resolution and Recovery of BioResolve™ 1 mm ID C18 RP Columns with MaxPeak™ Premier Technology
Caitlin M. Hanna, Stephan M. Koza, Balasubrahmanyam Addepalli
Waters Corporation, United States
Published on March 11, 2026
Abstract
The BioResolve Peptide C18 RP 1.0 mm ID Column with MaxPeak Premier Technology was benchmarked against 3 commercially available microflow columns of similar dimensions. Using a MassPREP™ Enolase Digest with Phosphopeptides Mix, the BioResolve Peptide C18 RP Column demonstrates superior peak capacity, improved peak shape, and significantly higher recovery of acidic and phosphorylated peptides from the first injection. As a result, the BioResolve Peptide C18 RP Column delivers reproducible separations and exceptional mass spectral data quality, improving confidence in peptide identification. These results highlight the advantages of MaxPeak Premier Technology in microflow proteomics workflows and underscore the BioResolve Peptide C18 RP Column’s ability to deliver sensitive, reproducible separations without extensive column conditioning.
Benefits
- Exceptional recovery and peak shape of acidic and phosphorylated peptides from the first injection, eliminating the need for extensive column conditioning.
- Higher peak capacity compared to other commercially available 1.0 mm ID columns, enhancing separation performance.
- Enhanced mass spectrometry (MS) sensitivity and cleaner spectra, improving confidence in peptide identification.
Introduction
Microflow chromatography offers several advantages over traditional analytical scale chromatography in proteomics applications. Microbore columns require less sample load and enable the use of low flow rates (10–100 µL/min). These low flow rates decrease solvent consumption and optimize the interface with MS, increasing MS sensitivity.1,2 However, recovery of acidic peptides in microflow proteomics workflows can be challenging due to non-specific adsorption to stainless steel column hardware.
Waters 1.0 mm ID MaxPeak Premier Columns use MaxPeak High Performance Surfaces (HPS) Technology to mitigate unwanted interactions between acidic analytes and column hardware.3,4 BioResolve Peptide 1.0 mm ID Columns with MaxPeak Premier Technology demonstrate excellent recovery and peak shape for acidic peptides from the first injection, eliminating the need for extensive column conditioning.4 Here, BioResolve Peptide C18 RP 1.0 mm ID Columns are benchmarked against 3 commercially available 1.0 and 1.5 mm ID columns. The BioResolve Peptide Column outperforms the alternative columns in peak shape and recovery of highly acidic peptides, resulting in a cleaner baseline and improved signal-to-noise from the first injection.
Experimental
Sample Description
Waters MassPREP Enolase Digest with Phosphopeptides Mix (p/n: 186003286) was reconstituted in 100 µL of 0.1% formic acid in water.
Peptide Sequences
|
Peptide |
Sequence |
|
T35 |
WLTGPQLADLYHSLMK |
|
T37 |
YPIVSIEDPFAEDDWEAWSHFFK |
|
T51 |
IEEELGDNAVFAGENFHHGDK |
|
T51–52 |
IEEELGDNAVFAGENFHHGDKL |
|
T18p |
NVPLpYK |
|
T19p |
HLADpSK |
|
T43p |
VNQIGpTLSESIK |
|
T43pp |
VNQIGpTLSEpSIK |
Calculations
4σ peak capacities were determined based on the following equation:
LC Conditions
|
LC system and setup: |
ACQUITY™ Premier UPLC™ Standard tubing prior to column, flow diverted straight from the column to the MS source with 40 µm ID x 30 in tubing (p/n: 700011516). |
|
Columns: |
BioResolve Peptide C18 RP Column, MaxPeak Premier Technology, 1.7 µm, 130 Å, BEH, 1.0 x 100 mm (p/n: 186011505) “Column K”: core-shell C18 1.7 µm, 100 Å, 1.0 x 100 mm “Column Y”: C18 1.9 µm, 120 Å, 1.0 x 100 mm “Column H”: core-shell C18 2.7 µm, 120 Å, 1.5 x 100 mm |
|
Column temperature: |
60 °C |
|
Sample temperature: |
6 °C |
|
Injection volume: |
1 µL |
|
Mobile phase A: |
0.1% Formic Acid in H2O |
|
Mobile phase B: |
0.1% Formic Acid in ACN |
|
Sample vials: |
QuanRecovery™ MaxPeak 12 x 32 mm Propylene 300 µL Screw Cap Vials (p/n:186009186) |
Xevo™ G2 Detector Settings
|
ESI probe: |
Low-flow probe (p/n: 186007529) |
|
Mass range: |
50–2000 m/z |
|
Mode: |
ESI+ |
|
Sample rate: |
1 Hz |
|
Cone voltage: |
30 V |
|
Source temperature: |
120 °C |
|
Desolvation temperature: |
250 °C |
|
Capillary voltage: |
2.50 kV |
|
Cone gas: |
50 L/h |
|
Desolvation gas: |
350 L/h |
|
Lockmass: |
LeuEnk (556.27658 m/z) |
|
Informatics: |
waters_connect™ Software |
Gradient Table (Waters Column, Column K, Column Y)
Gradient Table (Column H, conditions adjusted to the column ID of 1.5 mm)
Results and Discussion
Figure 1 shows the total ion chromatograms (TICs) from the first injection of the MassPREP Enolase Digest with Phosphopeptides Mix on a BioResolve Peptide C18 RP Column and 3 columns from alternative vendors. Column K and Column Y have the same dimensions as the BioResolve Peptide C18 RP Column (1.0 x 100 mm), while Column H has a larger inner diameter (1.5 x 100 mm). Separation performance for non-acidic peptides was quantified for each column by calculating the average peak capacity across 4 peptides. Of the three 1.0 mm ID columns tested, the BioResolve Peptide C18 RP Column exhibits the best separation performance for non-acidic peptides; its peak capacity is over 10% higher than Column K and Column Y. A slightly higher peak capacity is observed on Column H, as expected due to the column’s larger inner diameter which reduces the deleterious impact of post-column band dispersion. However, the BioResolve Peptide C18 RP Column far outperforms all three alternative columns in the separation of acidic peptides, leading to improved reproducibility and signal-to-noise, as discussed in more detail below.
Peak Shape and Recovery of Acidic and Phosphorlyated Peptides
Extracted ion chromatograms (XICs) of 4 phosphorylated peptides from the MassPREP Enolase Digest with Phosphopeptides Mix on a BioResolve Peptide C18 RP Column and 3 columns from alternative vendors are shown in Figure 2. Data from the first injection on each column is shown. The BioResolve Peptide C18 RP Column uses MaxPeak Premier hardware that mitigates secondary interactions with acidic analytes. As a result, all 4 phosphopeptides are recovered on the first injection, including the doubly phosphorylated T43pp peptide. T43pp is poorly recovered on the first injection on Column K and Column Y and not recovered on Column H. The T34pp peak area is plotted against injection number for each column on the top right of Figure 2. The T43pp peak area on the BioResolve Peptide C18 RP Column plateaus by injection 3 while Column K, Column Y, and Column H show an increase in peak area with each injection. The T43pp peak area on injection 5 on all 3 alternative columns is lower than that of injection one on the BioResolve Peptide C18 RP Column.
On all columns, the phosphopeptides exhibit peak tailing on the first injection and improved peak shape after column conditioning. Notably, the BioResolve Peptide C18 RP Column exhibits the least phosphopeptide peak tailing of the 4 columns studied. The USP tailing factor for the T19p peptide is plotted against injection number in the bar chart on the bottom right of Figure 2. Even with conditioning, the T19p tailing factor is higher on Column K and Column Y than on the unconditioned BioResolve Peptide C18 RP Column. Column H exhibits the highest T19p tailing factor without conditioning and required significant column conditioning for improved peak shape.
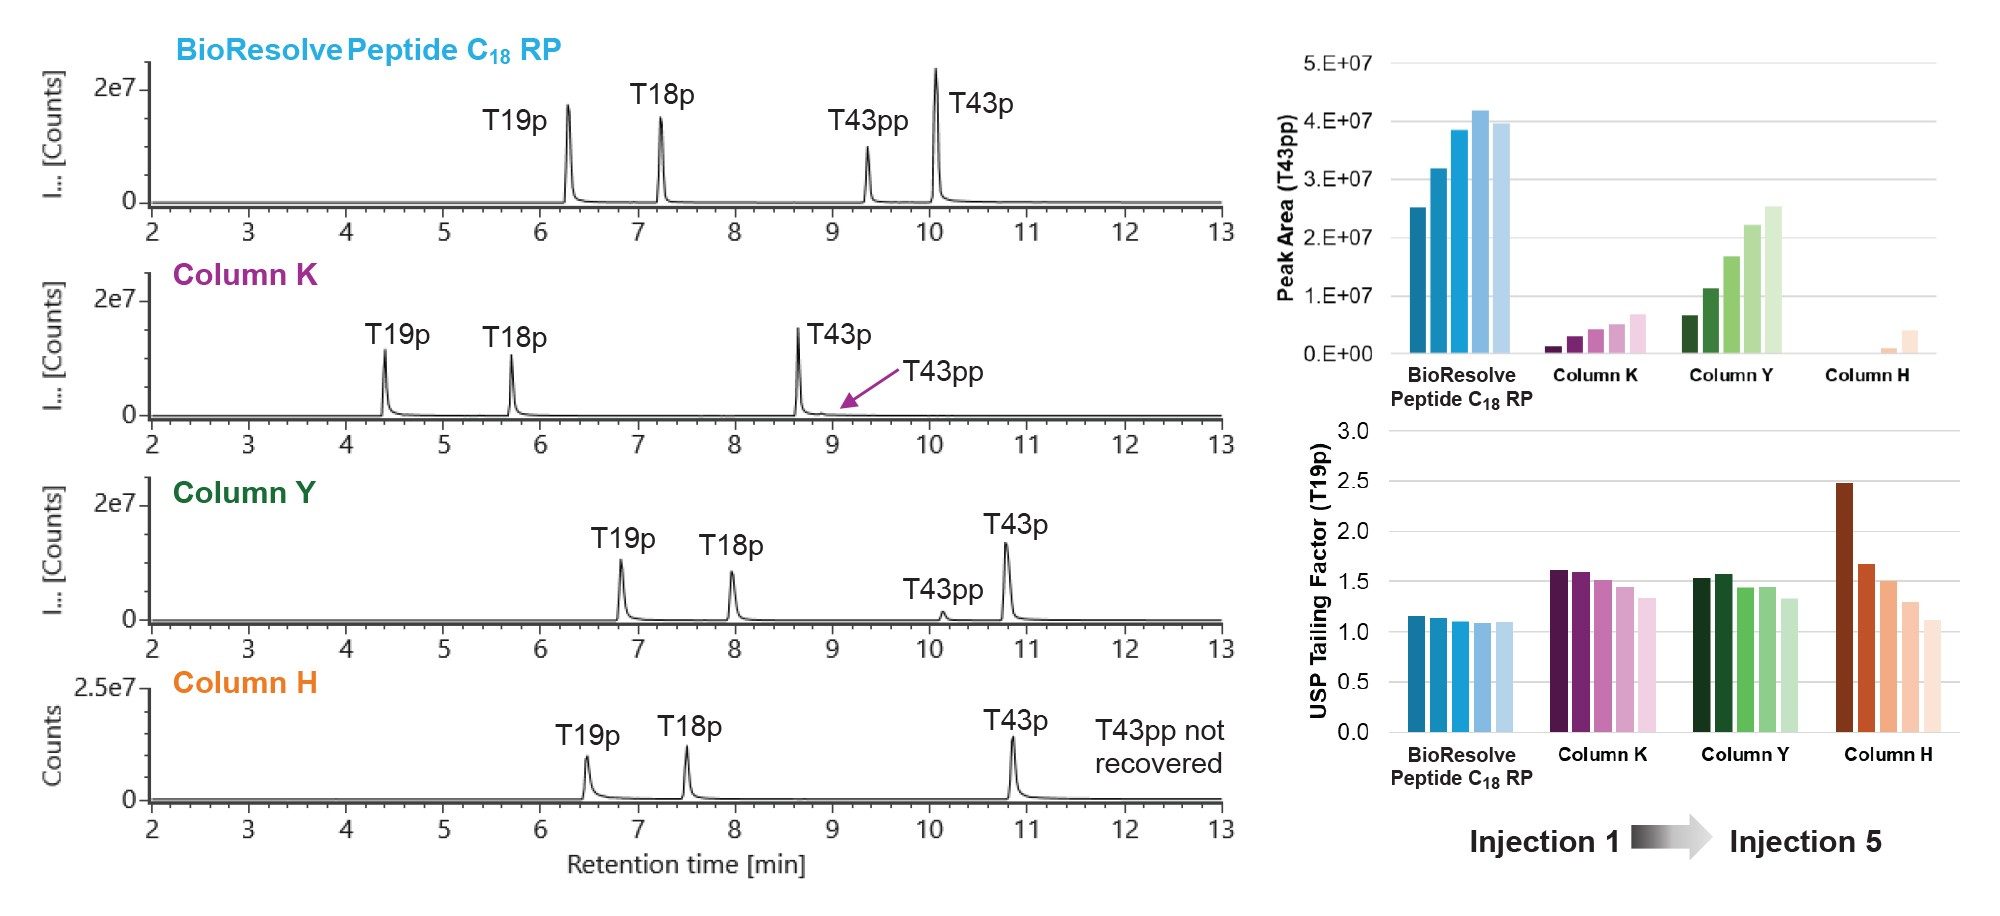
Figure 3 shows the XICs of 4 acidic peptides from the MassPREP Enolase Digest with Phosphopeptides Mix on a Waters BioResolve Peptide C18 RP Column and 3 columns from alternative vendors. Data from injections 1, 3, and 5 are shown. All 4 acidic peptides elute as sharp peaks with minimal tailing on the first injection on the BioResolve Peptide C18 RP Column. On Column Y, peak tailing is observed for all 4 acidic peptides, resulting in low peak intensities relative to the BioResolve Peptide C18 RP Column. Injections 3 and 5 exhibit a slight improvement in peak tailing attributable to the column conditioning, but peak intensities are still over 40% lower on the conditioned Column Y than on the unconditioned BioResolve Peptide C18 RP Column. Column K and Column H exhibit very poor separation of the 4 acidic peptides as shown in Figure 3; peaks are wide, asymmetric, and exhibit low signal intensity on the first injection, likely due to secondary interactions with the column hardware. Peak shape improves with column conditioning, but substantial tailing is still observed on injection 5. These results underscore the superior recovery and peak shape of acidic and phosphopeptides on the BioResolve Peptide C18 RP Column and demonstrate the reduced need for column conditioning relative to alternative columns.
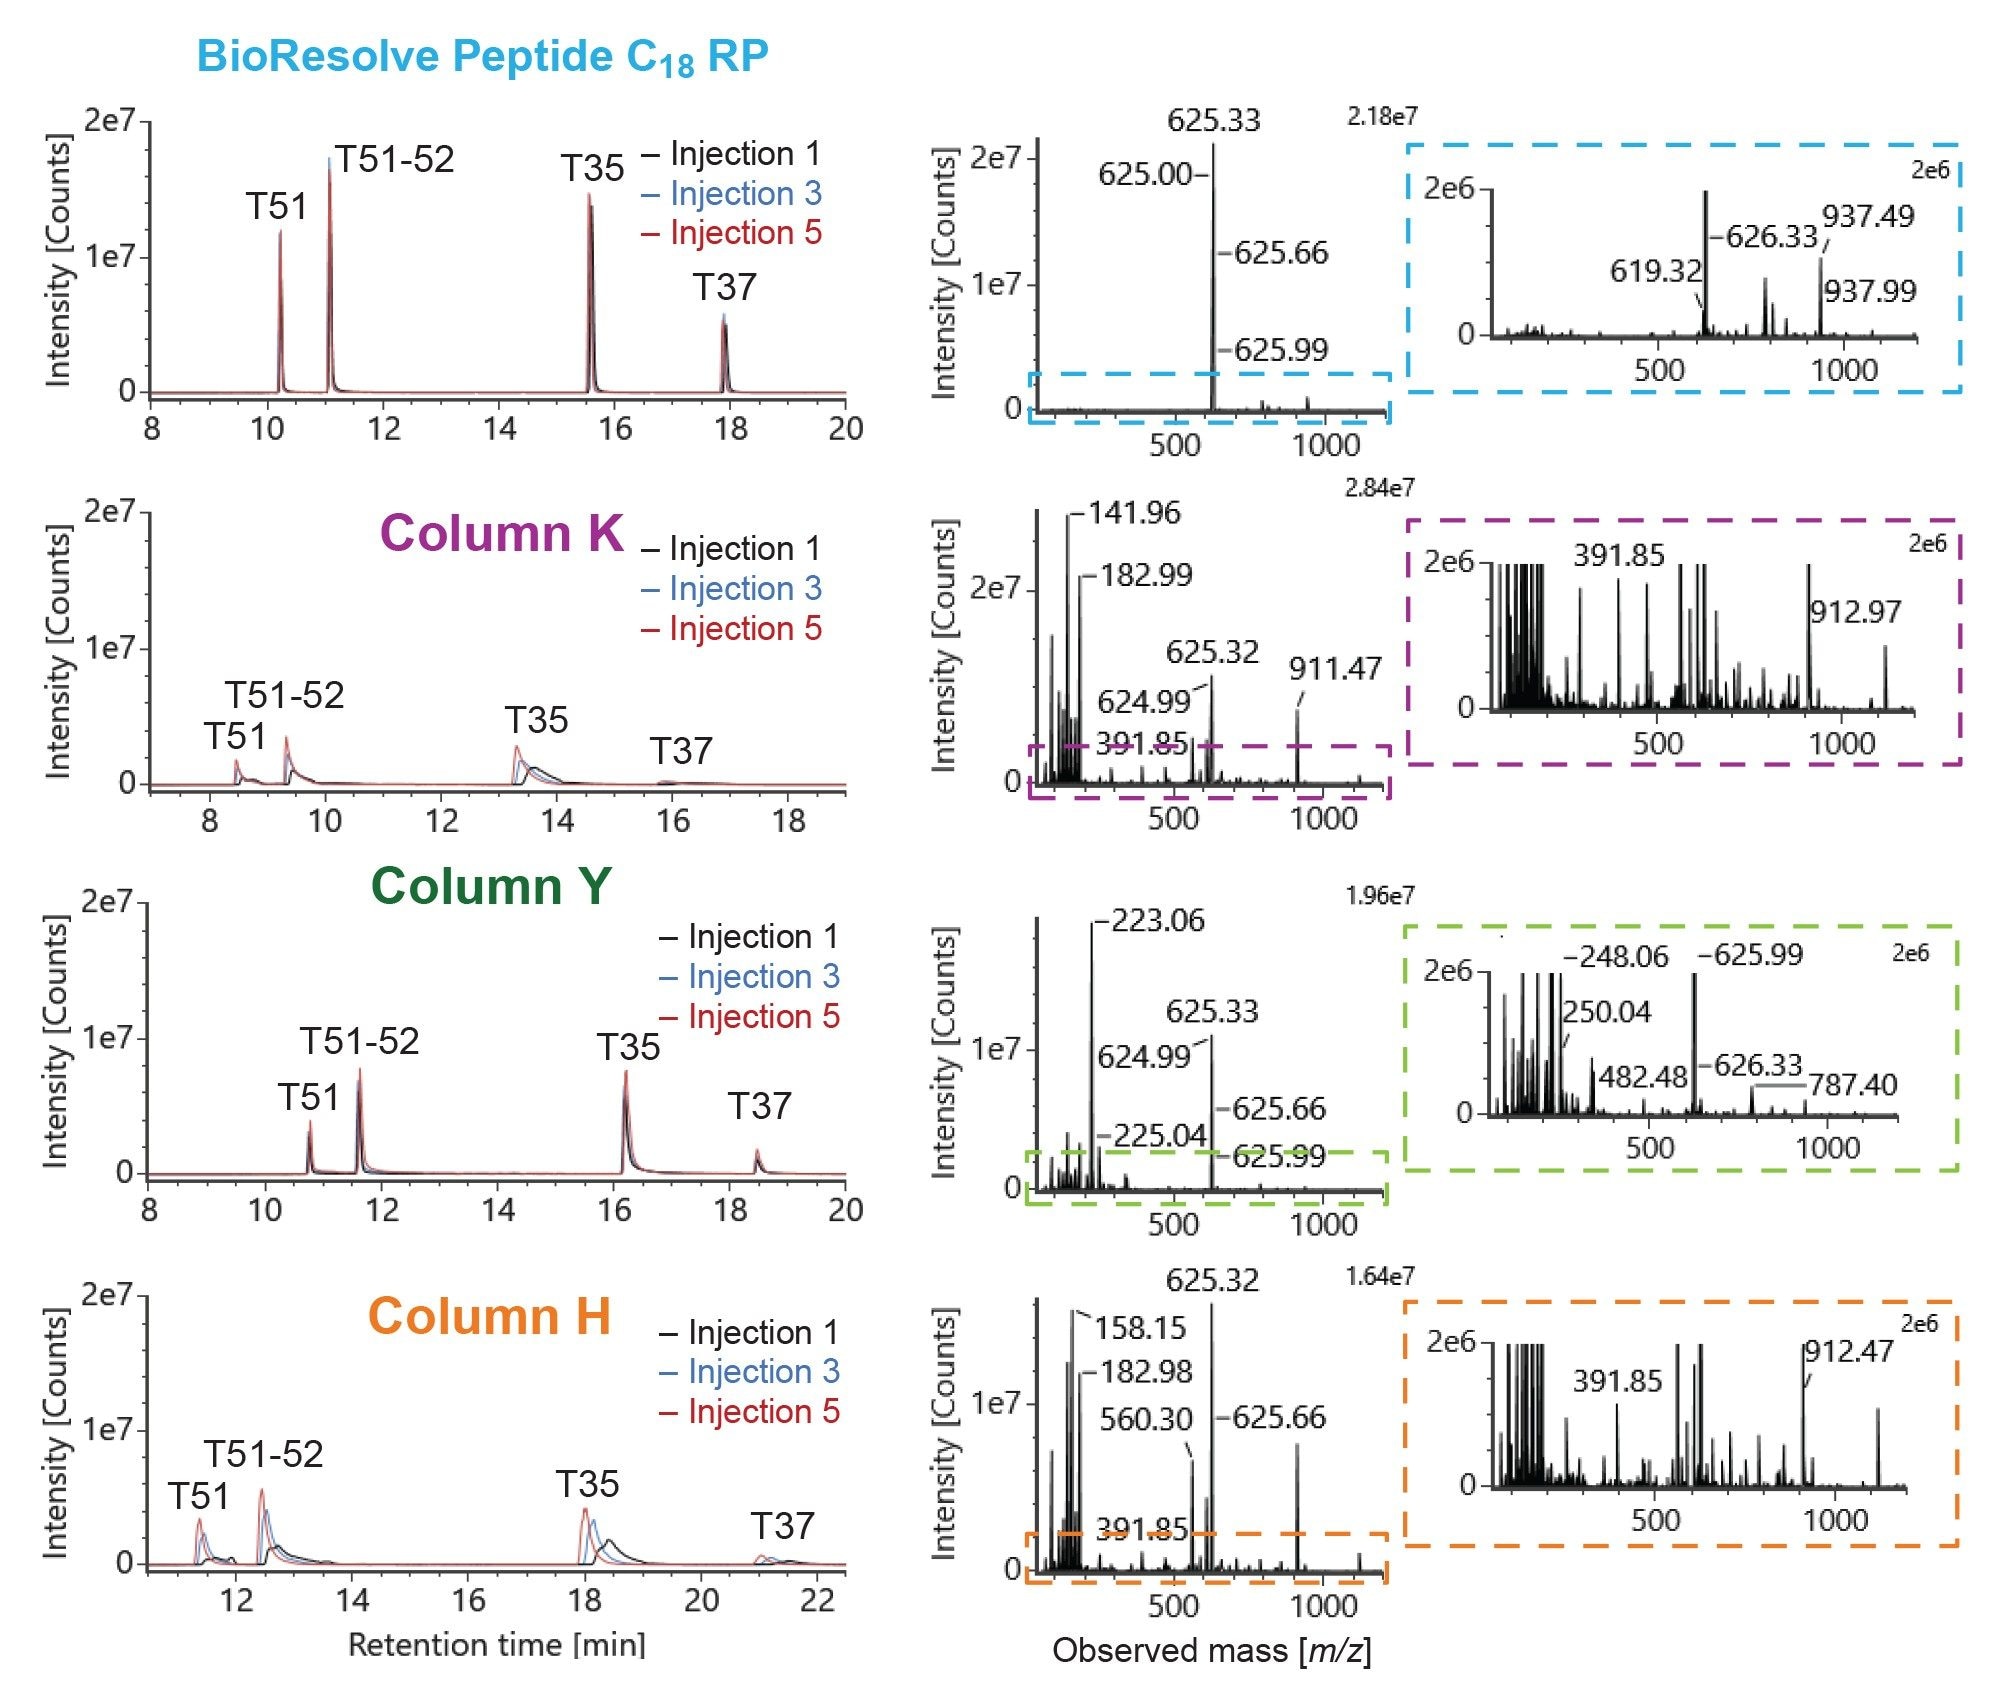
Impact of Separation Performance on MS Data Quality
The superior separation of acidic and phosphorylated peptides on the BioResolve Peptide C18 RP Column improves the quality of mass spectral data, enhancing confidence in peptide identification. The mass spectra for the T35 peptide from the first injection on each column are shown on the right of Figure 3. The cleanest spectrum is obtained on the BioResolve Peptide C18 RP Column, exhibiting the highest signal for the triply charged ion (625.33 m/z) with minimal noise from co-eluting species. On all 3 alternative columns, the signal for the triply charged T35 ion is over 40% lower than the BioResolve Peptide C18 RP Column. The T35 spectra from Columns K and H show high baseline noise across the entire mass-to-charge range analyzed. Both columns exhibit wide, asymmetric acidic peptide peaks, leading to co-elution of multiple species and poor signal-to-noise in the mass spectra. Less noise is exhibited in the T35 mass spectra from Column Y, but a high signal at 223.06 m/z is observed due to column bleed. These results demonstrate the impact of chromatographic separation on MS signal-to-noise, highlighting the benefits of the improved separation of the BioResolve Peptide C18 RP Column in proteomics workflows.
Conclusion
The BioResolve Peptide C18 RP 1.0 mm ID Column with MaxPeak Premier Technology provides clear performance advantages for microflow proteomics applications. Its enhanced surface chemistry minimizes secondary interactions with acidic analytes, enabling sharper peak shapes, higher recovery, and excellent reproducibility from the first injection compared to currently available column technologies. Head-to-head comparison to three alternative microflow columns demonstrates higher peak capacity, improved recovery and peak shape of acidic and phosphorylated peptides, and cleaner MS data on the BioResolve Peptide C18 RP Column. These columns offer a robust and sensitive LC-MS proteomics solution that is both economical and environmentally sustainable.
References
- Gao, Y., Fillmore, T. L., Munoz, N., Bentley, G. J., Johnson, C. W., Kim, J., Meadows, J. A., Zucker, J., Burnet, M. C., Lipton, A. K., Bilbao, A., Orton, D. J., Kim, Y., Moore, R. J., Robinson, E. W., Baker, S. E., Webb-Robertson, B. M., Guss, A. M., Gladden, J. M., Beckham, G. T., Magnuson, J. K., Burnum-Johnson, K. E. High-Throughput Large-Scale Targeted Proteomics Assays for Quantifying Pathway Proteins in Pseudomonas putida KT2440. Front. Bioeng. Biotechnol., 2020, 8, 1–13.
- Lennon, S., Hughes, C. J., Muazzam, A., Townsend, P. A., Gethings, L. A., Wilson, I. D., Plumb, R. S. High-Throughput Microbore Ultrahigh-Performance Liquid Chromatography-Ion Mobility-Enabled-Mass Spectrometry-Based Proteomics Methodology for the Exploratory Analysis of Serum Samples from Large Cohort Studies. J. Proteome Res. 2021, 20, 3, 1705–1715.
- Berthelette, K. Collins, C., Walter, T. H. Improving Sensitivity and Analytical Method Greenness using MaxPeak™ Premier 1.0 mm Internal Diameter Columns. Waters Application Note. 720009221, 2026.
- Hanna, C. M., Koza, S. M., Addepalli, B. Enhanced Recovery and Peak Shape of Acidic Peptides with BioResolve™ 1 mm ID Columns with MaxPeak™ Premier Technology. Waters Application Note. 720009231, 2026.
Featured Products
720009274, March 2026