Denaturing SEC-MS Analysis of High Molecular Weight Impurities in the GLP-1a Lipopeptides Semaglutide and Tirzepatide
Stephan M. Koza, Philip Wuthrich, Stephen J. Shiner, Matthew A. Lauber
Waters Corporation, United States
Published on March 05, 2026
Abstract
A denaturing size-exclusion chromatography (dSEC) method along with high-resolution mass spectrometry detection (dSEC-HRMS) for the analysis of the GLP-1a constructs tirzepatide and semaglutide is presented. This method highlights the utility of the ACQUITY™ MaxPeak™ Premier SEC 125 Å, 1.7 µm 4.6 x 150 mm Column along with a Xevo™ G3 Q-ToF Mass Spectrometer with an ESI source.
The hyphenated dSEC-HRMS method can provide detailed mass information for non-dissociable GLP-1a high molecular weight species (HMWS) observed under highly denaturing SEC separation conditions. In addition, UV absorbance measurements at 280 nm (A280) can also be used to determine both the relative abundances of non-dissociable HMWS and peptide concentration.
Benefits
- dSEC-HRMS evaluation of non-dissociable HMWS in therapeutic GLP-1a constructs tirzepatide and semaglutide
Intact HRMS identification of separated variants
A280 determination of HMWS relative abundances and monomer concentration - Direct analysis of formulated high-concentration GLP-1a samples
Introduction
Tirzepatide and semaglutide are glucagon-like peptide-1 analogs (GLP-1a) with average molecular weights of 4813.53 Da and 4113.58 Da, respectively. These GLP-1a lipopeptide constructs both possess a fatty acid side chain that can present additional analytical challenges compared to peptides comprised of only naturally occurring amino acids. Lipopeptides have a propensity to self-associate as non-covalent oligomeric HMWS. Analytical methods such as native size-exclusion chromatography in conjunction with multi-angle light scattering (nSEC-MALS) can provide useful insights into their behavior in solution.1
In addition to non-covalent oligomerization, covalently linked HMWS can also be formed in peptide preparations.2 Here, dSEC and dSEC-MALS can be used to evaluate the extent of apparently covalent HMWS formation.1,3 As a complementary approach to dSEC-MALS, potentially insightful HMWS characterization can also be obtained via dSEC-HRMS analysis. It is important to note that definitive assignment of the observed HMWS being covalent in nature would require additional characterization data, therefore the HMWS observed in this study will be considered as non-dissociable under the conditions deployed.
In this study, a dSEC-HRMS method is described for the characterization of non-dissociable low-abundance HMWS in GLP-1a samples using an ACQUITY Premier SEC 125 Å, 1.7 µm 4.6 x 150 mm Column that was previously demonstrated is an effective column for dSEC analysis of insulin.4 The highly denaturing dSEC-HRMS separation conditions used for the GLP-1a samples were based on a previously published method and used a mobile phase of 0.05% TFA in 55% acetonitrile, a column temperature of 45 °C, and a flow rate of 0.2 ml/min.3 MS data were obtained using a Xevo G3 Q-ToF Mass Spectrometer.
Experimental
Sample Descriptions
1. Semaglutide (Ozempic® at 1.34 mg/mL) and tirzepatide (Zepbound® at 10 mg/mL) were analyzed past expiry.
LC Conditions
|
LC system: |
ACQUITY UPLC™ System with BSM, FTN Sample Manager, and ACQUITY TUV Detector (5 mm flow cell) |
|
Column: |
ACQUITY 125 Å SEC Column, MaxPeak Premier, 1.7 µm, 4.6 x 150 mm (p/n: 186011350) |
|
Column temperature: |
Ambient |
|
Sample temperature: |
6 °C |
|
Injection volume: |
As indicated |
|
Mobile phase: |
0.05% TFA in 55% acetonitrile (LC-MS grade) |
|
Flow rate: |
0.20 mL/min |
|
Column temperature: |
45 °C |
|
Detector: |
TUV, 280 nm at 5 Hz |
|
Data management: |
UNIFI™ and waters_connect™ Software |
Xevo G3 Q-ToF Mass Spectrometer Parameters
|
Low mass: |
500 m/z |
|
High mass: |
3500 m/z |
|
Scan time: |
0.500 s |
|
Collision energy mode: |
Off (6V) |
|
Intelligent data capture threshold: |
Custom (1) |
|
Source temperature: |
120 °C |
|
Desolvation temperature: |
350 °C |
|
Cone gas: 35 L/h |
35 L/h |
|
Desolvation gas: |
600 L/h |
|
Capillary voltage: |
2.20 Kv |
|
Sample cone voltage: |
20 V |
|
Data collection and analysis: |
UNIFI and waters_connect Software |
Results and Discussion
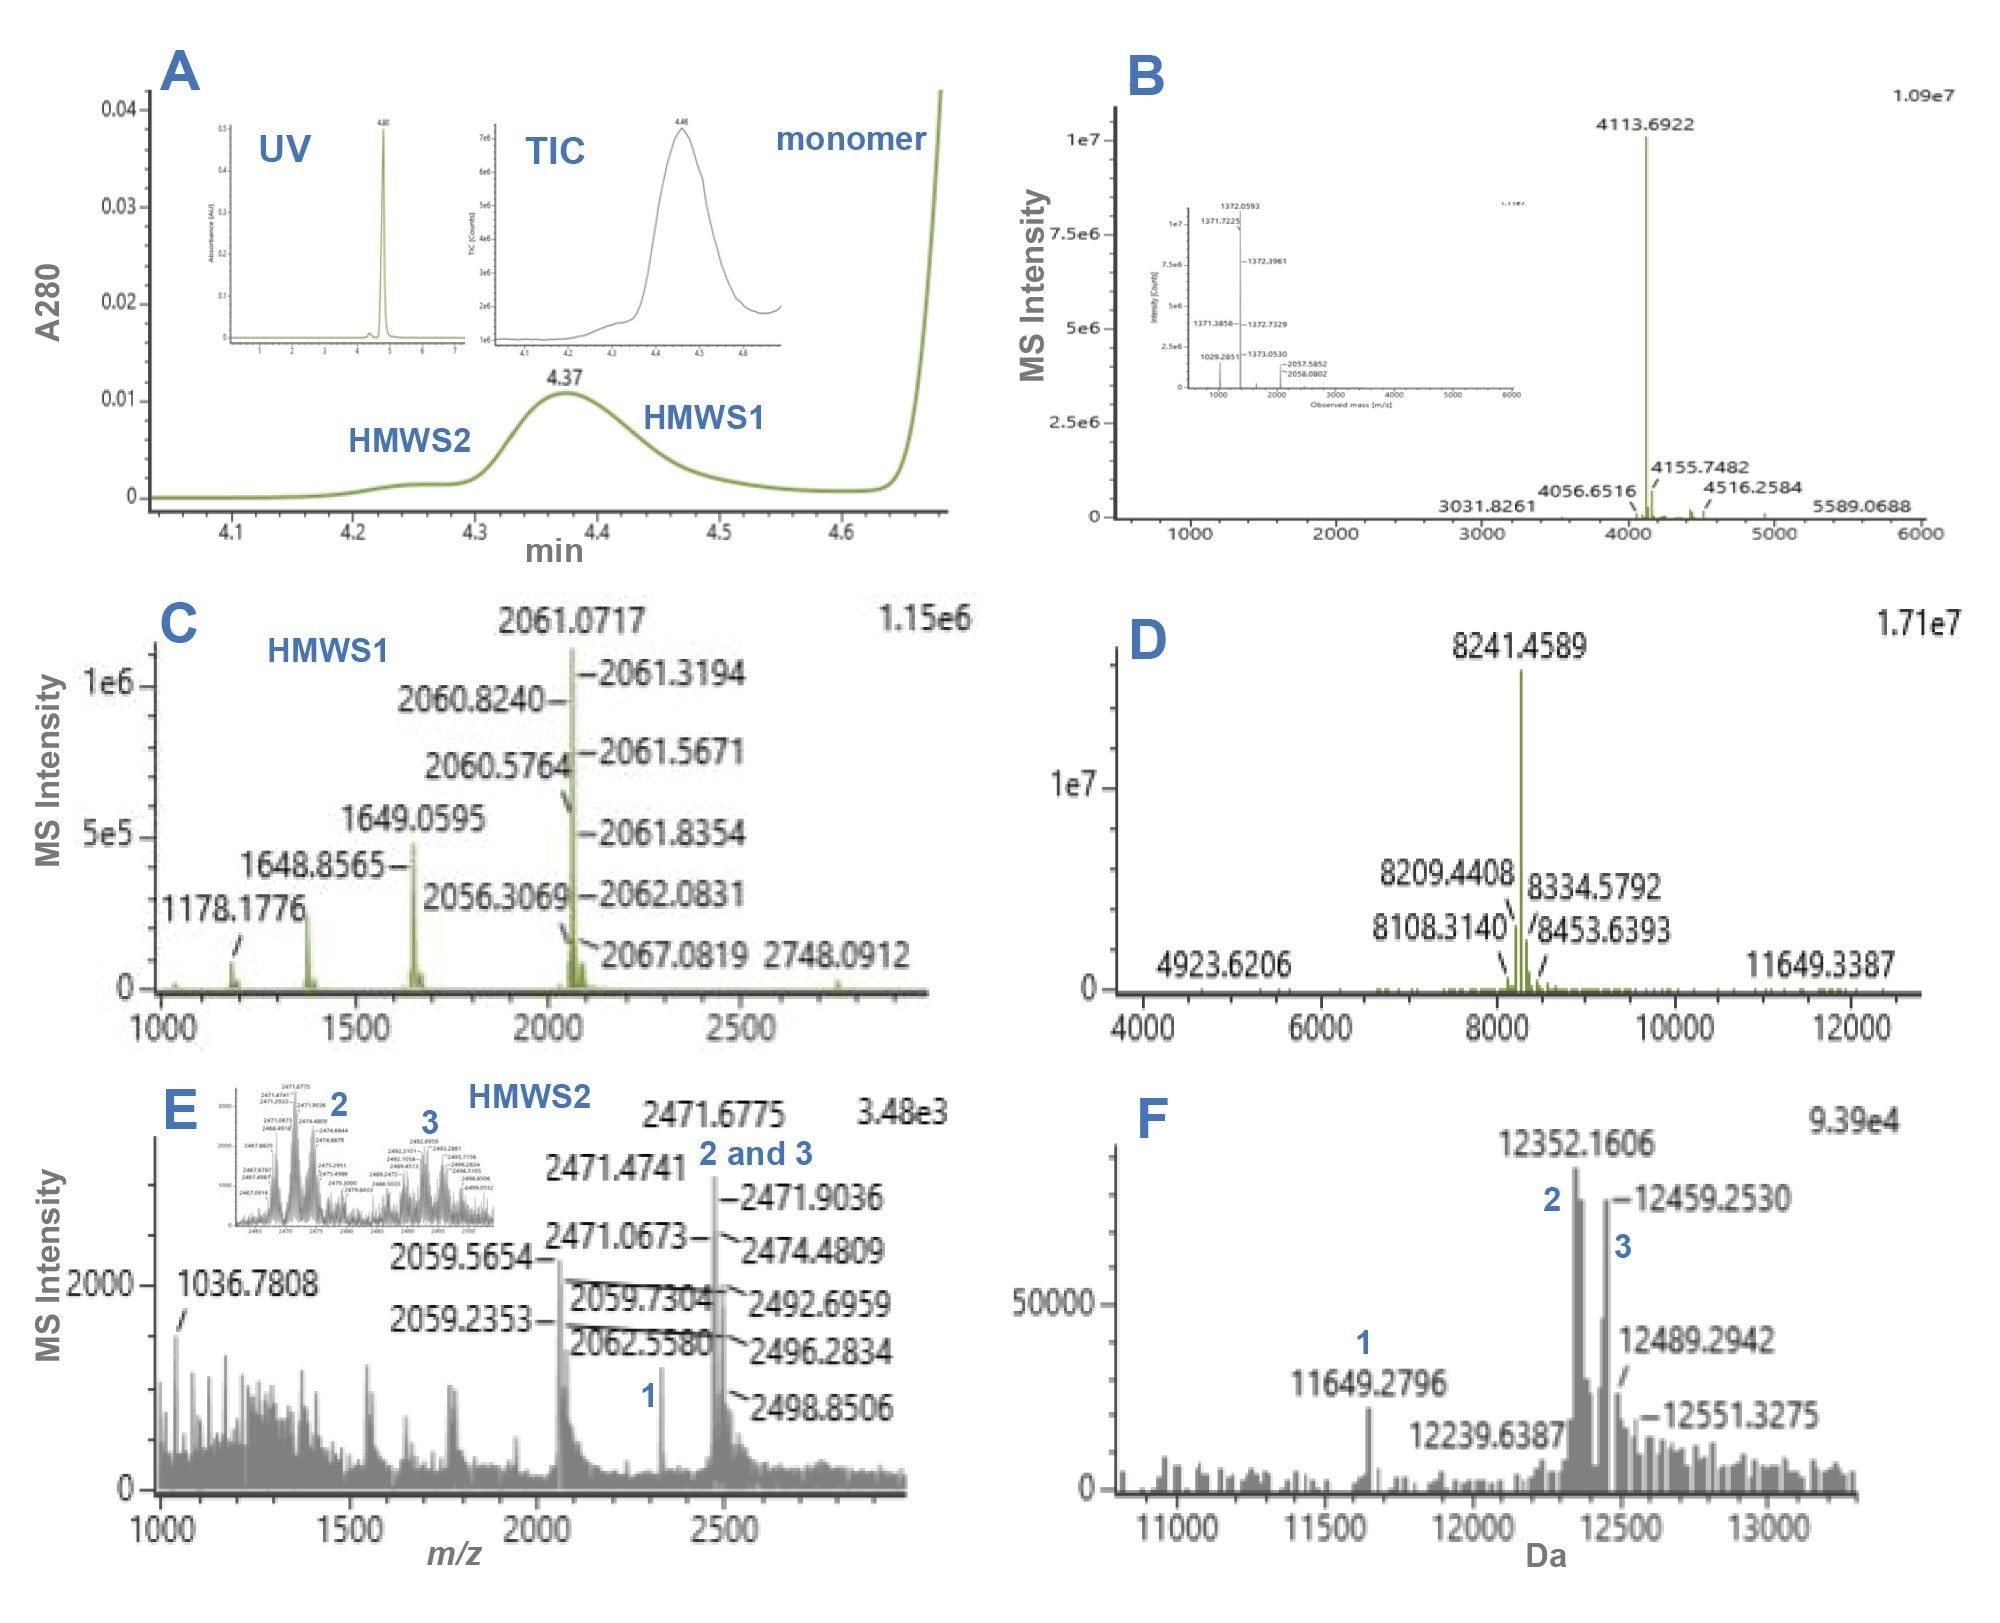
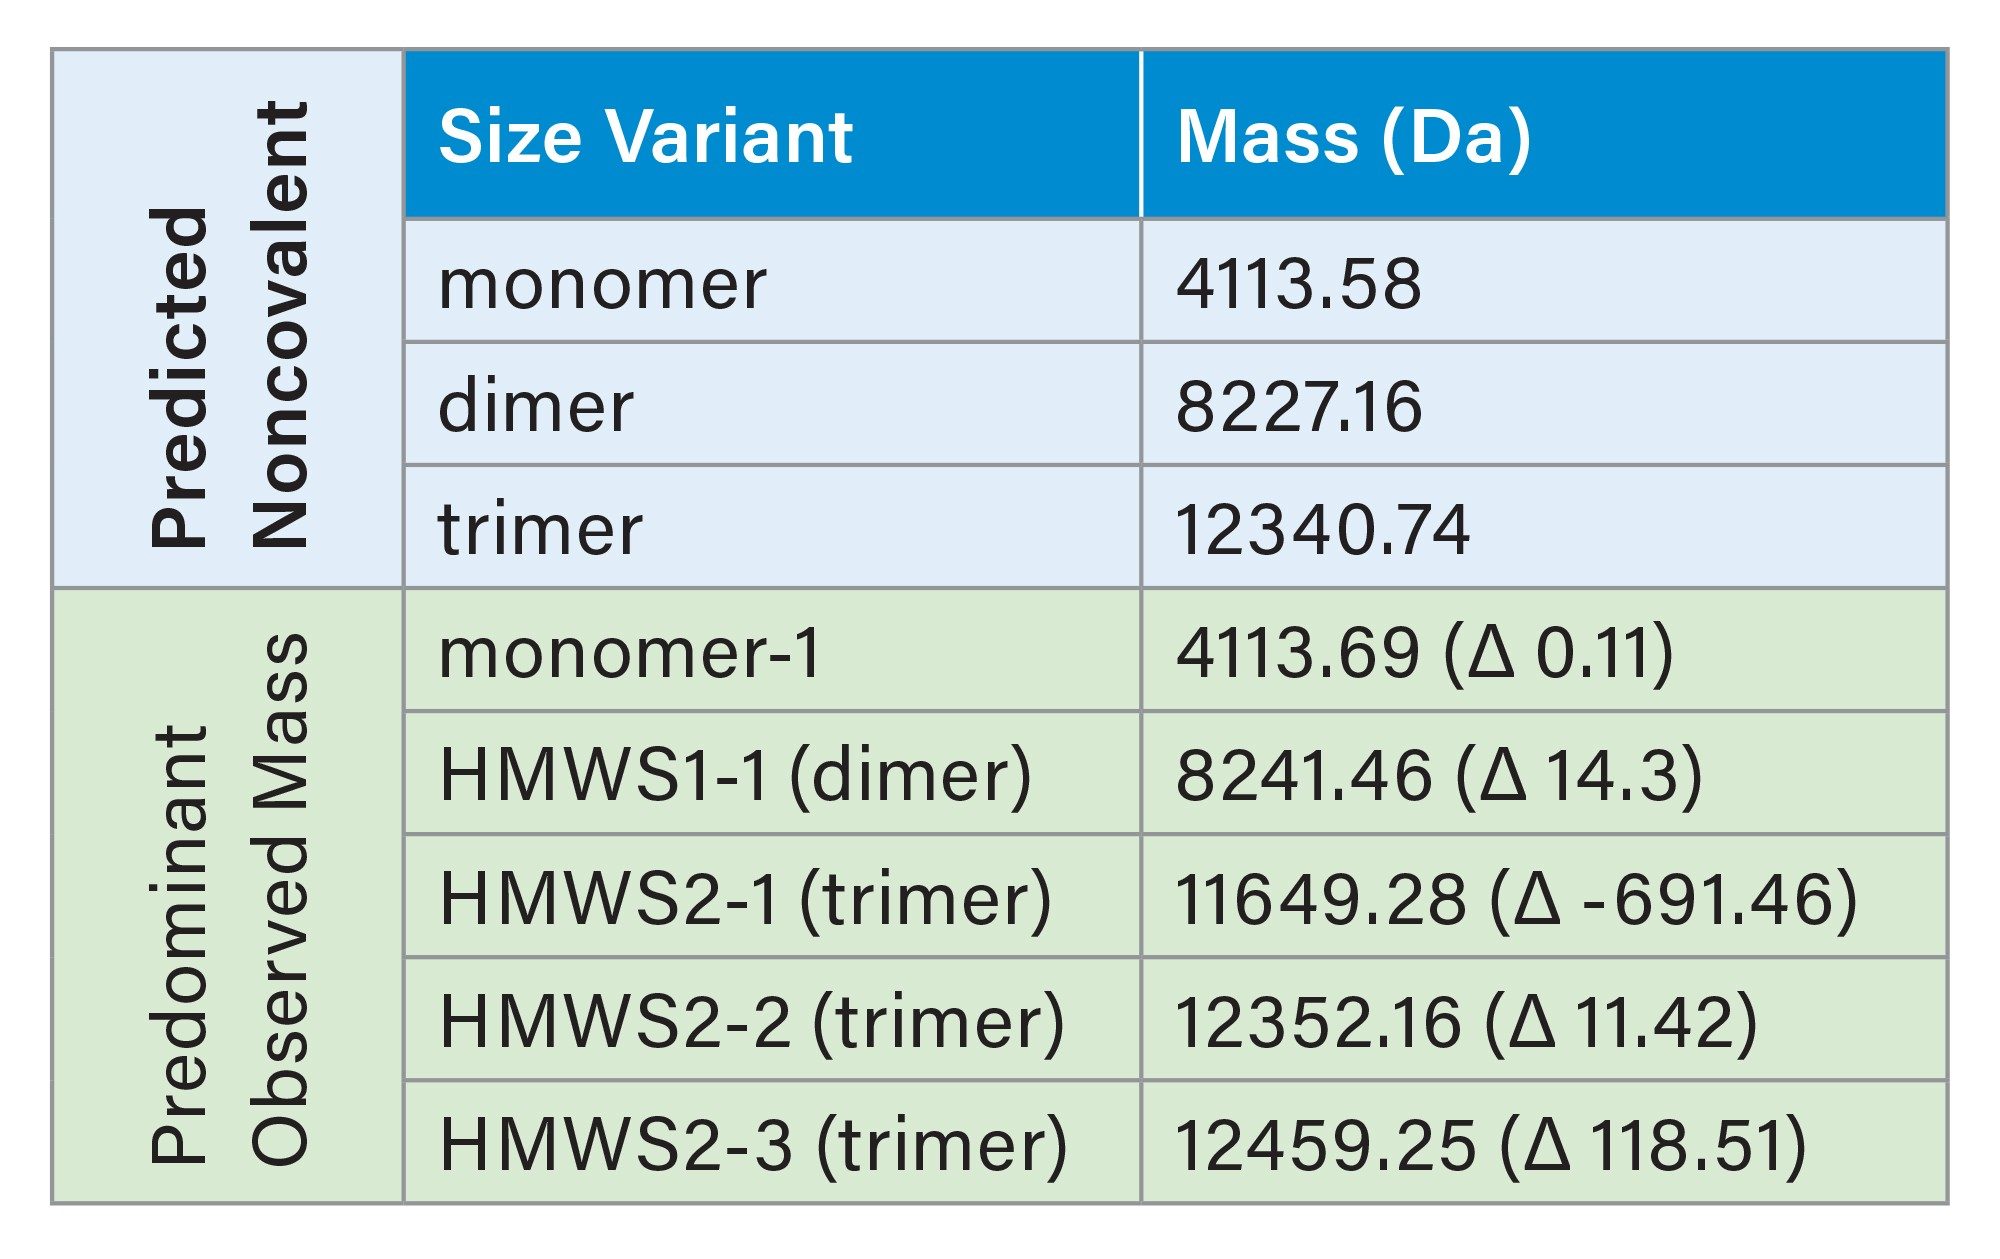
Representative dSEC chromatograms and HRMS spectra for semaglutide and tirzepatide preparations are presented in Figures 1 and 2, while selected mass data are presented in Table 1 and Table 2. The monomer masses measured for semaglutide and tirzepatide were consistent with the predicted values.
For semaglutide, two HMWS peaks were observed, HMWS1 and HMWS2 (Figure 1A). The elution times were consistent with HMWS1 being a dimer and HMWS2 being a trimer. The average relative abundance of HMWS1 was 2.6% and that of HMWS2 was 0.17% (Figure 3). The predominant observed masses for HMWS1 and HMWS2 were also consistent with their dimer and trimer assignments (Table 1). However, significant delta masses from their predicted respective most abundant non-covalent self-associated forms were noted. Of these, the mass of semaglutide HMWS2-1 (11649.28 Da) was 691.46 Da lower than would be predicted for a trimer indicative of the presence of a significantly truncated peptide species.
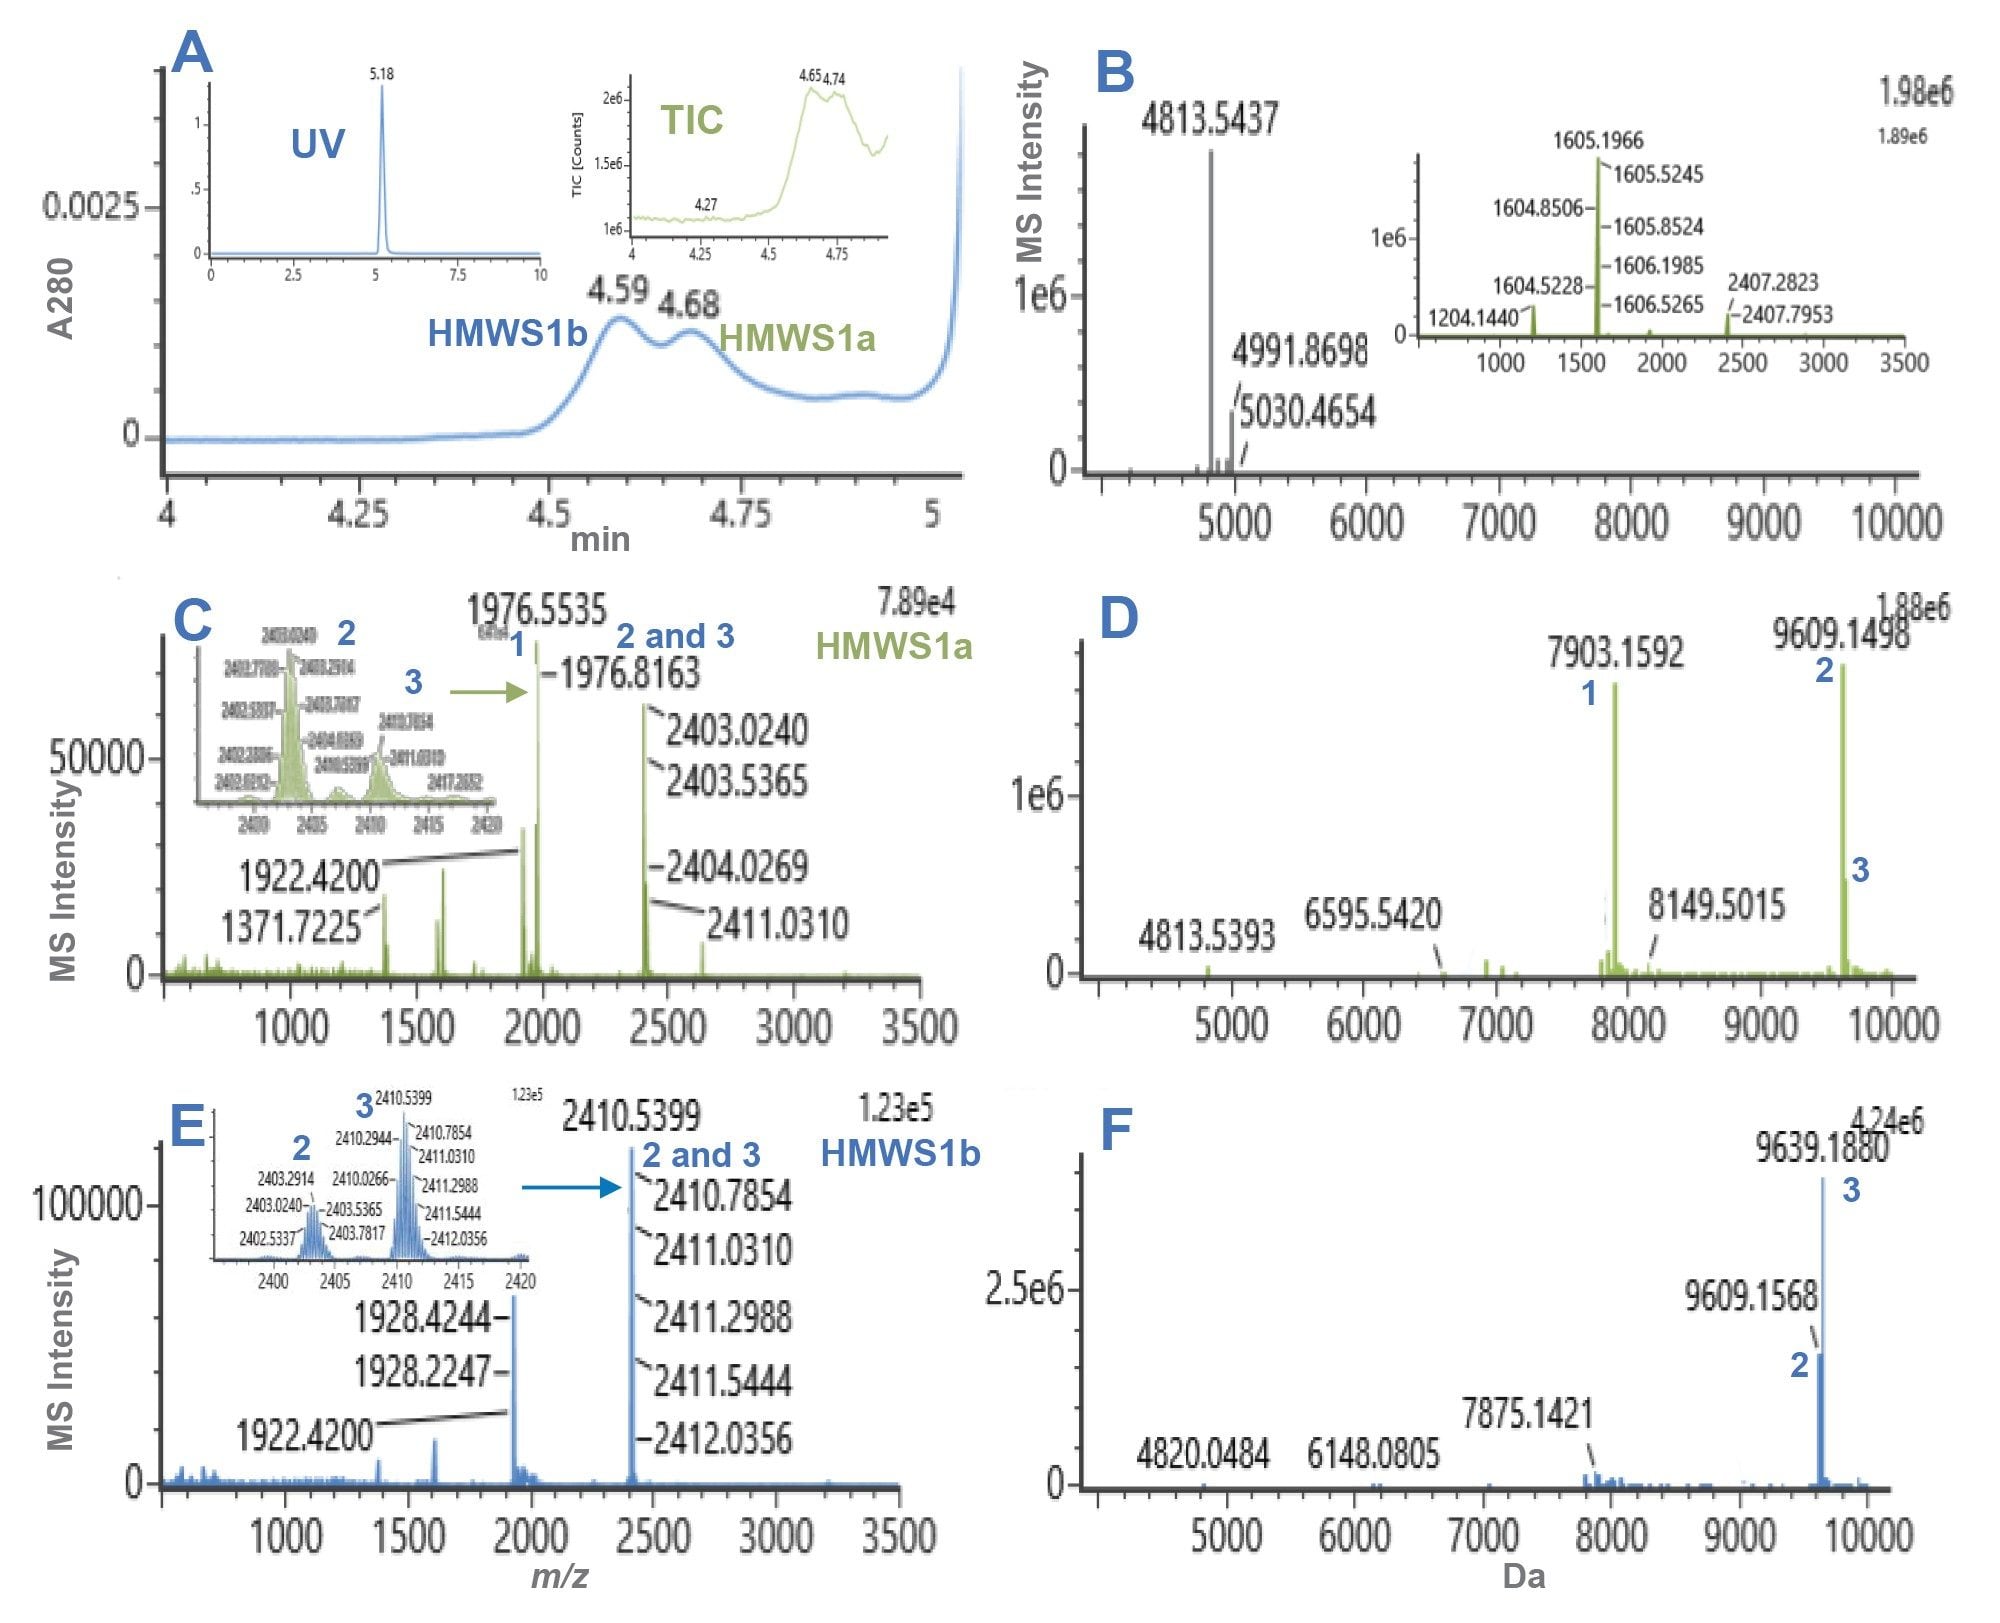
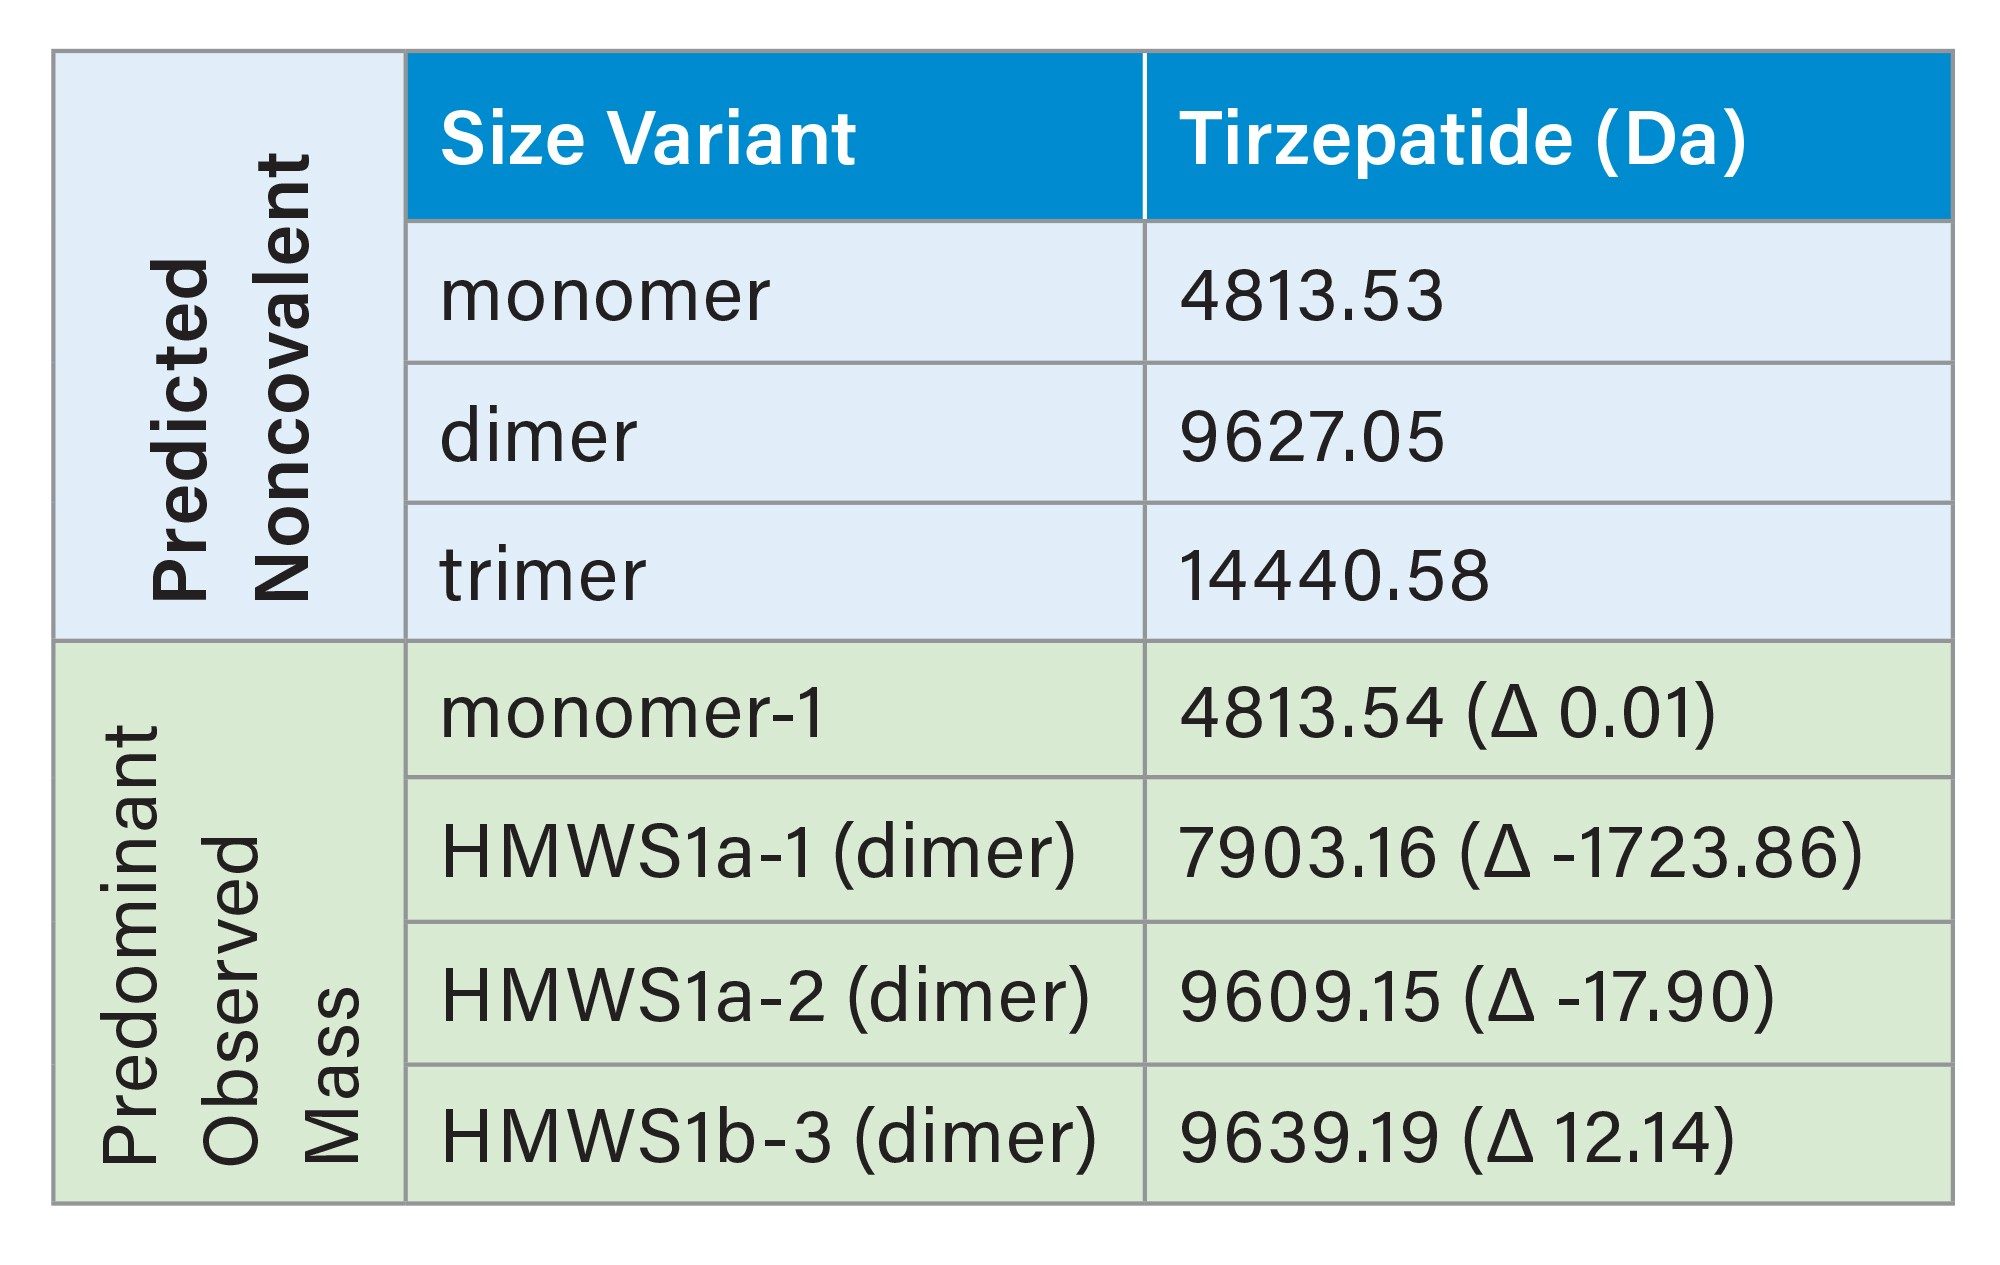
For tirzepatide, two HMWS peaks were observed, HMWS1a and HMWS1b (Figure 2A). Their elution times were consistent with that of a dimer and had relative abundances of 0.06% for HMWS1a and 0.07% for HMWS1b (Figure 3). The predominant observed masses for HMWS1a and HMWS1b were consistent with dimer (Table 2), however, similar to semaglutide, they demonstrated significant delta masses from the predicted non-covalent dimer form. In addition, an abundant significantly truncated peptide species (HMWS1a-1, 7903.16 Da) that had a mass 1723.86 Da lower than would be predicted for a dimer.
These dSEC-HRMS data did not permit definitive structural elucidation of the low abundance non-dissociable HMWS observed for semaglutide and tirzepatide. While there is a potential for semaglutide or tirzepatide crosslinking to occur between tryptophan and tyrosine side-chains (W-W, Y-Y, or W-Y), this would only result in a -2 Da mass-shift, which was not observed in this study.5 Alternatively, if one of these crosslinks was in concert with an oxidation event, several of the HMWS observed are suggestive of such a pathway. Confident structural elucidation of these HMWS would require substantial additional studies including proteolytic fragmentation and MS-MS analyses among other methodologies.
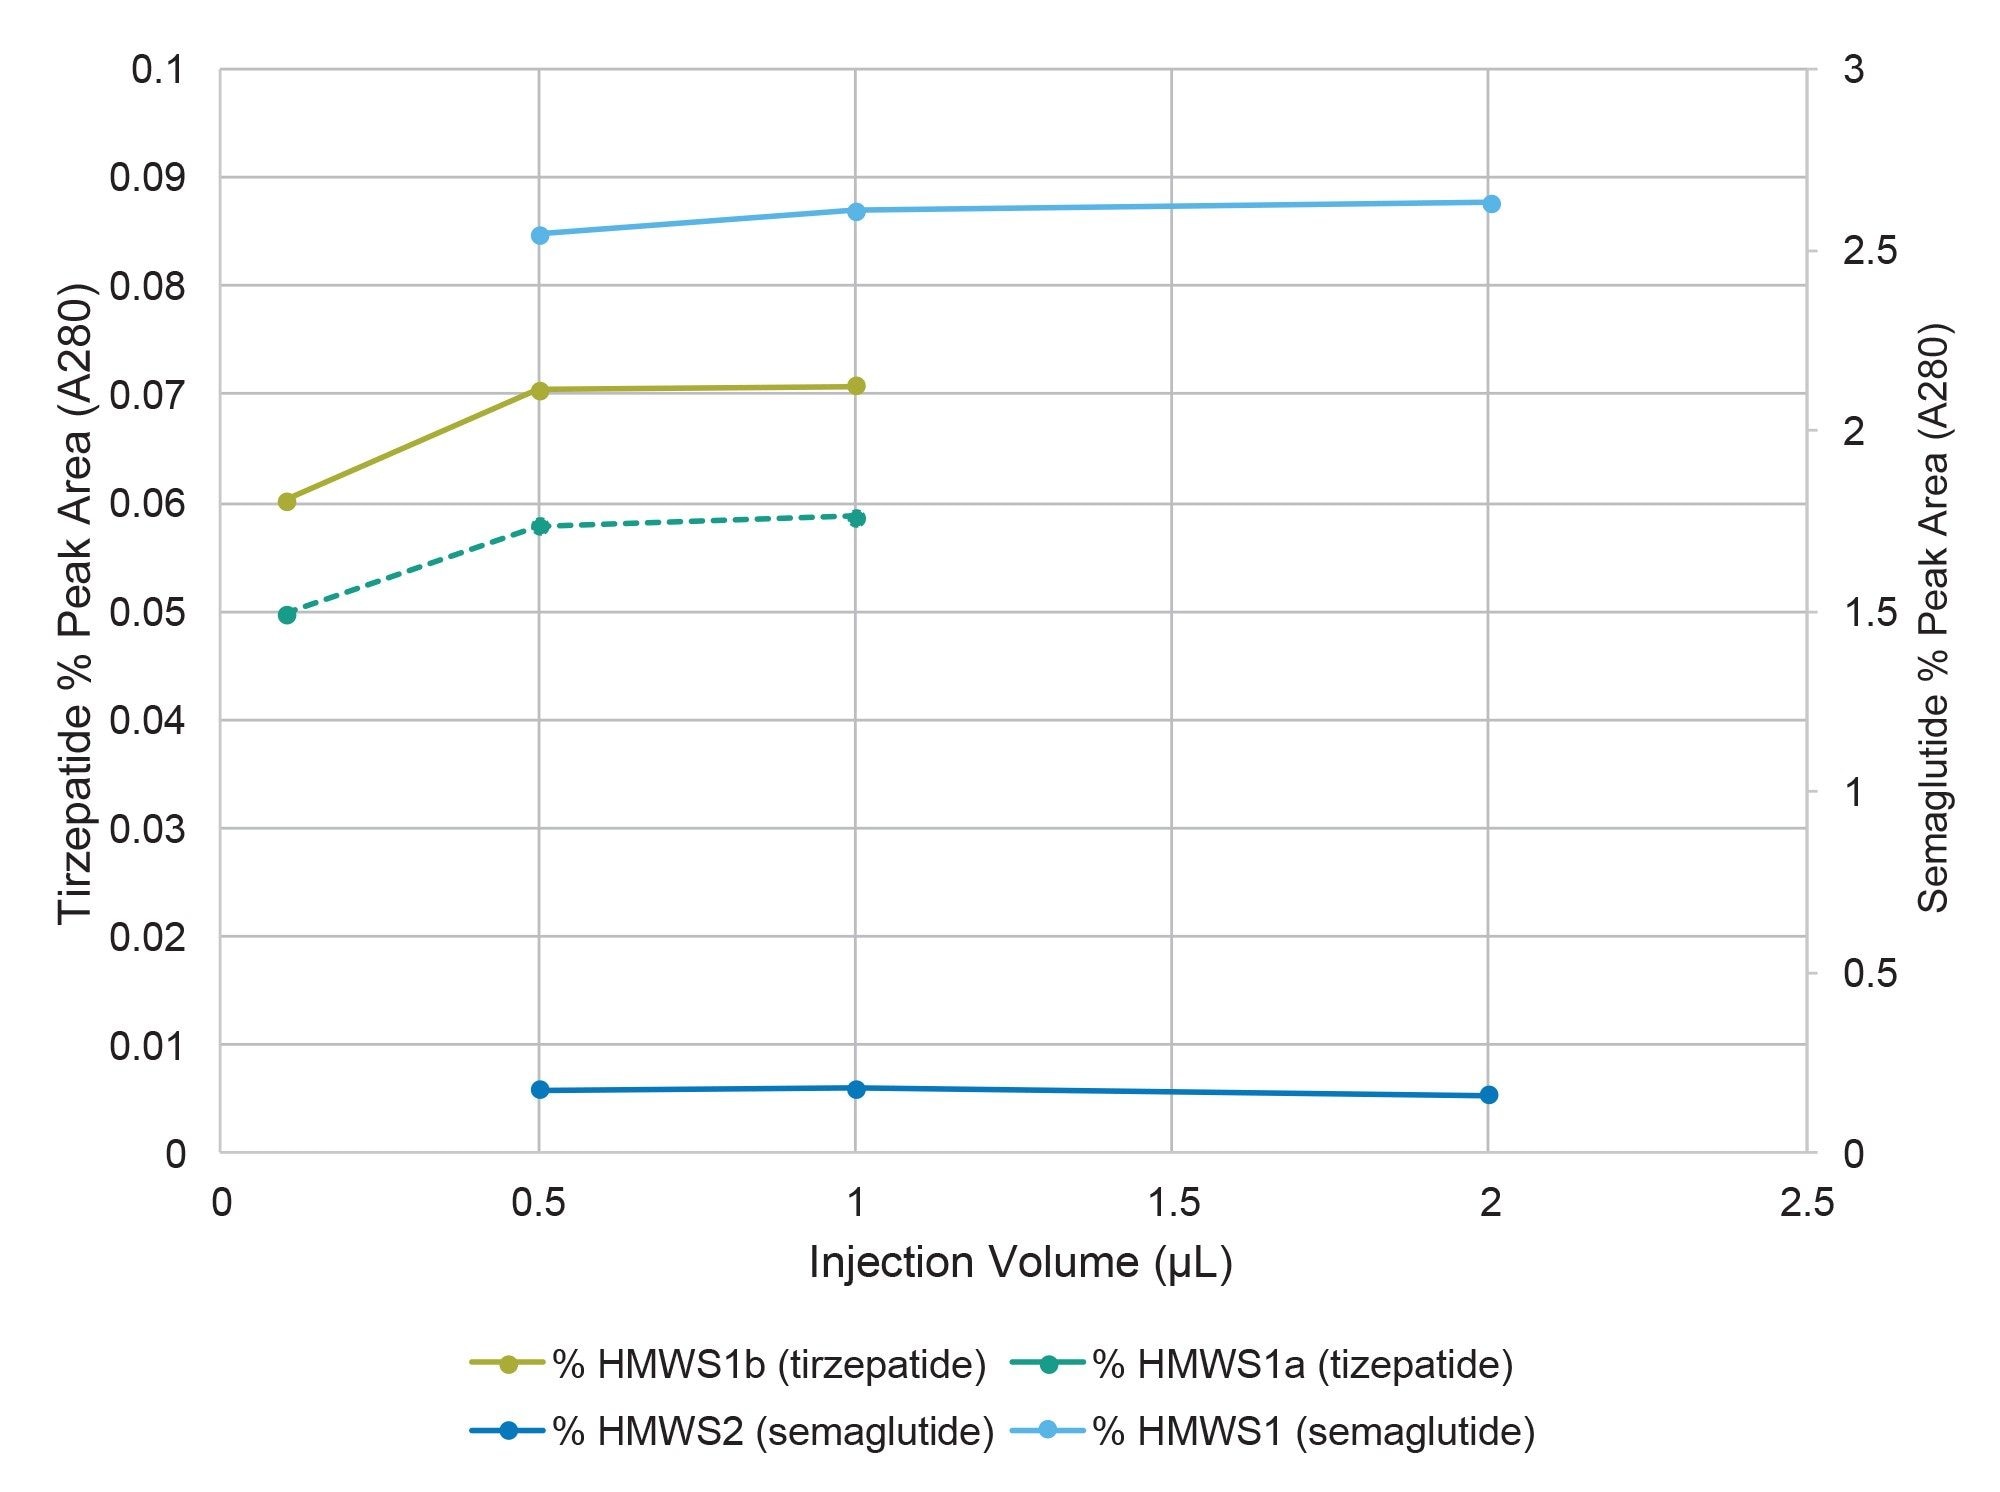
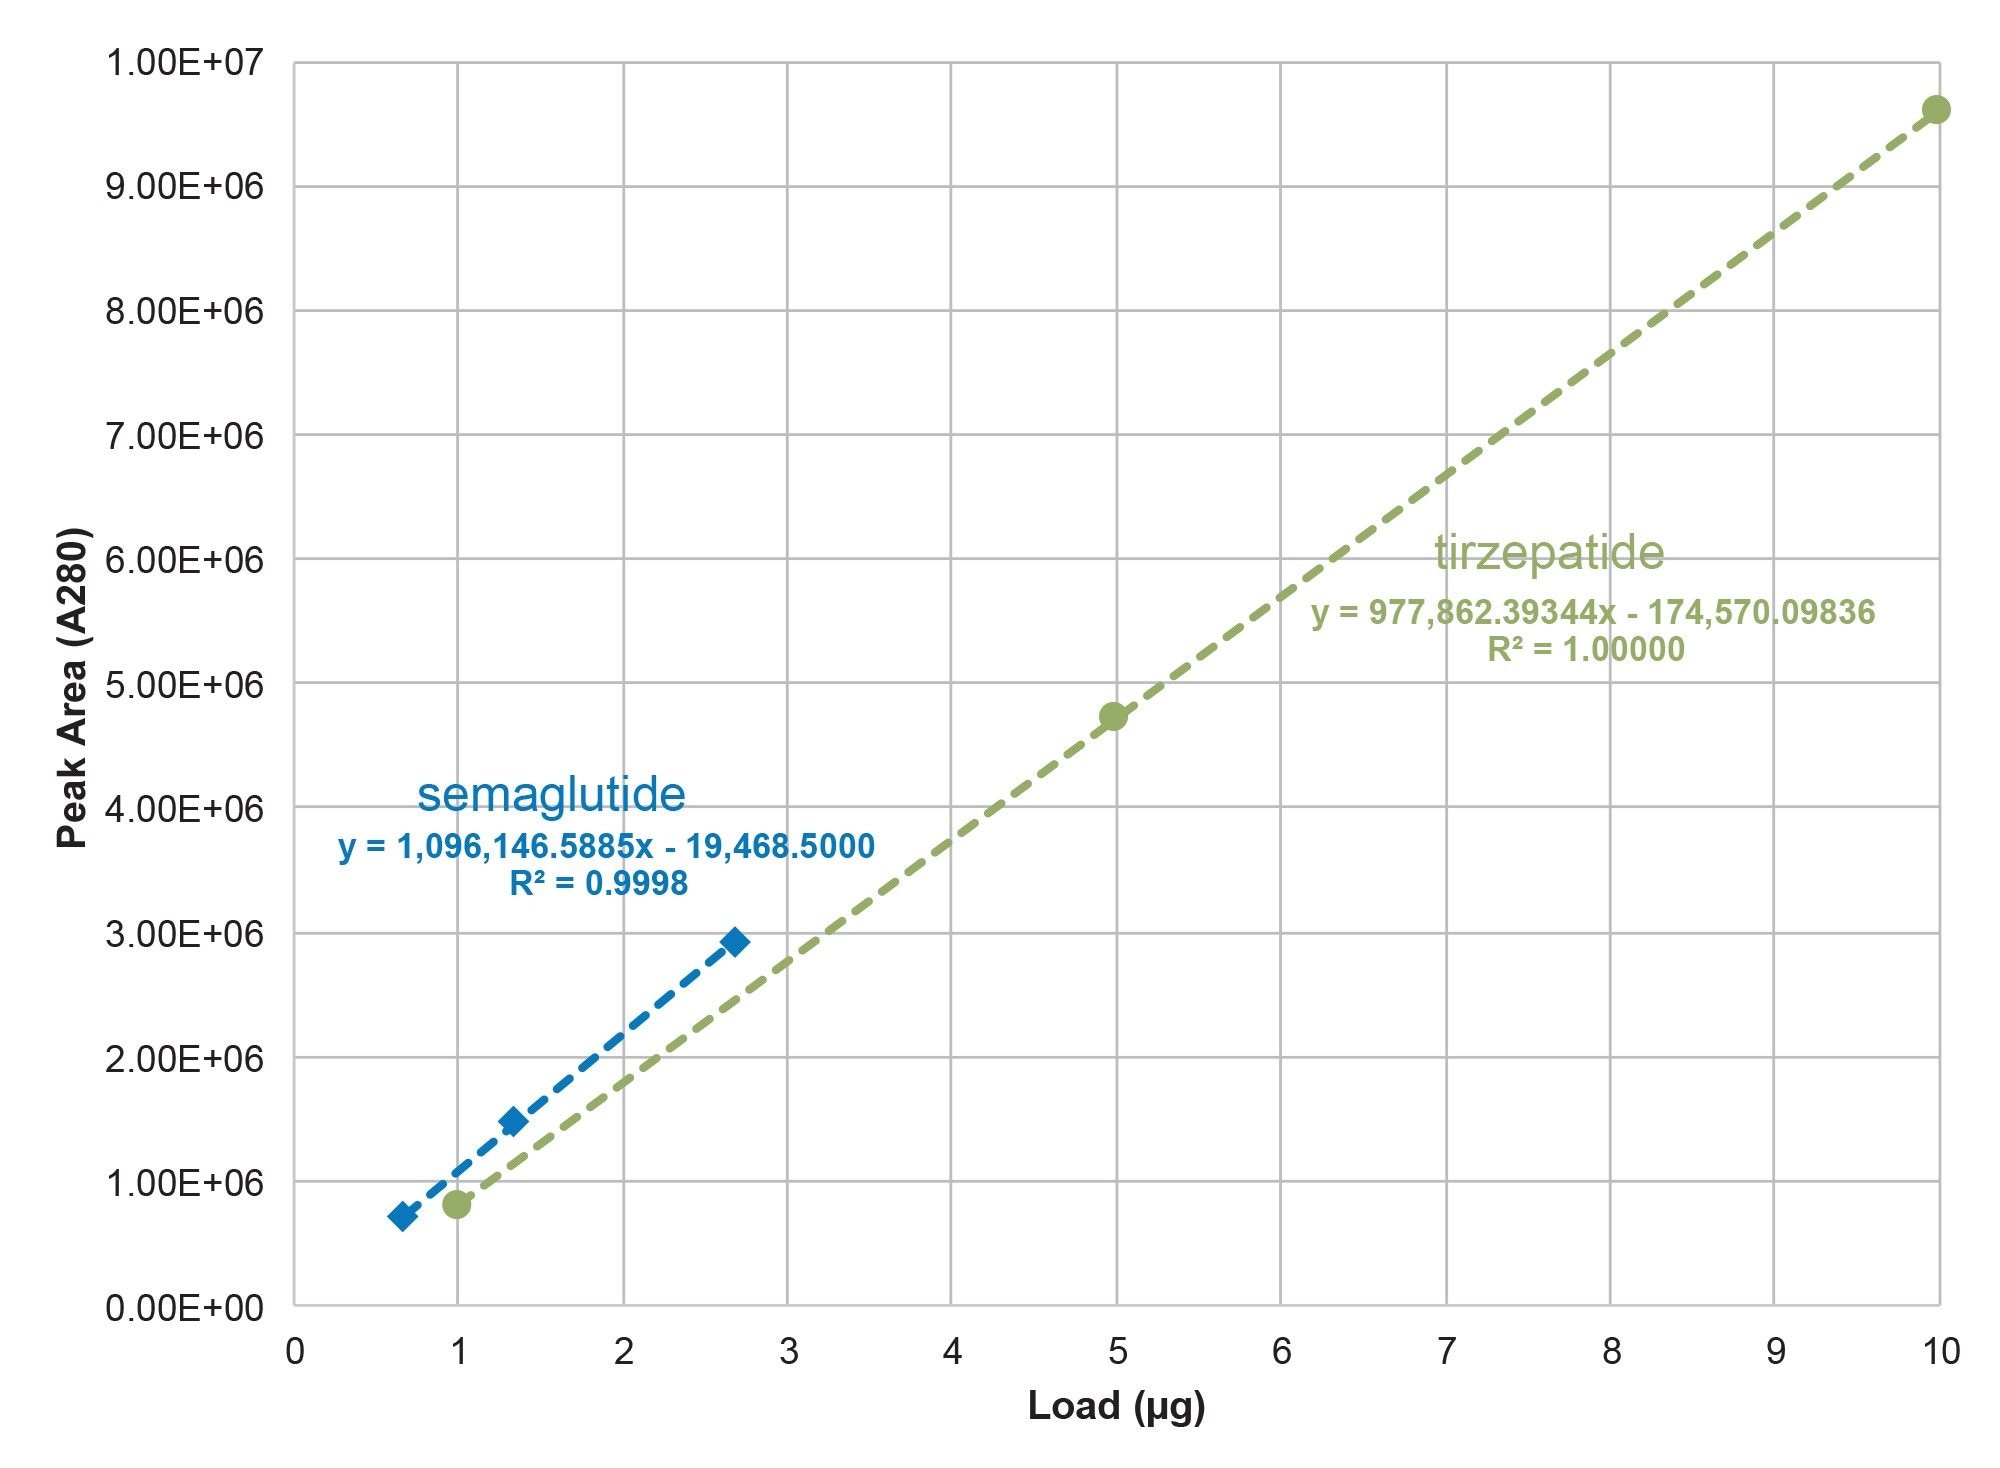
In addition to generating HRMS and relative abundance A280 data for non-dissociable HMWS in semaglutide and tirzepatide formulations, the linearity of the monomer A280 response was also cursorily evaluated. The response curves presented in Figure 4 indicate linear responses for semaglutide and tirzepatide monomer, which may be of utility if sample components preclude the direct use of UV absorbance for concentration determination.
Conclusion
This study demonstrated the quality of dSEC-HRMS data that can be generated for the GLP1-a lipopeptides semaglutide and tirzepatide when using an ACQUITY Premier SEC 125 Å, 1.7 µm 4.6 x 150 mm Column along with a Xevo G3 Q-ToF Mass Spectrometer with an ESI source. Both HRMS mass assignments and UV-based (A280) quantitation for low abundance, non-dissociable HMWS (0.06% dimer and 0.17% trimer) were achieved. In addition, A280 optical detection could also be used to determine the concentration of lipopeptide in samples.
References
- X. Zhang, S. Kenrick, and M. Chen, Identification of GLP-1 analog oligomeric states using SEC-MALS, 2025 Waters Application AN1901 AN1901: Identification of GLP-1 analog oligomeric states using SEC-MALS - Waters | Wyatt Technology
- Nugrahadi PP, Hinrichs WL, Frijlink HW, Schöneich C, Avanti C. Designing Formulation Strategies for Enhanced Stability of Therapeutic Peptides in Aqueous Solutions: A Review. Pharmaceutics. 2023 Mar 14;15(3):935.
- Engelund, D.K., Jensen, S.S. and Lundqvist, J., Novo Nordisk AS, 2021. Stable Semaglutide Compositions and Uses Thereof. U.S. Patent Application 17/288,128.
- P. Wuthrich, S. M. Koza, and S. Shiner, Advancing Analysis of Covalent High Molecular Weight Insulin With ACQUITY™ Premier SEC 125 Å Columns, 2025, Waters Application Note. 720008660.
- Bellmaine S, Schnellbaecher A, Zimmer A. Reactivity and Degradation Products of Tryptophan in Solution and Proteins. Free Radical Biology and Medicine. 2020 Nov 20;160:696-718.
720009256, February 2026