Residual Dynabeads Detection with Aura+
Waters Corporation, United States
Published on November 06, 2025
Introduction
Autologous cell therapies have seen explosive growth as evidenced by the recent landmark FDA approvals of two CAR-T cell therapies, Yescarta® and Kymriah®. 1 Dynabeads™ are commonly used in cell therapy manufacturing process to expand and activate CAR-T cells.2 CD3/CD28 Dynabeads specifically are one of the leading approved GMP expression beads for T cell therapies and are key to achieving the potency required of these novel medicines. Dynabeads are also efficiently removed from the final product to ensure final purity. However, residual CD3/CD28 beads present a significant risk patients’ safety and therefore are generally kept below a widely accepted but not yet regulatory controlled limit of 100 residual beads per 3,000,000 cells.3–4
Residual bead analysis is currently performed with manual hemocytometry that uses light microscopy and manual counting. However, manual hemocytometry is prone to human error, which leads to significant bead undercounting because it is incredibly difficult to find and differentiate between Dynabeads and cells in a sample, making residual bead counting one of the most challenging cell therapy lot release assays. Other traditional cell and subvisible analysis tools, including flow cytometers, also undercount beads and cannot differentiate residual Dynabeads from cells and other subvisible particles.
In this technical note, we show step-by-step how Aura CL and Aura+ enable fast, accurate, sensitive, and specific residual Dynabead detection in a concentrated cell therapy product. Powered by backgrounded membrane imaging (BMI) to characterize the entire cell therapy particle population and side illumination membrane imaging (SIMI) to specifically detect Dynabeads, Aura® CL and Aura®+ are the first and only tailored solutions to find and count these hard to detect contaminants.
Experimental
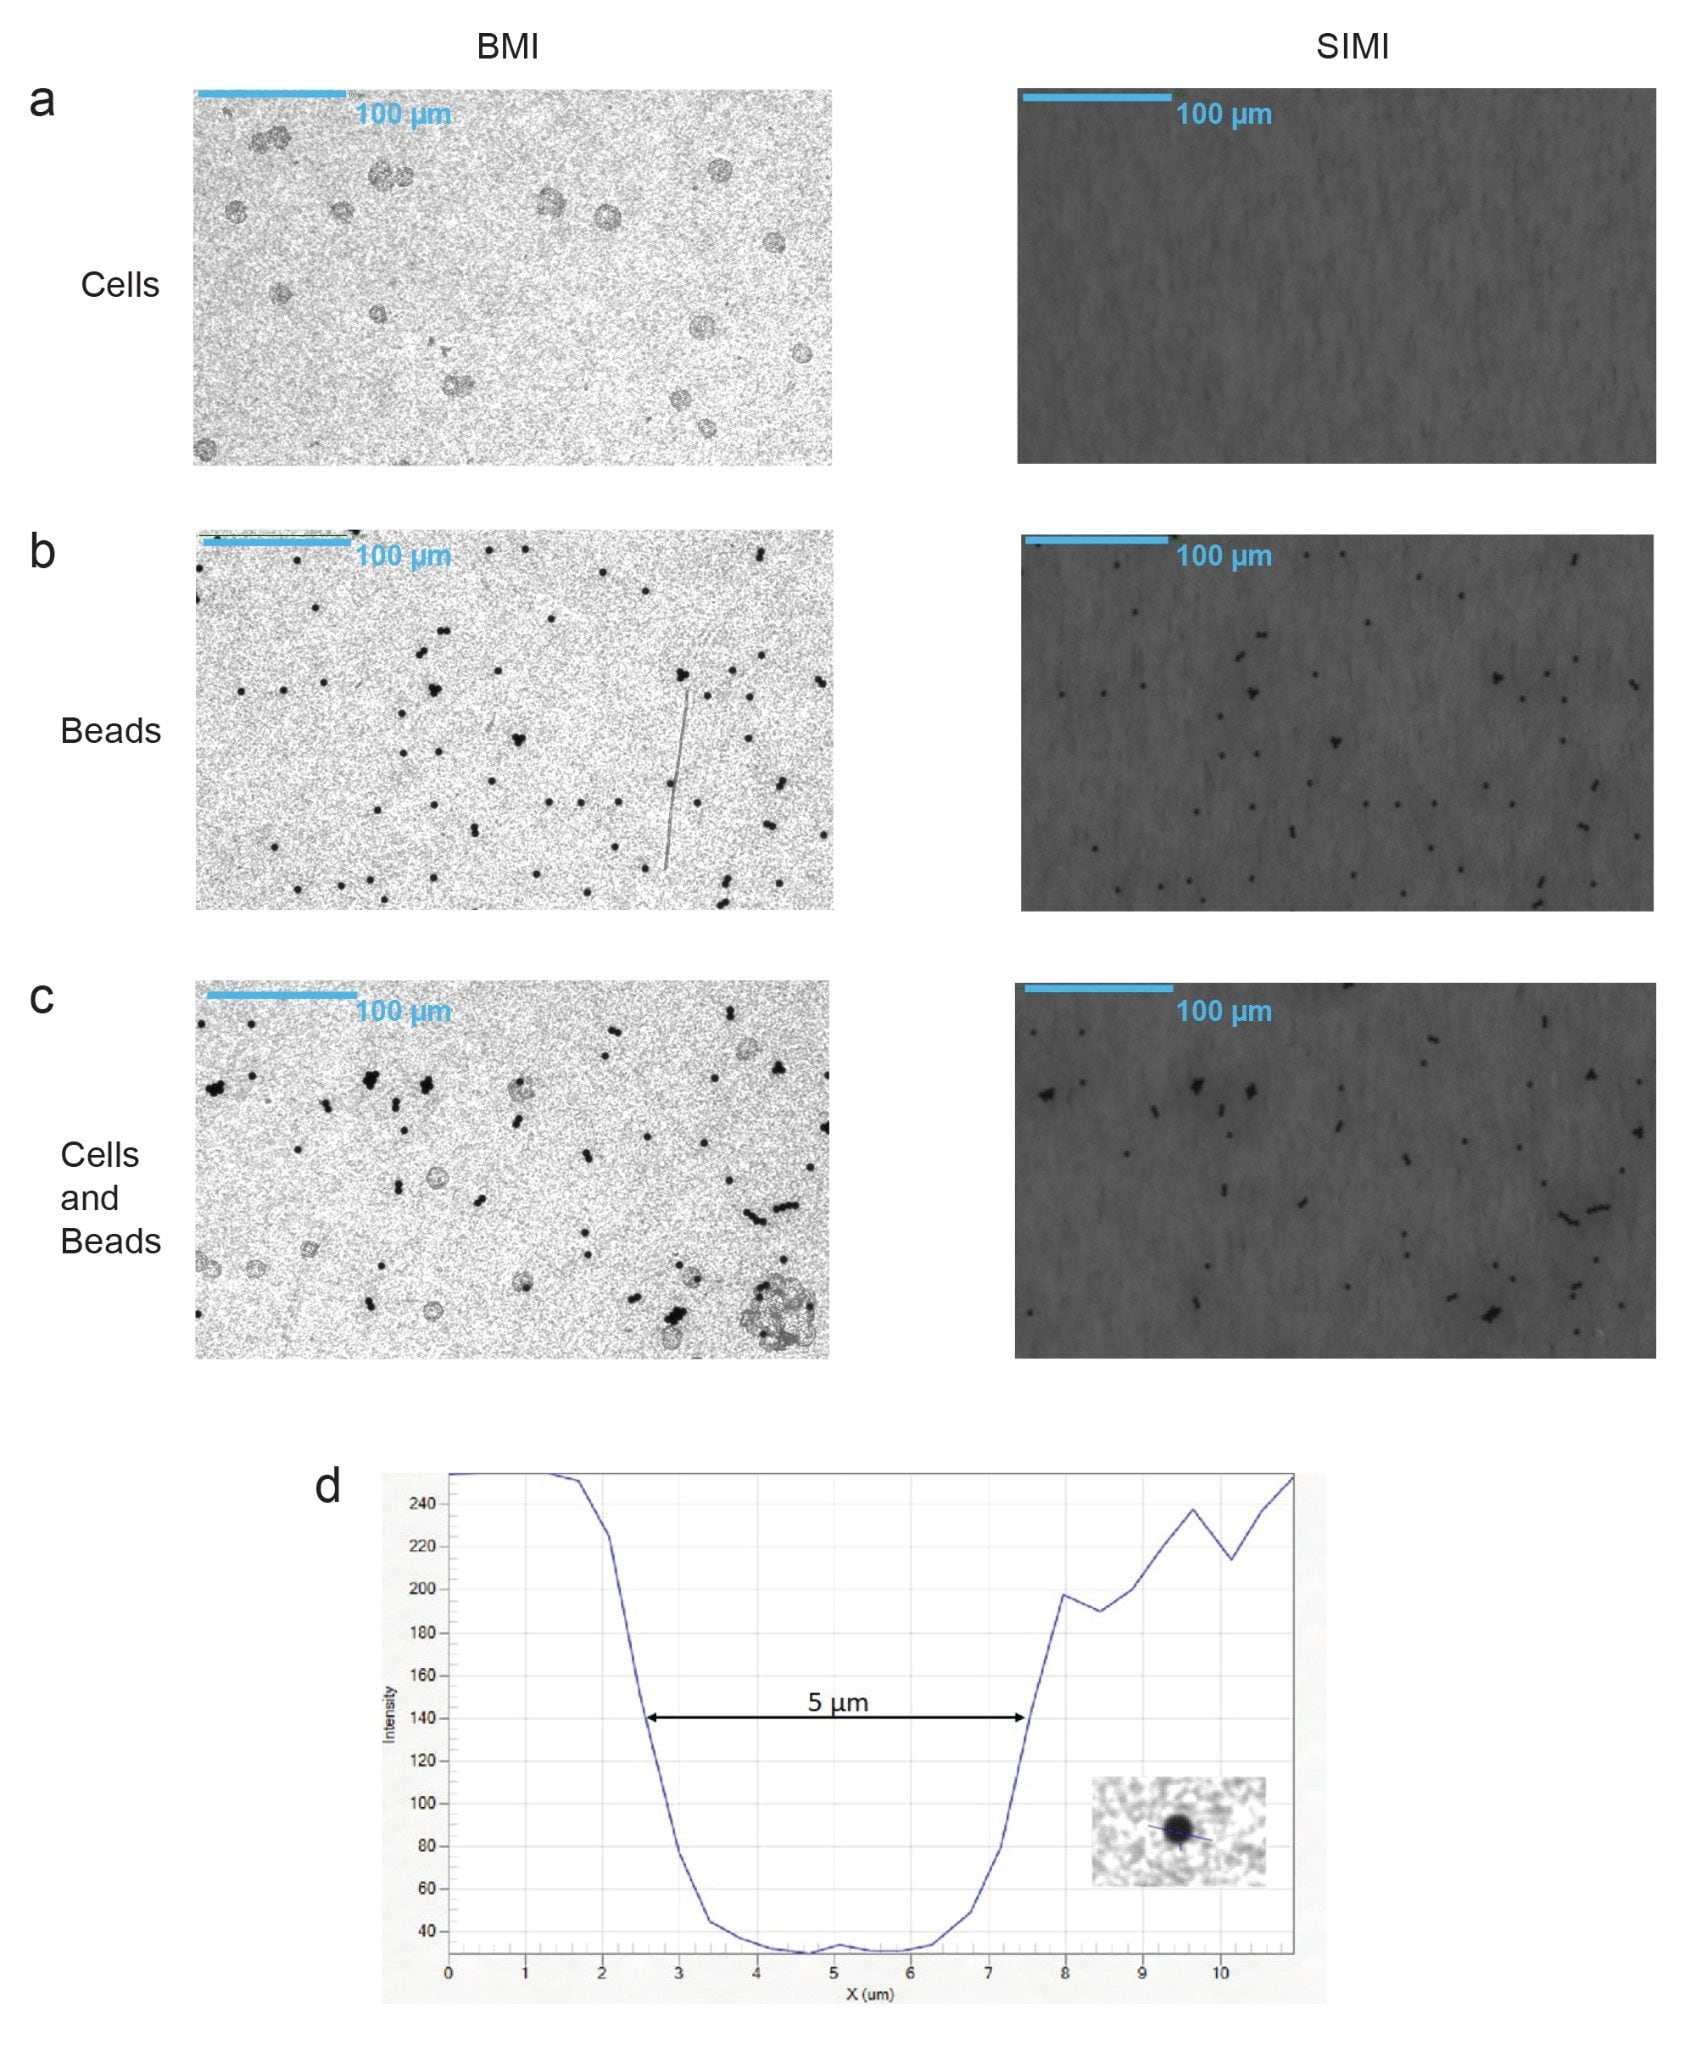
Mouse lymphoma T cells (ATCC, CRL-2396) at a density of 100,000 cells/mL and serial dilutions of Dynabeads Human T-Activator CD3/CD28 (Thermo Fisher, 11161D) were loaded onto 8 wells of a white membrane plate that was then imaged using BMI and SIMI in the standard 4x acquisition mode. Positive (beads only) and negative (cells only) controls were included to characterize the upper and lower limits of quantitation. Orthogonal 10x magnification from an Aura CL was conducted to verify the presence of Dynabeads in the well based on size. The SIMI images, which reveal the Dynabeads and remove the cell background, are shown below in Figures 2 and 3
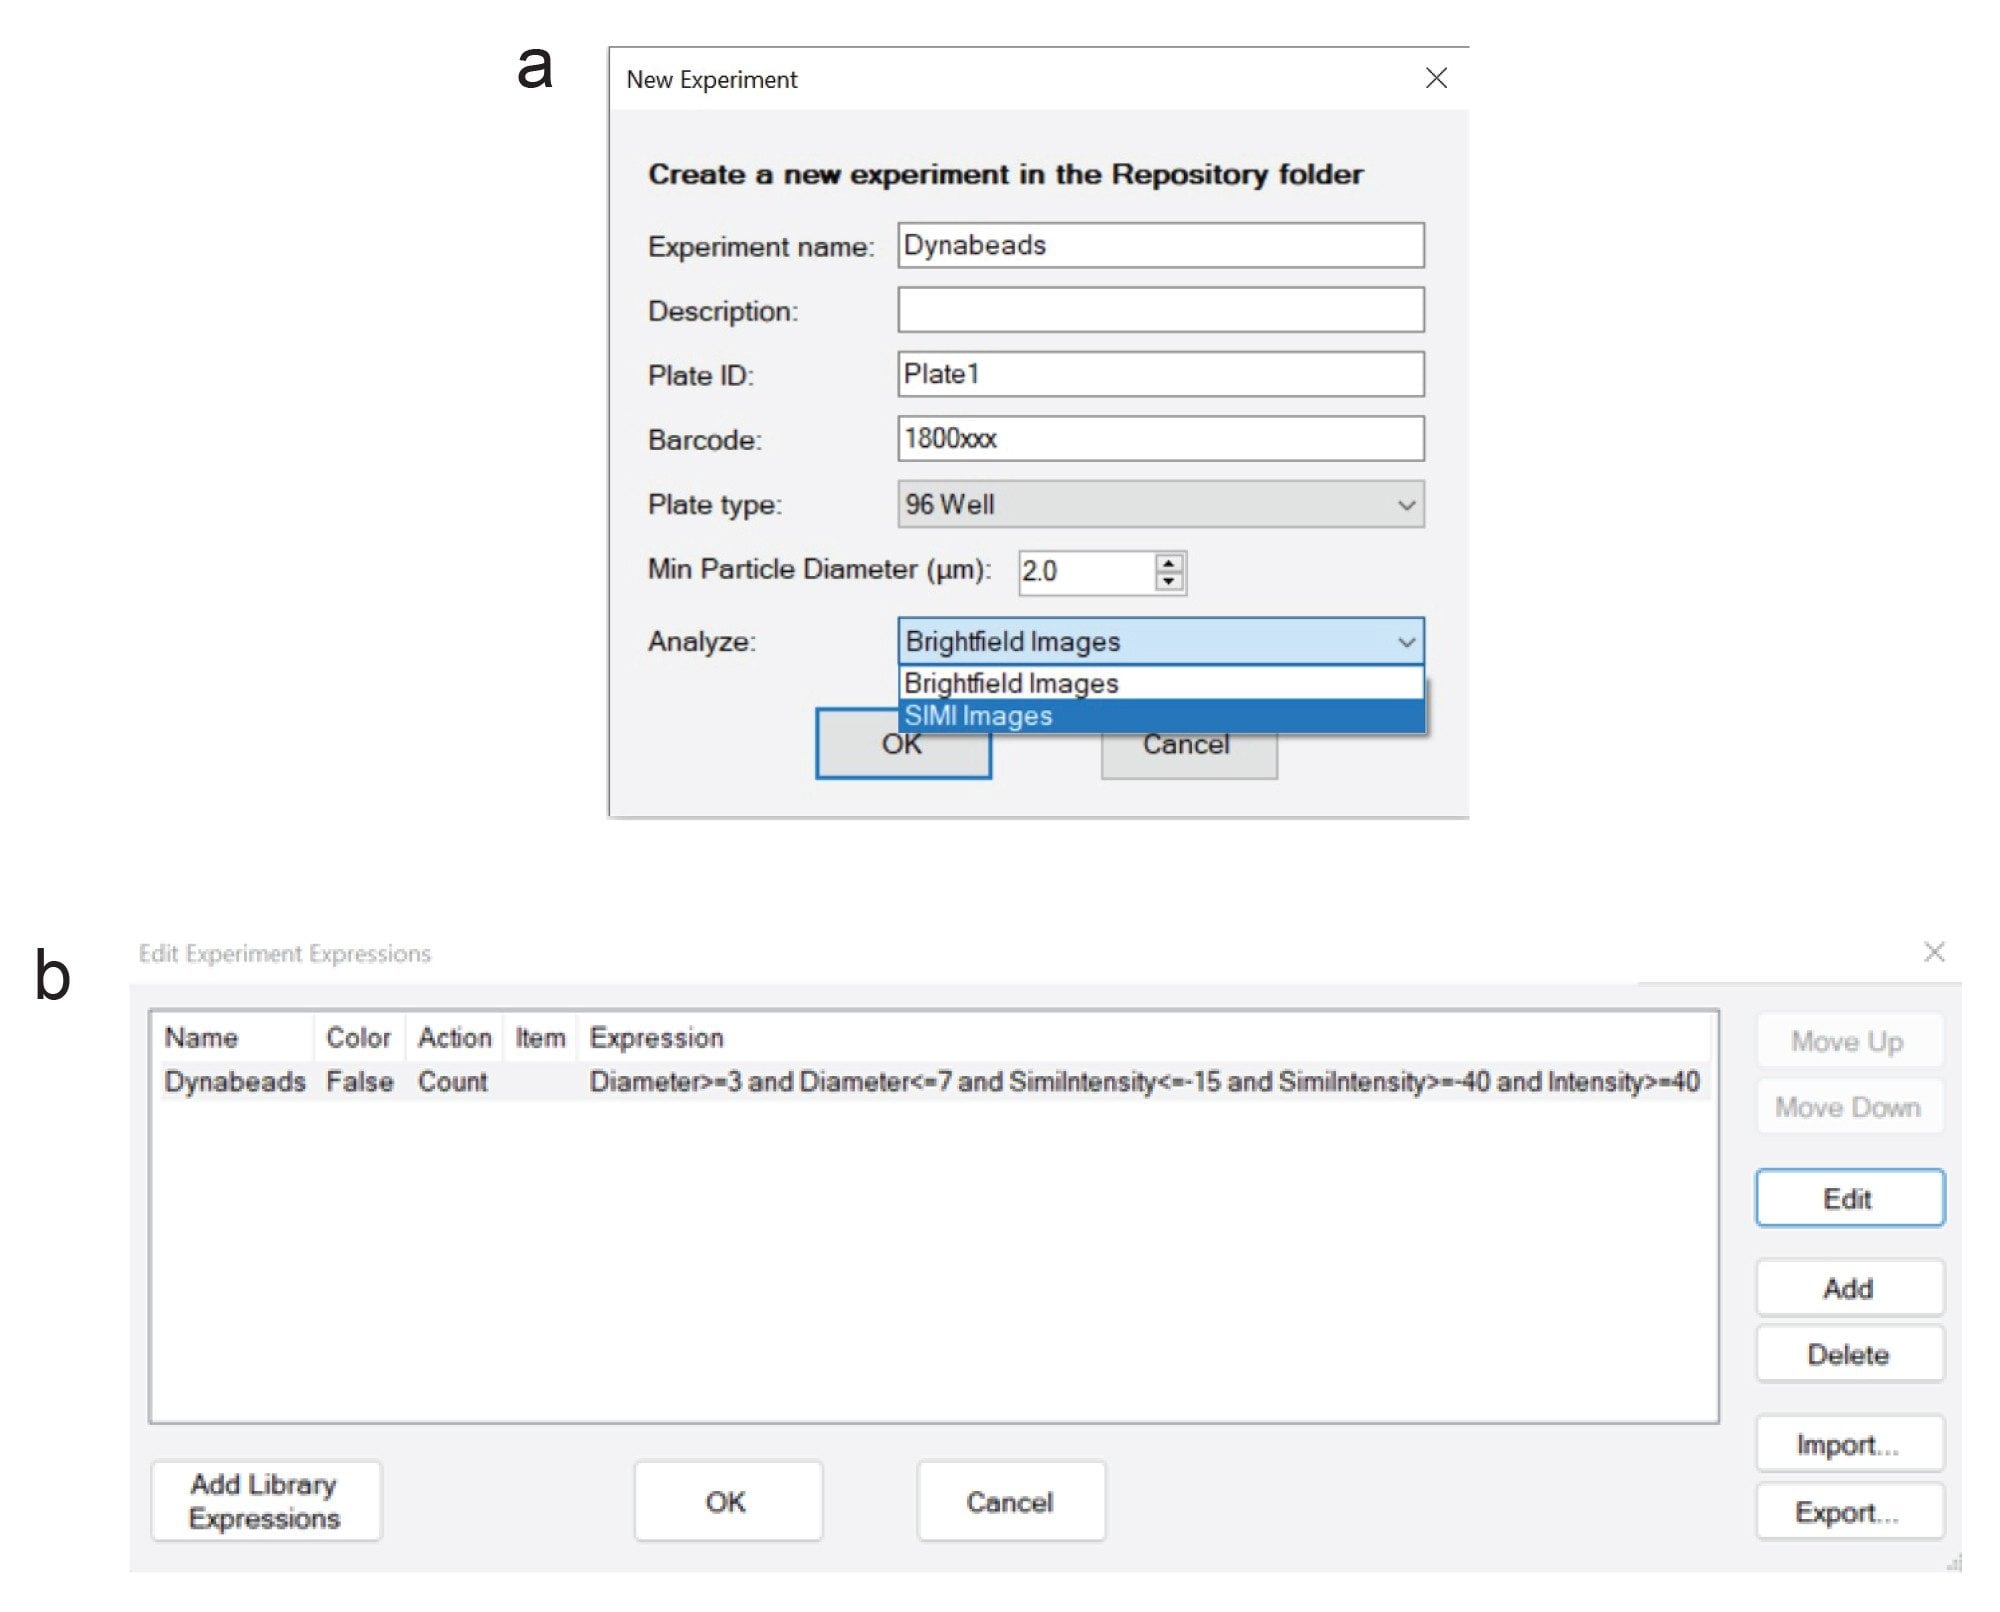
The Waters particle detection algorithm was applied to the SIMI images to quantify the residual Dynabeads. Acquisition was conducted in Particle Vue Software v4.2.0.71 using the ratio/double threshold algorithm for sensitive detection and characterization of residual Dynabeads as shown in Figure 1a. To specifically detect single Dynabeads but not cells, we used the following expression in the Particle Vue Expression Engine as shown in Figure 1b: Diameter≥3 and Diameter≤7 and SIMIIntensity≤(–15) and SIMIIntensity≥(–40) and Intensity≥40 This expression is explained in detail in the Advanced Method Development section (Appendix).
Results and Discussion
Distinguishing Dynabeads from Cells
Figure 2 illustrates the identification of cells and Dynabeads in the sample using BMI and SIMI in the standard 4x magnification. Both cells (Figure 2a, left), Dynabeads, (Figure 2b, left) and a mixed sample (Figure 2c, left) have enough contrast to be detected in using BMI. However, Dynabeads exhibit a much different SIMI scattering intensity compared to cells. Dynabeads are metallic, display remarkably high contrast, and also absorb the side illuminated (SIMI) light. This creates a dark SIMI image for the Dynabeads (Figure 2b, right and Figure 2c, right), while this same SIMI light simply passes through the relatively flat, low refractive index of cells. Thus, cells are invisible in SIMI mode (Figure 2a, right).
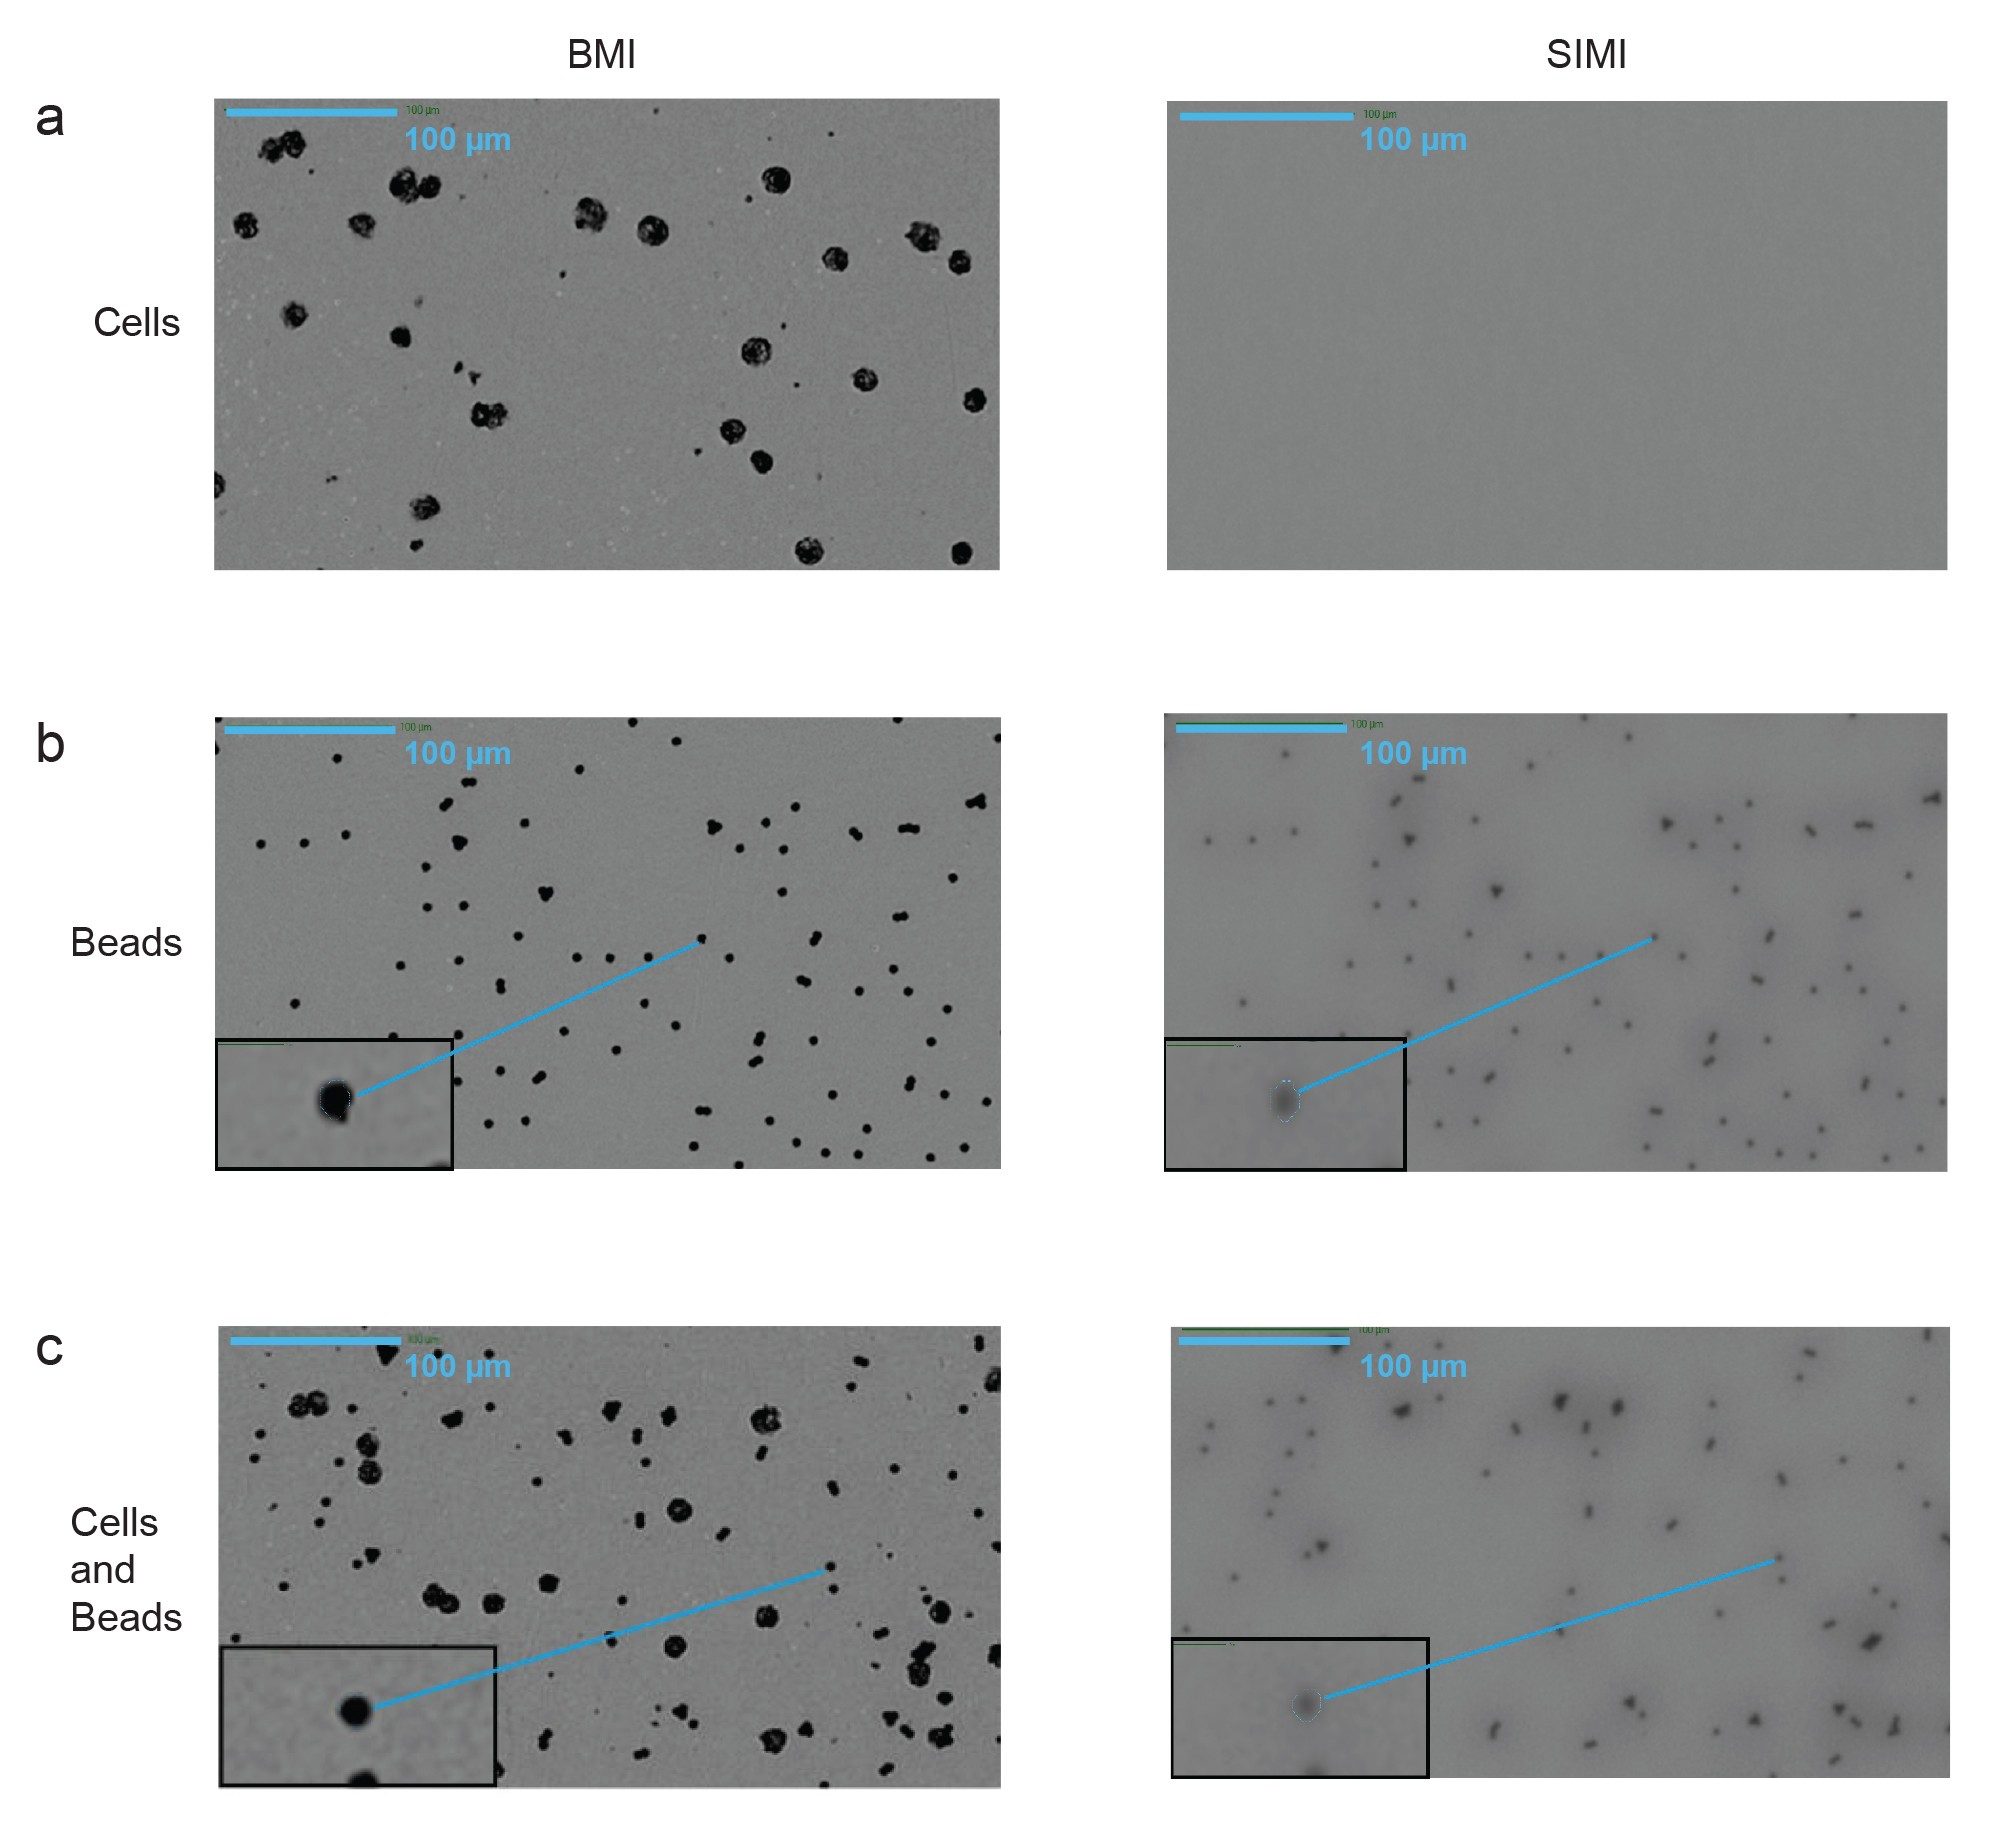
In fact, SIMI analysis detected Dynabeads that were engulfed within cells, as observed in Figures 2c. The presence of Dynabeads in the control and mixed samples were further confirmed using a 10x objective (Figures 3a–c), that comes with Aura CL. Like its 4x counterpart, SIMI light is barely scattered from cells, while it is absorbed by the metallic beads. Furthermore, bead size confirmation was possible using high magnification using the line profile feature that measures the full width at half-max (FWHM). This calculation confirmed that the single beads were 5 µm, which is within 10% of the GMP bead specified size.
Determining Dynabead Assay Limit of Quantitation (LOQ)
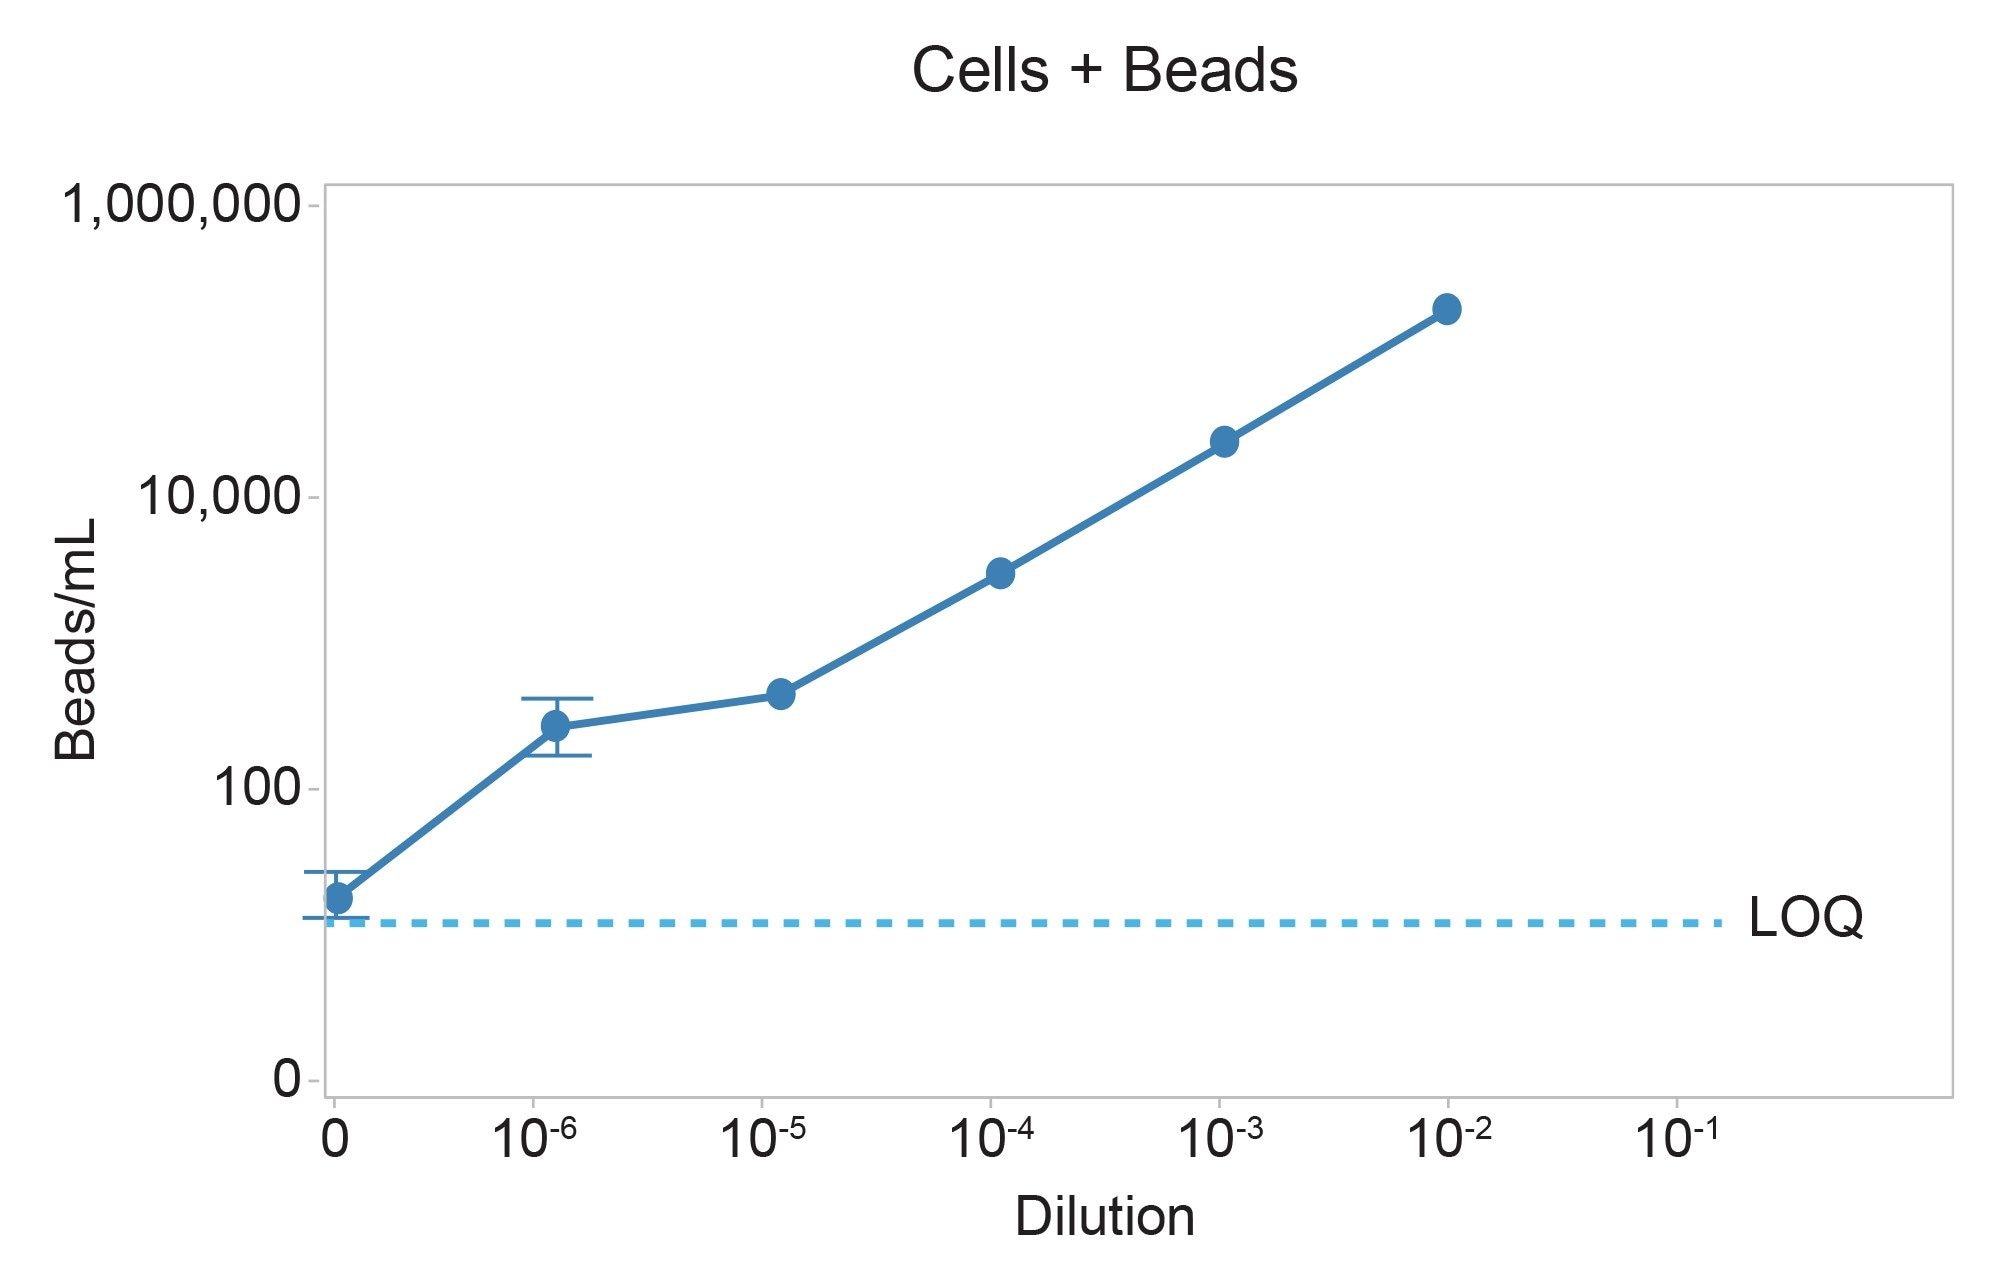
We then calculated the limit of quantification (LOQ) of Dynabeads in concentrated T cell samples using serial dilutions as shown in Figure 4. This data processed the resulting well images in SIMI mode and with the “Expression” shown in Figure 1b. Dynabead concentrations started at 100-fold dilution from the stock and were diluted down to 10–6, with each dot in Figure 4 corresponding to the average Dynabead counts averaged over 8 wells. The limit of quantitation was 18 Dynabeads/mL, indicating less than one false positive per well on average across the entire experiment.
Conclusion
Analysis of the cell therapy sample on Aura CL or Aura+ begins with the BMI well image, where sharp contrast, high resolution optics provide the landscape to count and size all the particles in your cell therapy product. SIMI imaging, which is run at the same time as BMI, enables the differentiation of biologic vs. non-biologic particles which is essential to this application. Figures 2 and 3 capture how BMI detects all particles present in a cell therapy sample, while SIMI mode selects for particles of higher refractive index contrast. In BMI mode, cells, Dynabeads, and mixtures of the two were all easily visible. However, in SIMI mode, only the residual Dynabeads were detected both in the standard high-throughput 4x mode and in the 10x high magnification mode. This is essential for specific detection of residual Dynabeads given their low abundance in a highly concentrated cell sample as shown in Figure 4. We determined that the limit of quantitation (LOQ) of Dynabeads is <1 bead/well (or 18 beads/mL of sample), well below the hemacytometer residual bead detection rate of 1 bead per 10,000 cells. Additionally, the bead counts in our dilution series exhibited a linear relationship, measuring an R2 of 0.98. Using Aura CL or Aura+ for residual Dynabead detection provides greater accuracy and higher-throughput in counting compared to the cumbersome and error prone currently used methods. Resolving false positive counts can be easily rectified by measuring the particles at higher magnification, where single Dynabeads identity can be confirmed by size. Aura CL and Aura+ deliver the only automated way of measuring single Dynabeads in concentrated cell therapy solutions, while also offering built in orthogonal confirmation through various objectives and light sources.
References
- Han D, et al. (2021). Current Progress in CAR-T Cell Therapy for Hematological Malignancies. Journal of Cancer. 12(2), 326–334
- Highfill SL and Stroncek DF. (2019). Overcoming Challenges in Process Development of Cellular Therapies. Current Hematologic Malignancy Reports. 14:269–277
- Clarke D, et al. (2016). Managing Particulates In Cell Therapy: Guidance for Best Practice. Cytotherapy. 18(9):1063–76
- Hollyman D, et al. (2009). Manufacturing Validation of Biologically Functional T Cells Targeted to CD19 Antigen for Autologous Adoptive Cell Therapy. J Immunother. 32(2):169–80
Appendix
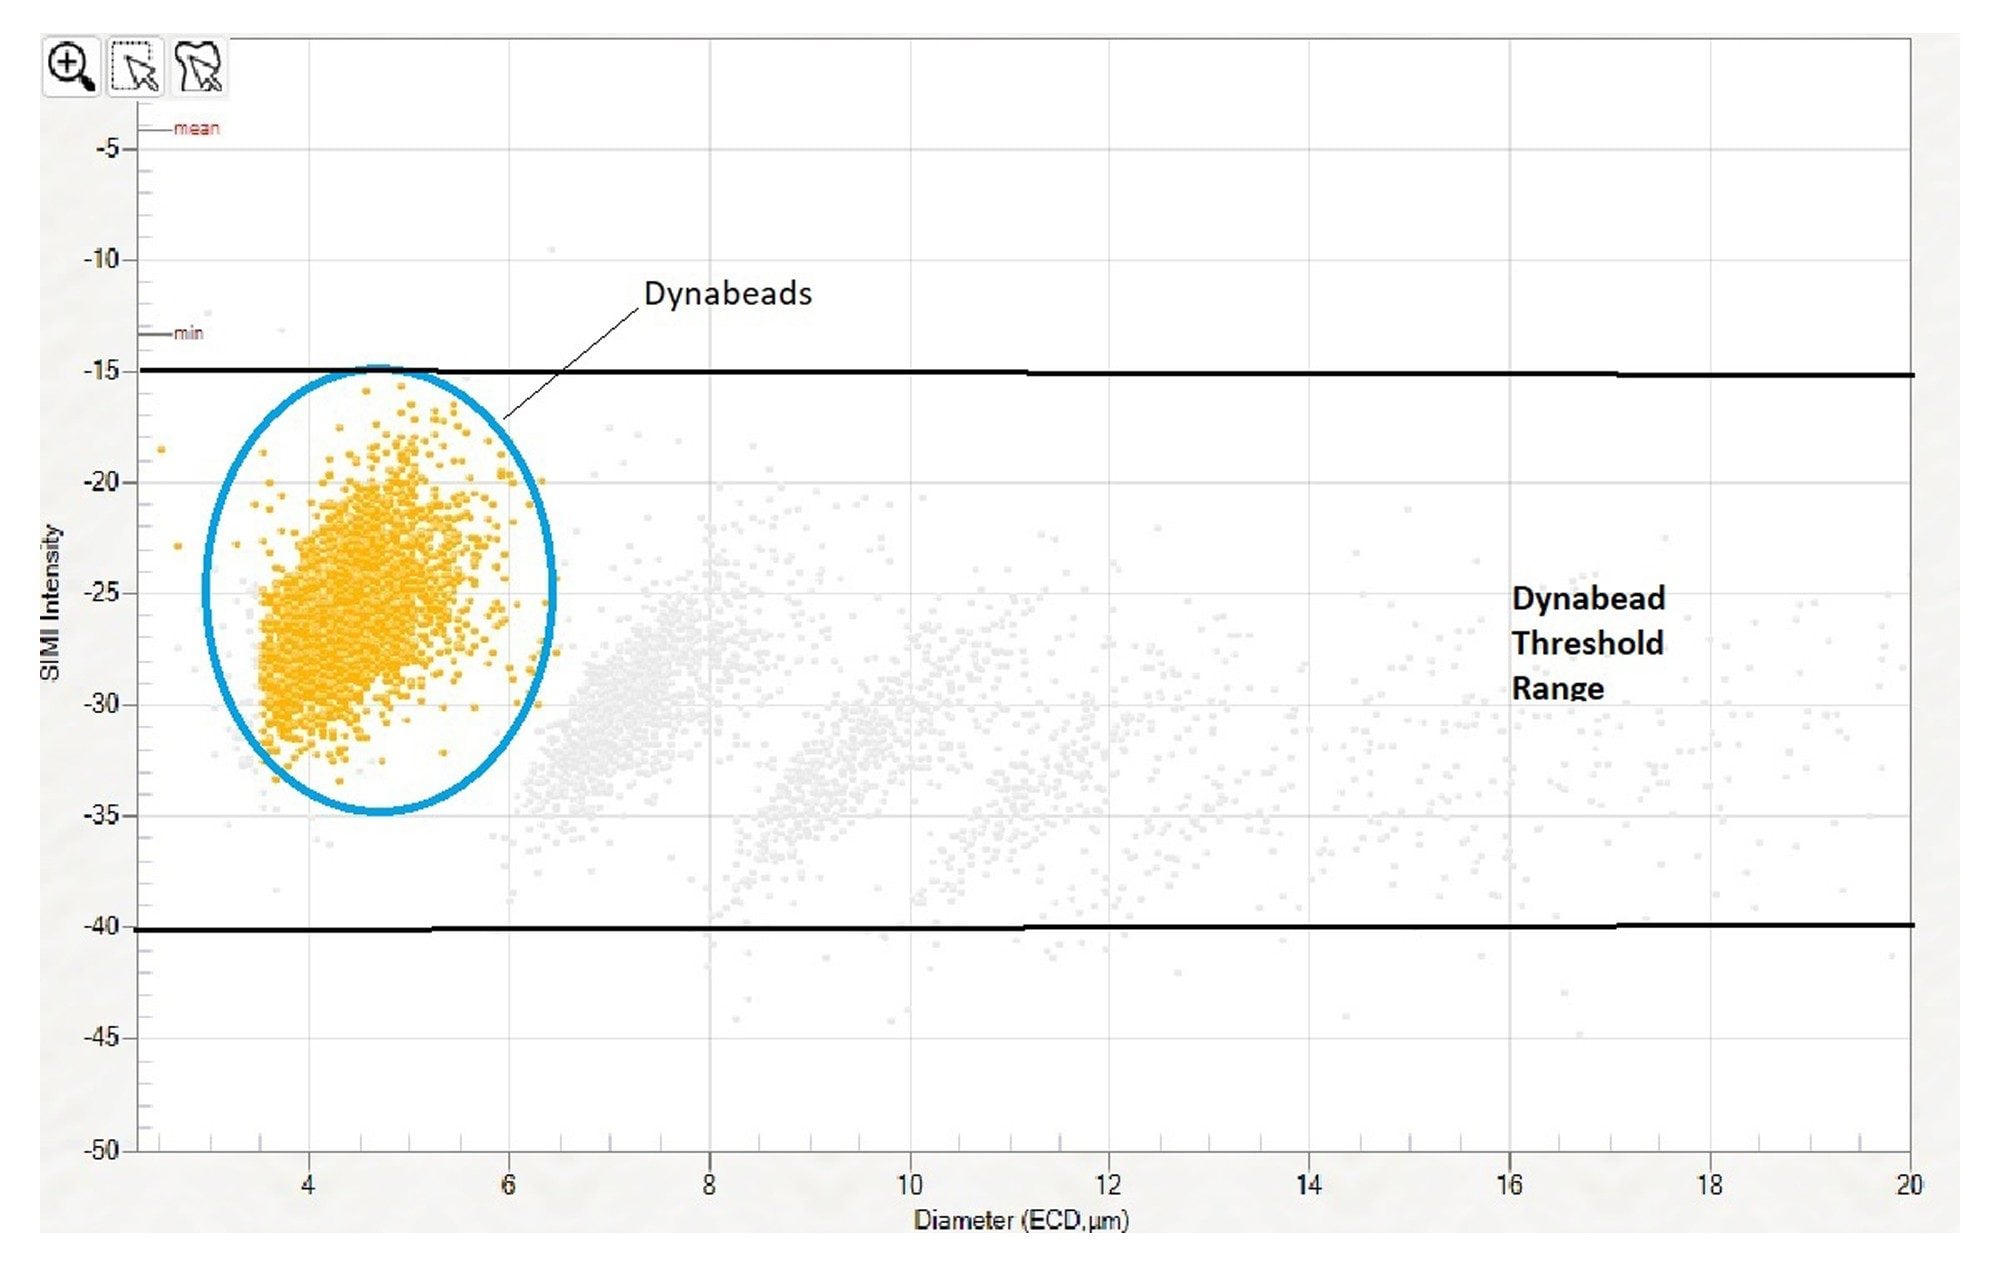
A single population of Dynabeads can be identified using the scatterplot to plot particle diameter (ECD) against SIMI intensity, as shown in Figure 5. To create an expression to count Dynabeads, create a new expression in Particle Vue software by selecting Edit Experiment Expressions in the “Experiment” drop down menu. Our default Dynabead expression method is: Diameter≥3 and Diameter≤7 and SIMI Intensity≤(–15) and SIMIIntensity≥(–40) and Intensity≥40 To confirm the SIMI intensity range setting, plot SIMI intensity vs particle diameter (ECD) using the scatter plot, as shown below in Figure 5 (“Dynabead” group in yellow). Negative Dynabead SIMI values may vary slightly depending on the cell populations they are combined with, so it is best to confirm the appropriate SIMI and diameter settings for the Expression Engine by first verifying the data in this scatter plot SIMI vs. Diameter Scatter plot.
Featured Products
720009096, October 2025