Isolation of a Degradation Product of Ranitidine Hydrochloride Using the Waters Analytical Scale Purification System
Margaret Maziarz, Ronan Cleary, Darcy Shave, Stephanie Harden, Paul D. Rainville, Jinxia Xia
Waters Corporation, United States.
Published on May 08, 2025
Abstract
Isolation of unknown components for structural characterization and identification is an important aspect of pharmaceutical development. Fully understanding all components helps to optimize formulations, maintain consistent quality, and ensure the safety and efficacy of drug products. Work in this application note demonstrates the isolation of a degradation product of ranitidine hydrochloride (HCl) drug substance using the Waters Analytical Scale Purification System. The purification system configured with PDA and ACQUITY™ QDa™ II Detectors enabled UV- and mass-directed isolation of the degradation product formed during a forced degradation study under basic conditions. MassLynx™ Software with the FractionLynx™ Application Manager automated the fraction collection process, while tracking the location of collected peaks. The effectiveness of the isolation process was assessed through purity determination of the collected degradation product samples.
Benefits
- The Waters Analytical Scale Purification System facilitates effective isolation of the target compounds through UV- and/or mass-directed fraction collection.
- The increased pressure (up to 9500 psi) and temperature (up to 90 °C) of the system allows the use of sub-5–µm particle-size preparative columns, facilitating easy scaling from the analytical scale methods and delivering faster chromatography with improved resolution and sensitivity.
- Automated fraction collection is completed using FractionLynx Application Manager Software and tracking of the collected peaks.
Introduction
The presence of unidentified components, including impurities and degradation products, may compromise the quality and safety of pharmaceutical products, posing health risks.1–2 It is, therefore, imperative that these unknown components are correctly identified during the development of drug and pharmaceutical formulations to protect patient safety and product integrity.
Several approaches can be used to identify unknown components.3 The unknown can be identified by comparing the UV retention time and mass spectral data to a reference standard. If sufficient data is available to propose the structure, the unknown can be synthesized. If no reference standard is available and synthesis is not possible, isolation through fraction collection of the unknown peak for characterization and identification can be carried out using a purification system. Generally, the analysis begins with separation of the compounds using analytical chromatographic methods, followed by scale-up to preparative liquid chromatography to increase the yield for the collected samples. Following scale-up, the compound of interest is isolated and collected for further analysis.
This application note illustrates the use of a Waters Analytical Scale Purification System to isolate a degradation product formed during the forced degradation study of ranitidine drug substance and drug product. Ranitidine drug is a histamine-2 blocker, designed to treat gastroesophageal reflux disease (GERD) and other conditions in which acid backs up from the stomach into the esophagus, causing heartburn.4 Herein, the ranitidine drug substance and drug tablet formulation underwent a forced degradation with a 0.5 M sodium hydroxide solution, forming a degradation product with m/z 302. The degradation product was isolated using a Waters Analytical Scale Purification System integrated with a 3767 Sample Manager, PDA detector, and ACQUITY QDa II Mass Detector. To accommodate the use of a 3.5–µm preparative column, higher pressure pumps were utilized to help improve performance for smaller scale purification.
Experimental
Mass spectrometry-grade solvents and formic acid were purchased from Sigma-Aldrich. Ranitidine hydrochloride drug substance was purchased from Sigma-Aldrich. Prescription ranitidine drug tablet formulation was obtained from a local pharmacy.
Sample Description
Ranitidine Drug Substance and Tablet Samples
- Ranitidine drug substance sample solution was prepared in water at 1 mg/mL.
- Drug tablet formulations were prepared by dissolving crushed tablets in water at 1 mg/mL of ranitidine. Sample solutions were sonicated for 10 minutes, centrifuged for 15 minutes at 4000 rpm, and filtered using 0.2–µm PTFE syringe filters.
- Control test samples with drug substance and tablet formulation were prepared by diluting 1 mg/mL sample solution with water to the working concentration of 0.1 mg/mL.
Forced Degradation Study
Ranitidine drug substance and tablet sample solutions at 1 mg/mL were forced degraded with acid (0.5 M hydrochloric acid), base (0.5 M sodium hydroxide), and heat. Separate sample vials stressed with acid and base were stored at room temperature, while sample vials exposed to heat were placed in a 55 °C oven. All solutions were exposed to the stress conditions for 3, 6, and 24 hours. At each interval, acid and base degraded sample solutions were neutralized with equal volumes of equivalent concentration of base and acid. All sample solutions were diluted with water to the ranitidine working concentration of 0.1 mg/mL.
Analytical Method Conditions
|
LC system: |
Arc™ Premier System with Quaternary Solvent Manager (QSM-R) and Flow-through Needle (FTN-R) 2998 PDA and ACQUITY QDa II Detectors |
|
Vials: |
LCMS Maximum Recovery 2 mL (p/n: 600000749CV) |
|
Columns: |
XBridge™ Premier BEH™ C18, 4.6 mm ID x 50 mm, 3.5 µm (p/n: 186010658) |
|
Column temparature: |
30 °C |
|
Sample temparature: |
15 °C |
|
Injection volume: |
15.0 µL |
|
Mobile phase: |
A: Water with 0.1% formic acid B: Methanol with 0.1% formic acid |
|
Wash solvents: |
Purge/Sample Wash: Water/methanol 60:40 Seal Wash: Water/acetonitrile 90:10 |
|
UV detection: |
210–400 nm, derived at 235 nm, sampling rate: 10 pts/sec |
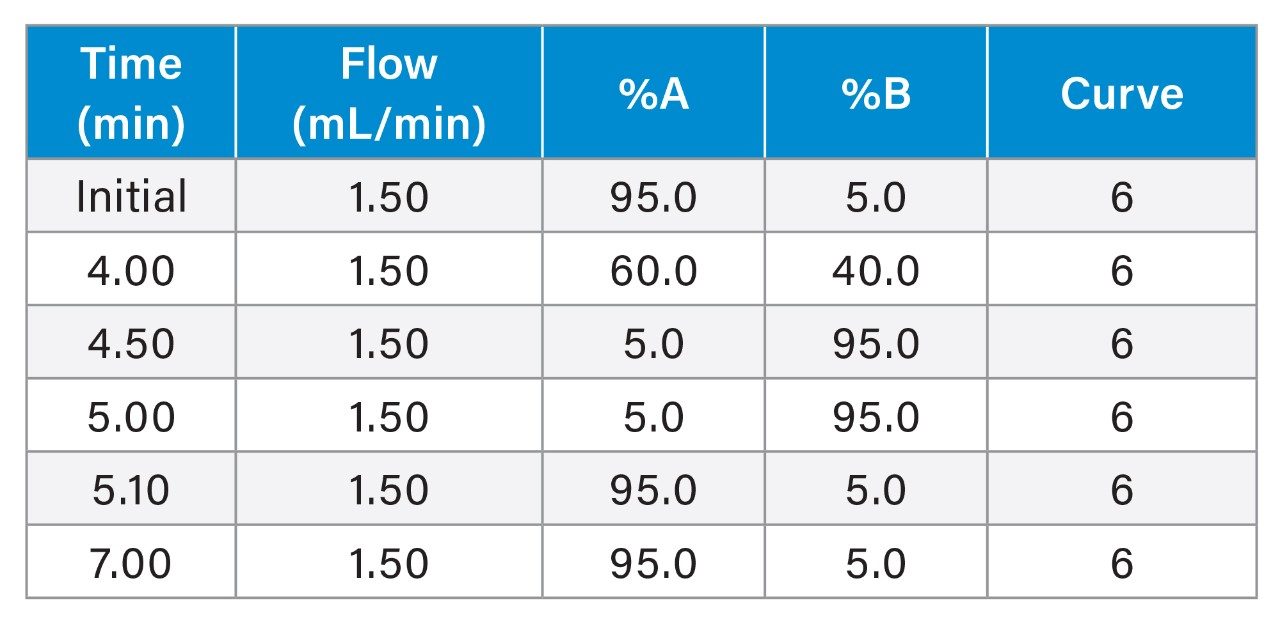
Gradient Table
MS Conditions
|
MS system: |
ACQUITY QDa II Mass Detector |
|
Ionization mode: |
ESI+ |
|
Acquisition range: |
50–350 m/z |
|
Capillary voltage: |
0.8 kV (+) |
|
Cone voltage: |
5 V |
|
Probe temparature: |
600 °C |
|
Data: |
Centroid |
Data Management
|
Chromatography data system (CDS): |
Empower™ 3.8.0 |
Preparative Method Conditions
|
System: |
Waters Analytical Scale Purification System5 composed of Two Arc HPLC Quaternary Solvent Manager (QSM-R) pumps 3767 Sample Manager Isocratic Solvent Manager (ISM) CM-30S Column Manager 2998 PDA and ACQUITY QDa II Detectors |
|
Vials: |
LCMS Maximum Recovery 2-mL volume (p/n: 600000670CV) |
|
Collection plates: |
Waters 2-mL square collection plate (p/n: 186002482) |
|
Columns: |
XBridge™ Premier Peptide BEH™ C18, 130Å, OBD™ Prep Column, 3.5 µm, 10 mm ID x 50 mm (p/n: 186011325) |
|
Column temparature: |
30 °C |
|
Sample manager wash solvent: |
Weak solvent: Water/acetonitrile 95:5 |
|
Strong solvent: Water/acetonitrile 5:95 |
|
|
Injection volume: |
71 µL |
|
Mobile phase: |
A: Water with 0.1% formic acid |
|
B: Methanol with 0.1% formic acid |
|
|
ISM makeup solvent: |
30:70 water/acetonitrile |
|
UV detection: |
210–400 nm, derived at 235 nm, sampling rate: 10 pts/sec |
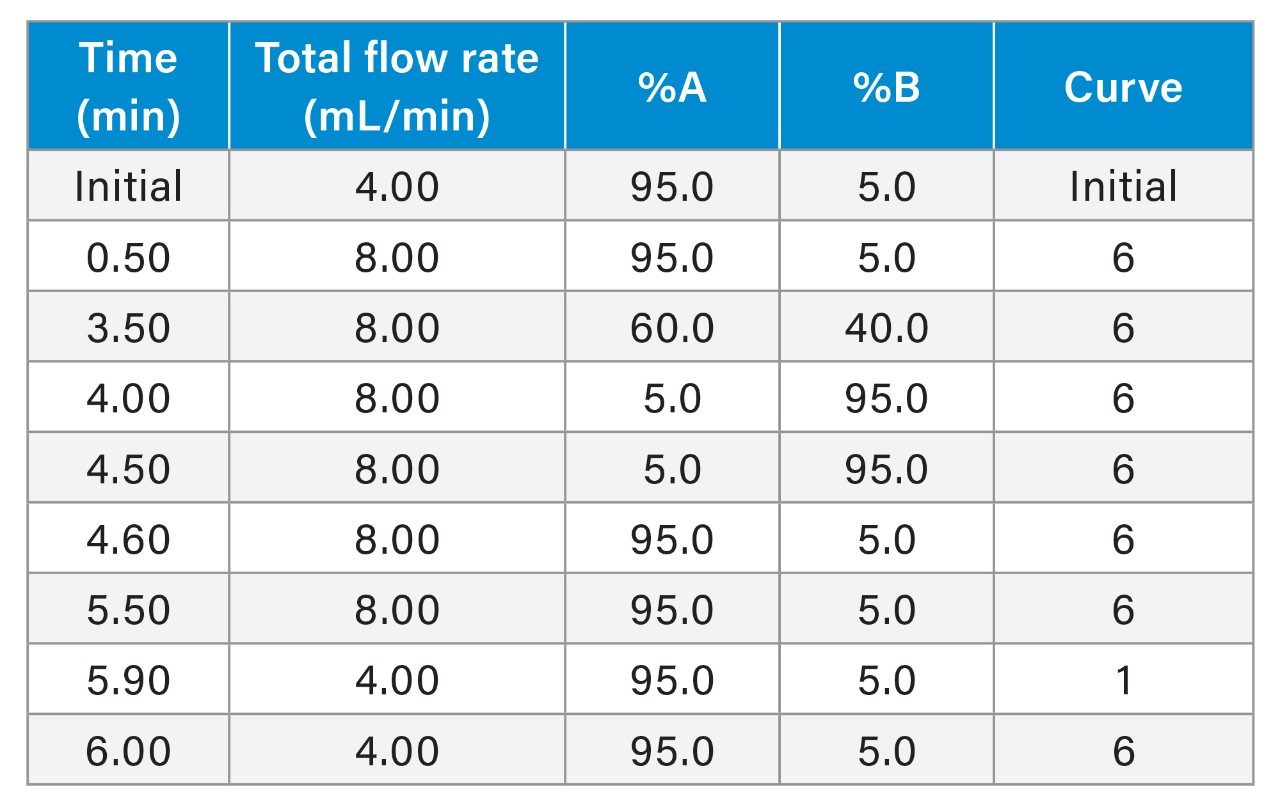
Gradient table for preparative method. Total flow rate split equally between two pumps.
MS Conditions
|
MS system: |
ACQUITY QDa II Mass Detector |
|
Ionization mode: |
ESI+ |
|
Acquisition range: |
50–350 m/z |
|
Capillary voltage: |
0.8 kV (+) |
|
Cone voltage: |
5 V |
|
Probe temparature: |
600 °C |
|
Data: |
Continuum |
Data Management
|
Chromatography data system: |
MassLynx version 4.2 SCN1049 |
|
Application manager: |
FractionLynx |
Results and Discussion
Forced degradation studies involve degradation of drug substances and drug products at stress conditions to generate degradation products that could potentially form during storage. This information is used to facilitate the selection of suitable formulation, packaging, optimal storage conditions and shelf life.6
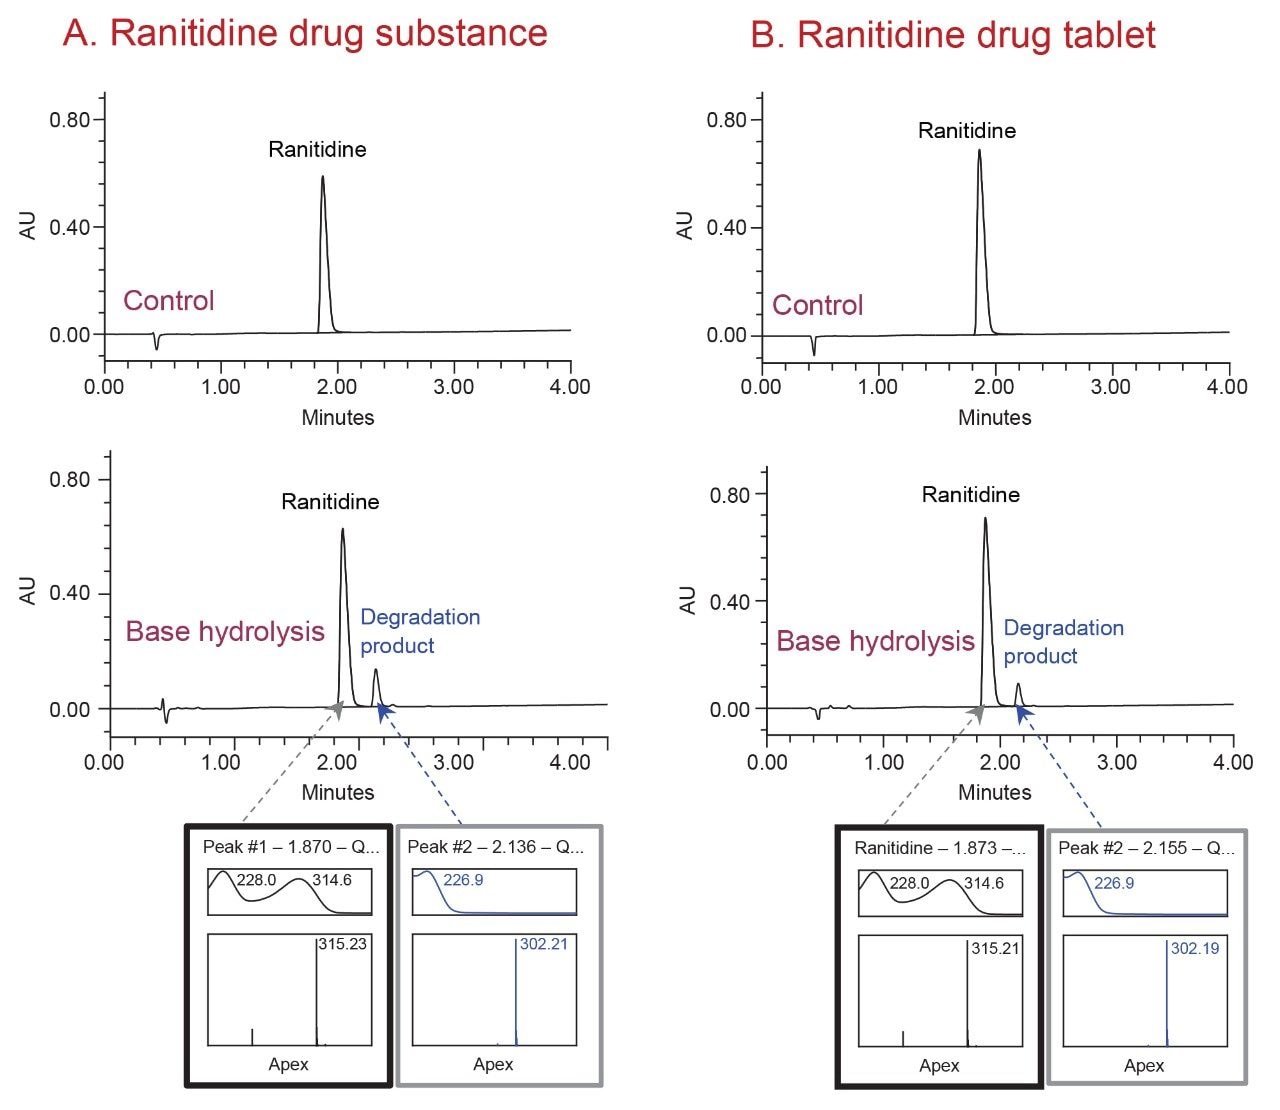
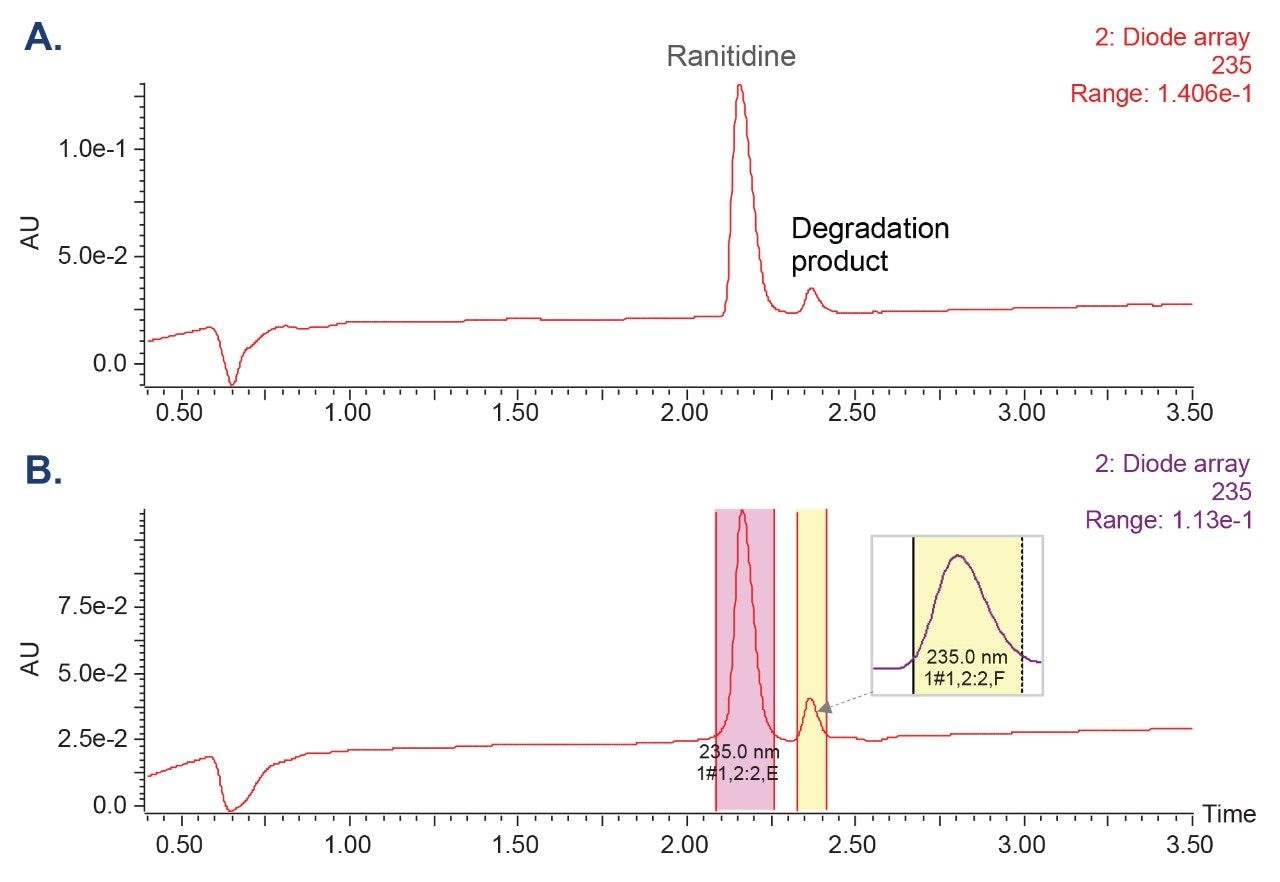
In this work, the forced degradation study was performed on the ranitidine drug substance and drug tablet formulation using acidic (0.5 M hydrochloric acid), basic (0.5 M sodium hydroxide), and heat stressed conditions. The study resulted in the formation of a major degradation product under basic conditions. The degradation product was successfully separated from the ranitidine active pharmaceutical ingredient (API) using the analytical method (Figure 1). The degradation product with m/z 302 was isolated using the Waters Analytical Scale Purification System.
Preparative Analysis and Isolation
To effectively isolate the degradation product, the analytical method was scaled to preparative conditions, followed by fraction collection of the degradation product. To preserve the quality of the chromatographic separation, a column with the same chemistry and L/dp ratio (ratio of column length to the particle diameter) was chosen for the preparative method.7
Waters XBridge Premier Bridged Ethylene Hybrid (BEH) Columns featured in both the analytical and preparative system configurations. The original analytical method was run on a 4.6–mm internal diameter (ID), 50-mm length, 3.5–µm particle size column, with an L/dp ratio of 14,286. For the preparative method, a 10-mm ID XBridge Premier OBD Column with 50-mm length and 3.5-µm particle size was chosen, resulting in the same L/dp ratio as for the analytical method. To accommodate the use of a 3.5-µm particle size column for preparatory analysis, higher pressure pumps were utilized. The Waters Preparative OBD Columns Calculator was used to aid the scale up process from analytical to preparative conditions.8 The flow rate was adjusted and split equally between the two pumps. The gradient was modified to assure resolution between the peaks for effective peak fraction collection of the degradation product to produce high purity material.
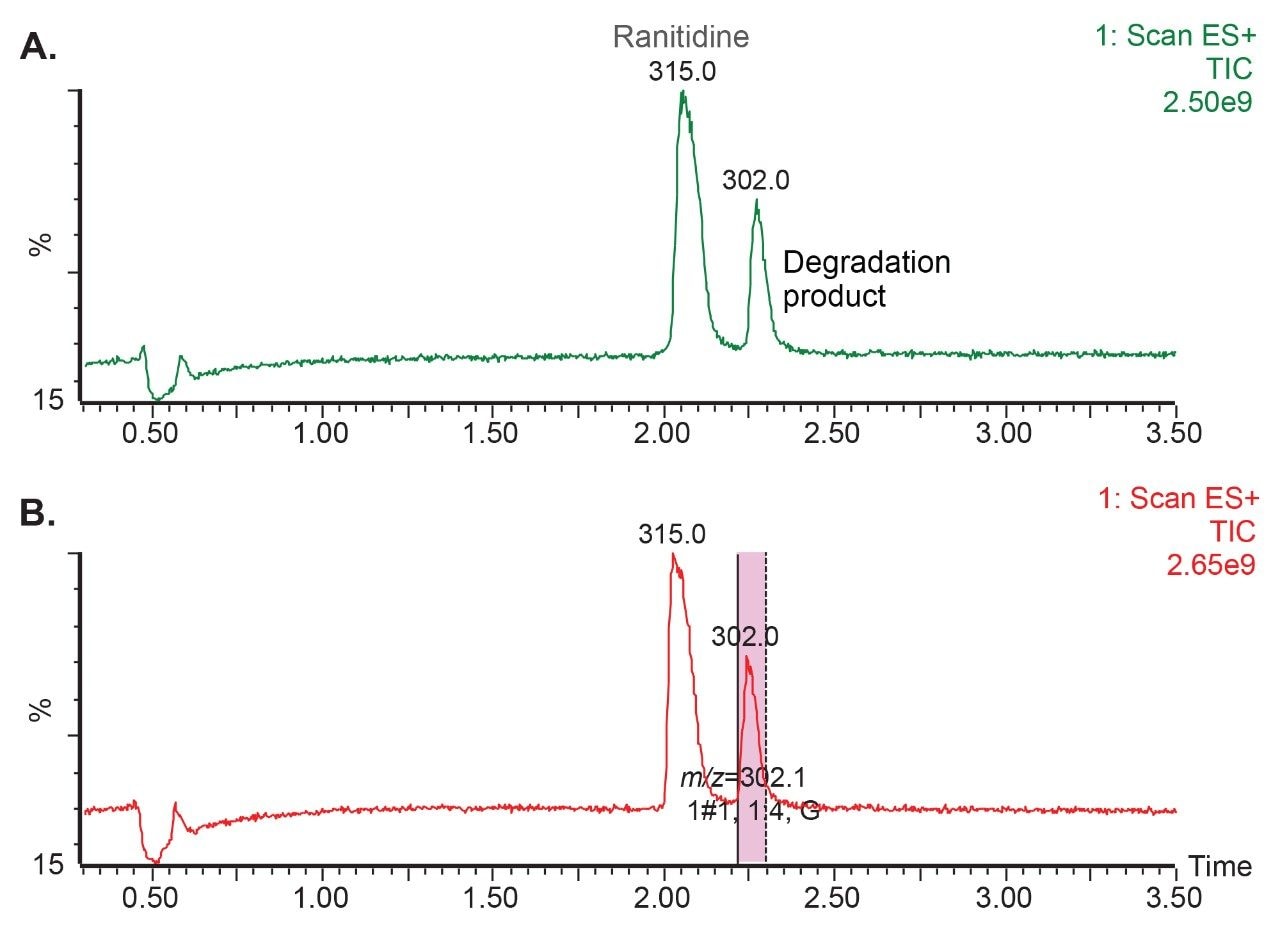
The Waters Analytical Scale Purification System, configured with an ACQUITY QDa II Mass Detector and PDA detector, allowed for both MS- and UV-triggered fraction collection. The mass-directed trigger for the degradation product was performed using m/z of 302 (Figure 2). FractionLynx automated fraction collection and tracked the location of the collected samples. Using the UV-directed trigger, both the ranitidine and degradation product peaks were collected as both compounds have the same lambda max (λmax) or absorption wavelength (Figure 3).
Purity Determination
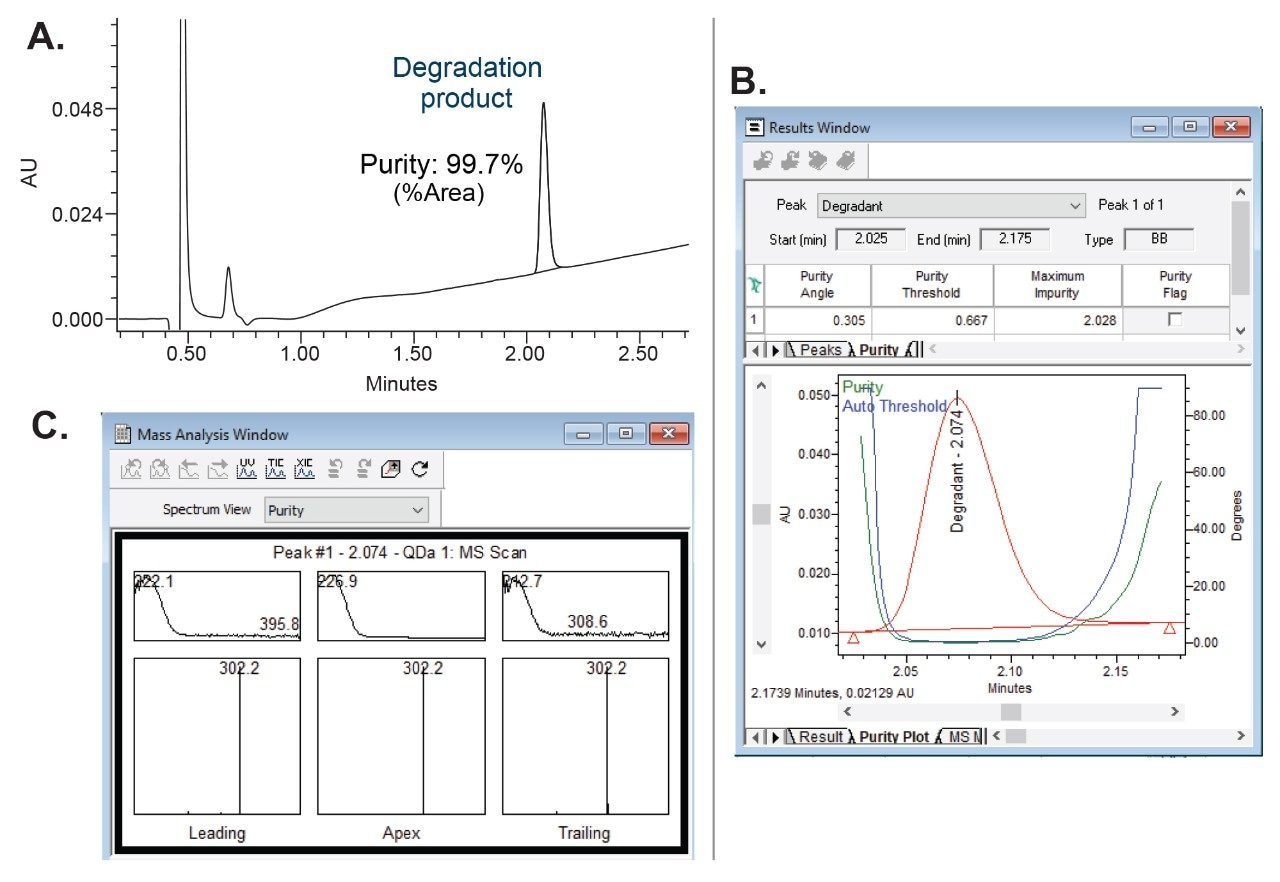
To assess the effectiveness of the isolation process, chromatographic and spectral purity of the collected degradation product were verified by injecting MS-triggered fractions on the analytical Arc Premier System (Figure 4).
The chromatographic purity or percentage (%) area calculated by comparing area of the degradation product to the total area in the chromatographic injection was found to be 99.7% (Figure 4A). For spectral purity verification, both the UV spectral data and mass spectral data were used. The UV plot showed that the purity angle of the degradation product was below the threshold angle, indicating that the degradation product was spectrally homogenous and not subject to coelution with any other components from the sample (Figure 4B). Additionally, the mass analysis window with integrated PDA and MS spectral data across the entire peak showed the presence of a single mass of m/z 302, demonstrating specificity for the degradation product (Figure 4C).
Loading Study
Achieving high load capacity is essential in increasing the yield of an isolated material, producing larger amounts for further testing and characterization. While increasing the injection volume generally produces higher yield of the collected material, sufficient chromatographic resolution between the peaks with no interference must be obtained to produce high purity material.
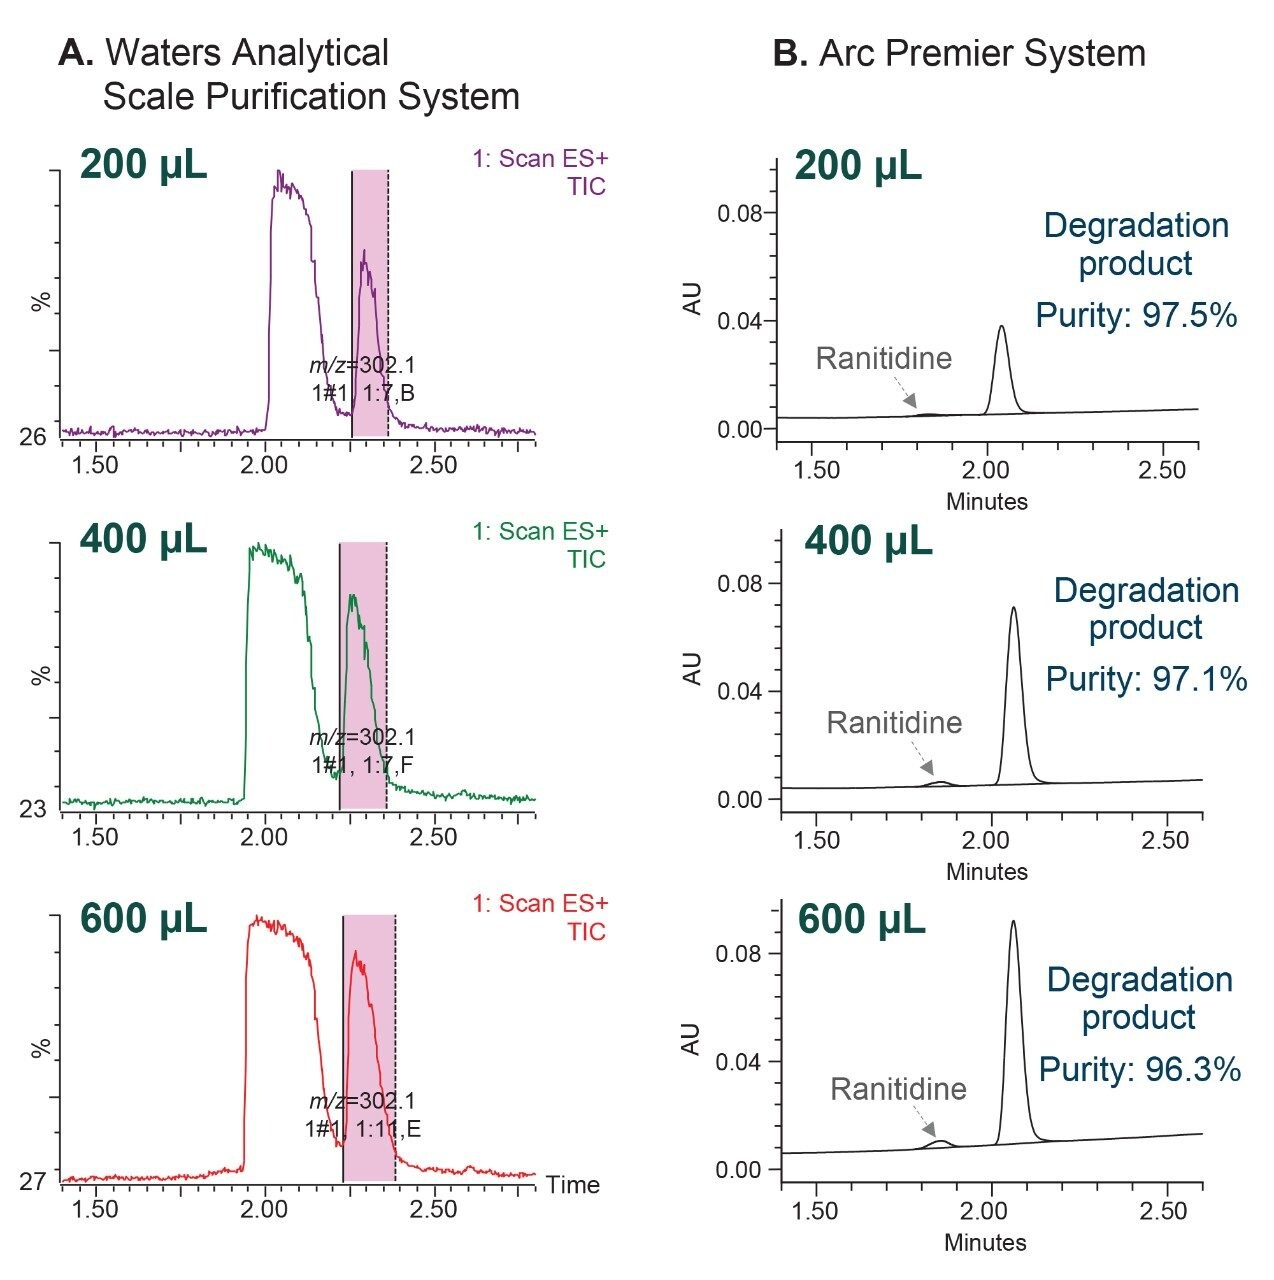
In this work, the loading capacity was evaluated by collecting MS-triggered fractions of the degradation product peak using different injection volumes ranging from 100 to 600 µL, utilizing the Waters Analytical Scale Purification System (Figure 5A). The collected fractions were then injected on the analytical Arc Premier System to assess chromatographic purity of the collected degradation product (Figure 5B). The chromatographic purity calculated based on % area, ranged from 97.5% to 96.3%. The original injection volume of the preparative method was 71 µL, based on scale up of the analytical method. Increasing the injection volume to 600 µL, improved loading by 8.5 times, while achieving purity of 96.3%.
Conclusion
Isolation of the degradation product formed through a base-hydrolyzed forced degradation study was successfully performed using the Waters Analytical Scale Purification System. The preparative separation was done at 8 mL/min, 7000 psi, and 30 °C using a 10 mm x 50 mm ID column with 3.5–µm particle size, to match the analytical separation. This increased performance allowed for faster chromatography with improved resolution and sensitivity. It also simplified scale-up from the analytical method.
The FractionLynx Application Manager facilitated fraction collection of the degradation product and tracked the location of the collected peak fractions. The chromatographic and spectral purity of the collected fractions were assessed and a purity of 99.7% was demonstrated for the degradation product. Higher loading onto the preparative column was achieved by increasing the injection volume, with the purity of the degradation product between 97.5–96.3%.
References
- United States Pharmacopeia (USP), General Chapter <1086>, “Impurities in Drug Substances and Drug Products” USP 40 and PF 41(3) (Rockville, MD, May–June 2015).
- Dhangar KR, Jagtap RB, Surana SJ, Shirkhedkar AA. Review Article Impurity Profiling of Drugs Towards Safety and Efficacy: Theory and Practice. Journal of the Chilean Chemical Society. 62:2, 2017.
- Alsante KM, Hatajik TD, Lohr LL, Sharp TR. Isolation and Identification of Process Related Impurities and Degradation Products from Pharmaceutical Drug Candidates, Part 1. Pfizer Global Research and Development Division, Analytical Research and Development Department-Groton, CT. 2001. https://citeseerx.ist.psu.edu/document?repid=rep1&type=pdf&doi=c51a7169137f536aa0f085c08de24c7b314bb27c.
- Ranitidine: https://www.drugs.com/ranitidine.html.
- Waters Analytical Scale Purification System,
https://www.waters.com/nextgen/global/products/chromatography/chromatography-systems/analytical-scale-purification-system.html. - International Conference on Harmonization (ICH) Q1A, Stability Testing of New Drug Substances and Products. Published 6 February 2003.
- Jablonski J. 5 Rules of Scaling LC Purification. Waters Corporation; Article. 720008383. 2024.
- Waters Preparatory ODB Columns Calculator, https://www.waters.com/waters/promotionDetail.htm?id=134713448&locale=101.
- Margaret Maziarz. Isolation of a Degradation Product of Ranitidine Hydrochloride Using the Analytical Scale Purification System. 720009084.
720008785, April 2025