Automating the Sample Preparation Workflow for Per- and Polyfluoroalkyl Substances (PFAS) in Aqueous Samples Following EPA Method 1633
Kari Organtini1, Ken Rosnack1, Oliver Burt1, Ian Wan2
1 Waters Corporation, United States
2 Promochrom Technologies
Published on June 17, 2025
Abstract
US EPA Method 1633 is a multi-lab validated method for the analysis of 40 PFAS in a variety of environmental matrices. Sample preparation involves a lengthy SPE procedure and additional sample cleanup. SPE automation is demonstrated as a reliable alternative to manual sample preparation, allowing for sample preparation in approximately half the amount of time, resulting in higher sample throughput and shorter turnaround times. The automated method met all the quality control guidelines for EPA 1633, making it an equivalent option for use with the method. A variety of complex environmental water samples were prepared using automation and analysis was performed using the Waters™ PFAS workflow for LC-MS/MS.
Benefits
- A fully automated comprehensive workflow is presented for PFAS analysis of authentic water samples following the EPA 1633 procedure
- Performance criteria of EPA 1633 for extraction of aqueous samples are easily met using a fully automated SPE extraction system
- Performance of the automated workflow is demonstrated by easily passing qualifications of a Waters ERA certified reference material
An automated sample preparation workflow optimizes laboratory efficiency by reducing sample preparation time by half and thereby minimizing overall time to process samples.
Introduction
US EPA Method 1633 is a multi-lab validated method for the analysis of non-potable water matrices, soils, biosolids, and tissues.1 The method covers 40 PFAS, and for aqueous samples utilizes a sample preparation incorporating solid phase extraction (SPE) on a weak anion exchange (WAX) cartridge followed by graphitized carbon black (GCB) clean up. Large volume sample sizes are extracted using this protocol, which is a lengthy process that requires trained laboratory personnel to complete. Manual SPE preparation for a 250 mL sample size can take in the range of 3 to 4 hours per batch for a skilled user. With the need for PFAS analysis increasing, a lengthy sample preparation process like this can significantly impact sample throughput and turnaround time. Sample preparation automation can ease the burden of challenging methods on laboratory staff and reduce the processing time for samples.
In previous work, the manual workflow for EPA 1633 was established and thoroughly tested for complex environmental water samples.2 This work adapts the use of an automated SPE extraction system for these same sample types reducing the 3–4 hour sample preparation time to 2 hours per batch. This automation enhances an already reliable solution of the ACQUITY™ Premier BSM FTN UPLC™ System coupled with a Xevo™ TQ Absolute Mass Spectrometer for PFAS analysis following the EPA Method 1633.
Experimental
Sample Preparation
Samples discussed in this application note include ground water and surface water that were collected locally, and influent and effluent wastewater that were kindly provided by a municipal wastewater treatment facility in the Midwest United States. Influent wastewater samples were sampled only after the primary settling phase, prior to any further treatment. Effluent wastewater samples were fully treated samples ready for discharge. Samples are from the same sources studied in a previous application note that performed EPA 1633 extractions manually.2 All water samples were collected using grab sampling directly into 250 mL high density polypropylene bottles. Samples were frozen until sample analysis according to EPA 1633 guidelines and holding times. Sample bottles were weighed prior to sample preparation (full) and after sample preparation (empty) to determine the exact volume collected in each bottle. In addition to authentic samples, the Waters ERA PFAS in Wastewater (Item No. 404) certified reference material (CRM) was processed with the samples.
The Oasis WAX/GCB bilayer dual-phase SPE cartridge containing both WAX and GCB sorbents, was used for the preparation of all samples. The addition of GCB into the SPE cartridge allows for the full sample extraction and sample clean-up required by EPA 1633 to be automated rather than having to perform the GCB clean-up step using a dispersive technique.
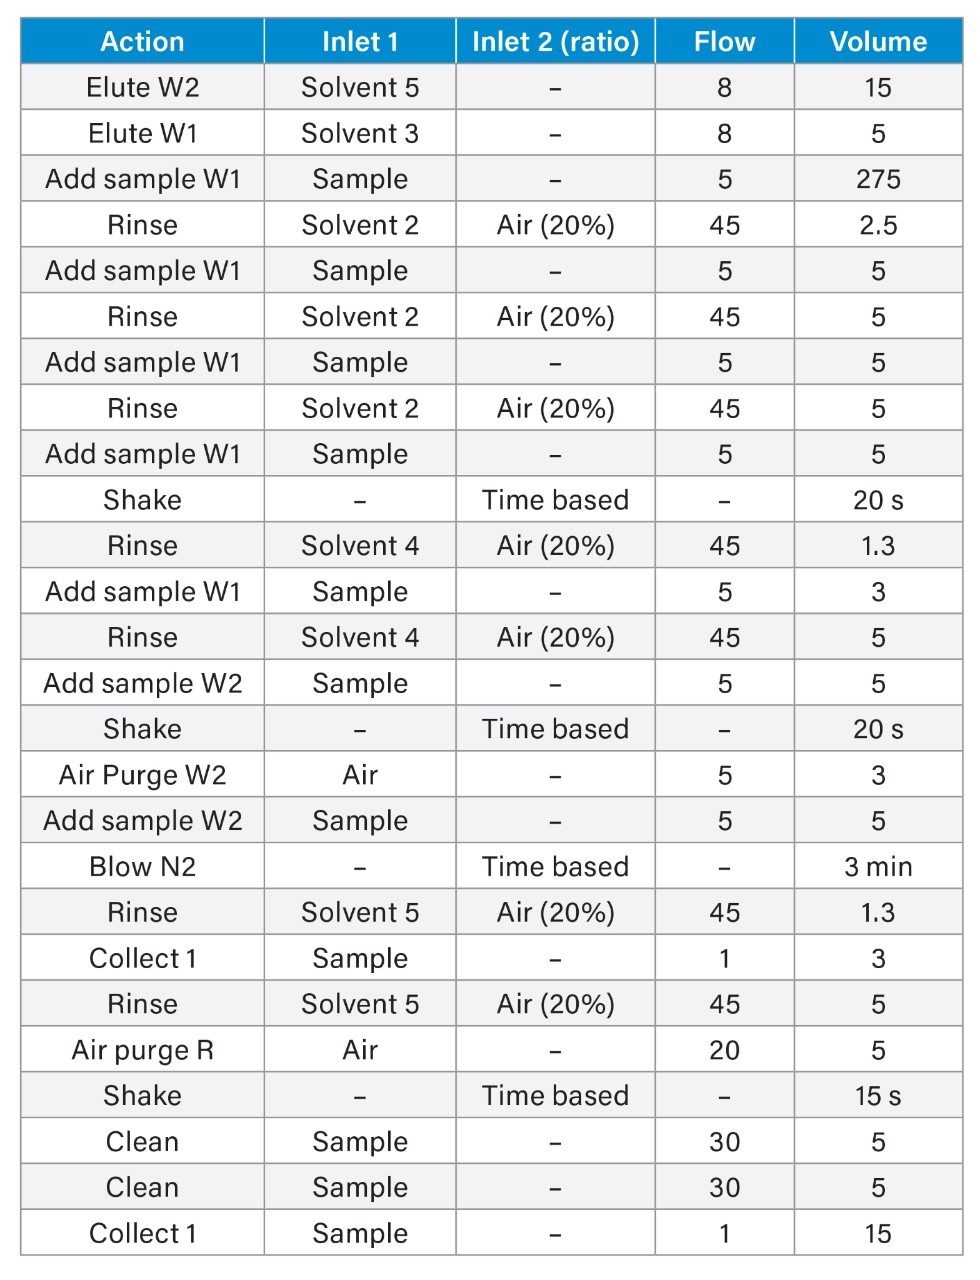
Sample extraction was performed using the Promochrom SPE-03 Gen 4 Automated SPE System. The method used to control the automated SPE system is detailed in Table 1 and was directly adapted from EPA 1633. A sample volume of 250 mL was extracted similar to the sample volume used for manual extractions.2 High capacity inline filters and anti-clogging tips for the MOD-004 caps were used on the sample inlet lines to filter out particulates before introduction to the SPE system. For the wastewater samples, which contained a substantial amount of suspended solids and particulates, glass wool was also packed to half-height of the SPE cartridge to prevent cartridge clogging.
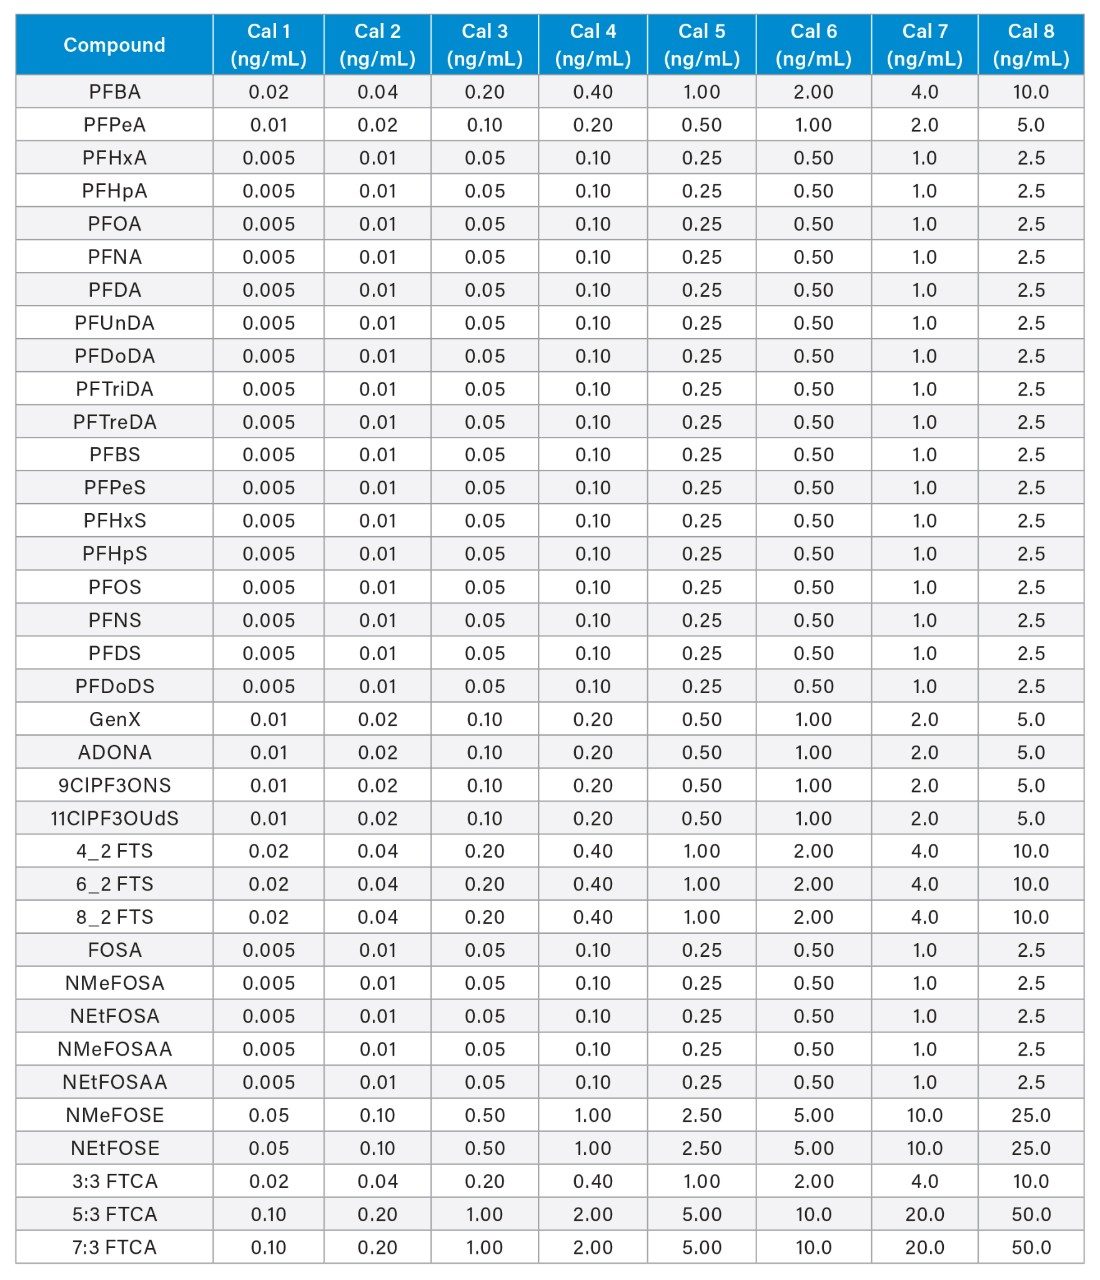
All samples were spiked with 5 ng/L (sample concentration equivalent) of the required extracted internal standard (EIS) prior to extraction and 5 ng/L (sample concentration equivalent) of the required non-extracted internal standard (NIS) after extraction. The calibration curve range for each analyte is listed in Appendix Table 2. All standards were obtained as mixes from Wellington Laboratories.
LC Conditions
|
LC system: |
ACQUITY Premier BSM with FTN |
|
Vials: |
700 µL Polypropylene Screw Cap Vials (p/n: 186005219) |
|
Analytical column: |
ACQUITY Premier BEH™ C18 2.1 x 50 mm, 1.7 µm (p/n: 186009452) |
|
Isolator column: |
Atlantis™ Premier BEH C18 AX 2.1 x 50 mm, 5.0 µm (p/n: 186009407) |
|
Column temperature: |
35 °C |
|
Sample temperature: |
10 °C |
|
PFAS kit: |
PFAS Install Kit (p/n: 176004548) |
|
Injection volume: |
2 µL |
|
Flow rate: |
0.3 mL/min |
|
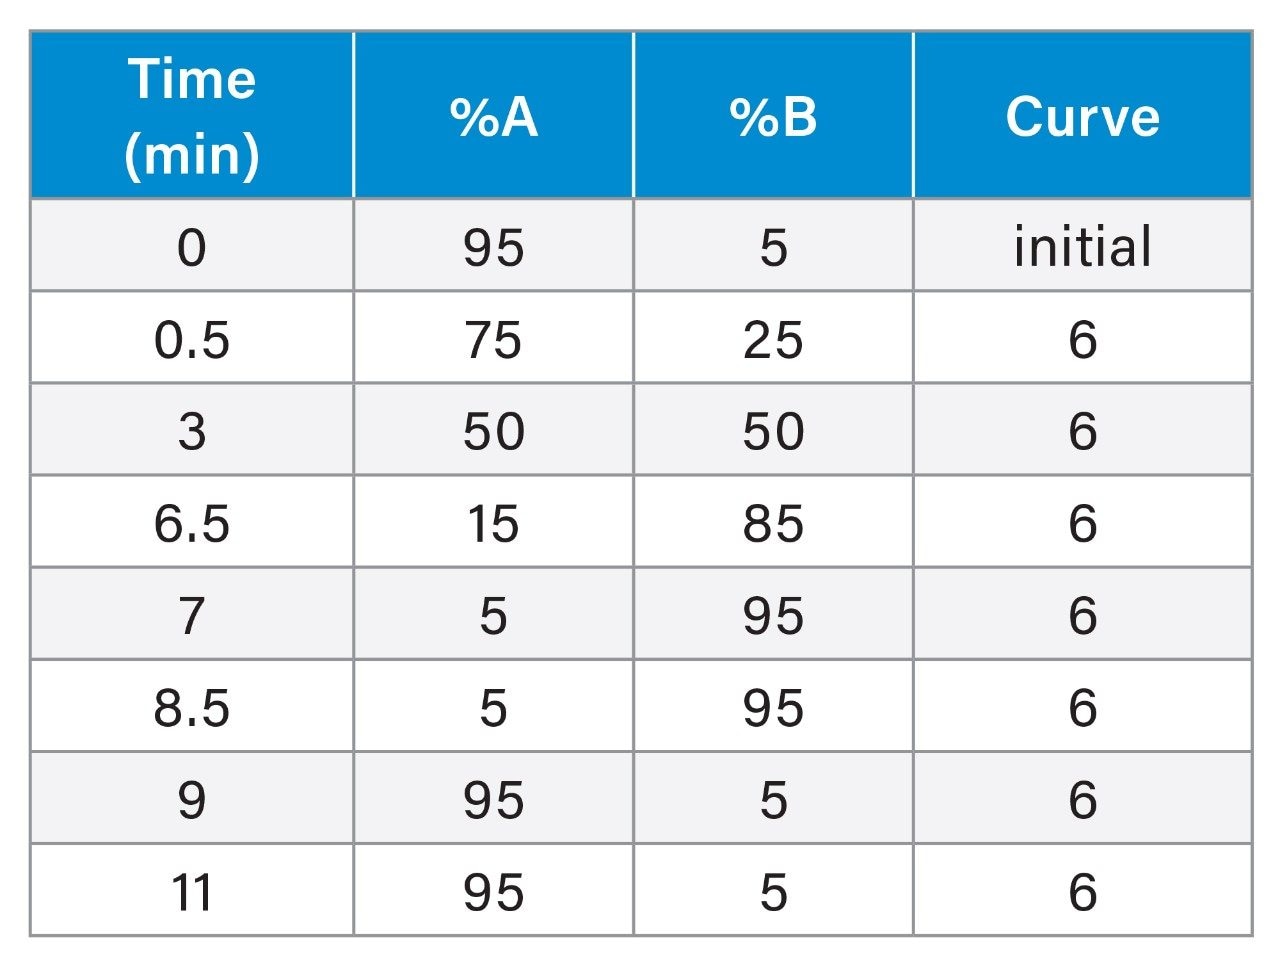
Mobile phase A: |
2 mM ammonium acetate in water |
|
Mobile phase B: |
2 mM ammonium acetate in acetonitrile |
MS Conditions
|
MS system: |
Xevo TQ Absolute |
|
Ionization mode: |
ESI- |
|
Capillary voltage: |
0.5 kV |
|
Source temperature: |
100 °C |
|
Desolvation temperature: |
350 °C |
|
Desolvation flow: |
900 L/hr |
|
Cone flow: |
150 L/hr |
|
MRM method: |
See appendix for full MRM method details |
Data Management
|
Software: |
waters_connect™ for Quantitation |
Results and Discussion
Blanks
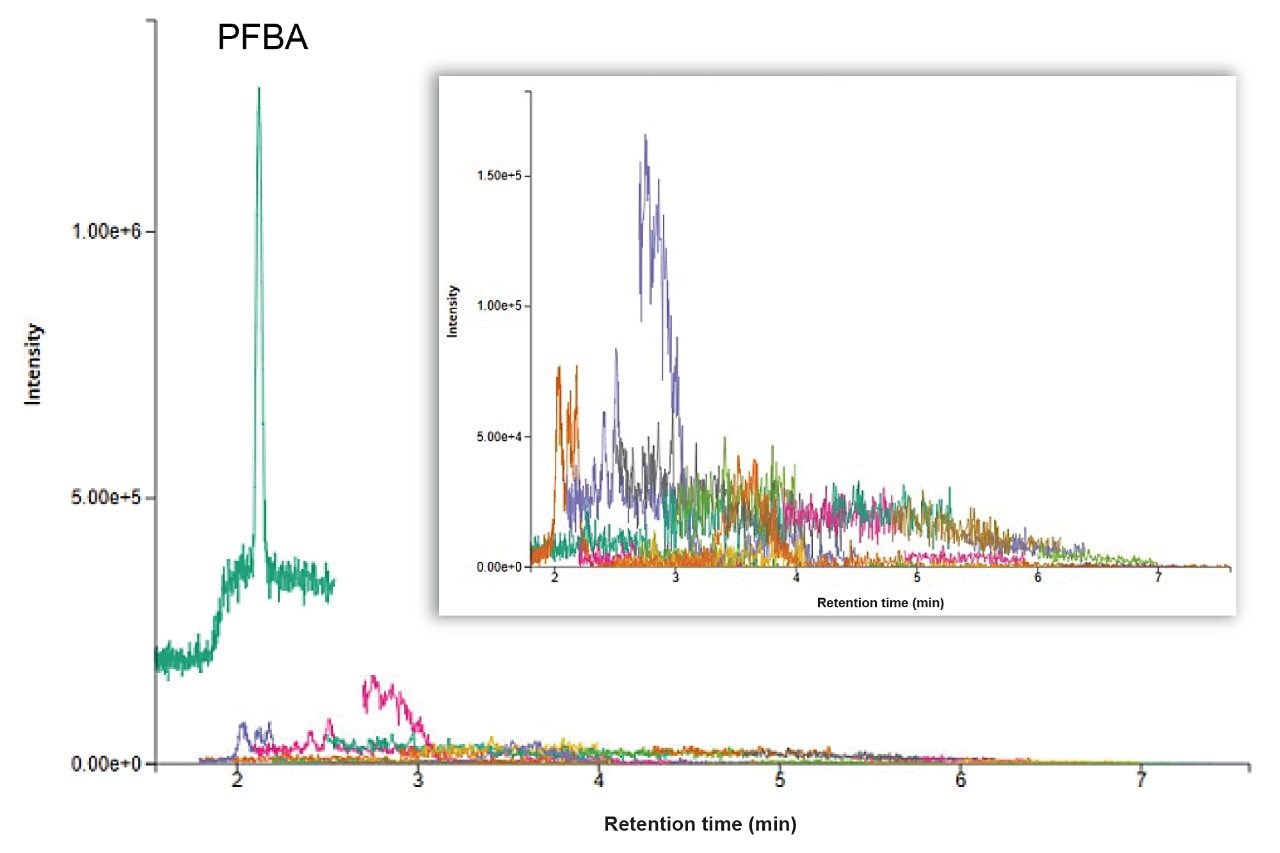
PFAS contamination is often a concern due to their common use in everyday products. During sample preparation procedures like solid phase extraction (SPE), contamination introduced into samples will become concentrated along with the sample. Therefore, it is imperative to have confidence that the equipment, consumables, and reagents used for sample preparation are free from or low in PFAS contamination. Method blanks were extracted on the Promochrom SPE-03 system with each batch of samples to monitor any contribution from the system itself. A method blank chromatogram is highlighted in Figure 1 demonstrating the full automated SPE process did not contribute PFAS contamination to the samples for 39 of the 40 targeted PFAS. There is a large contamination level of PFBA present in the method blank that has previously been determined to be from solvents and reagents rather than the SPE-03 system itself. The method blanks demonstrate that the SPE-03 system is not contributing to PFAS contamination, nor is there carryover between batches when the cleaning method is run.
Recovery in Water Samples
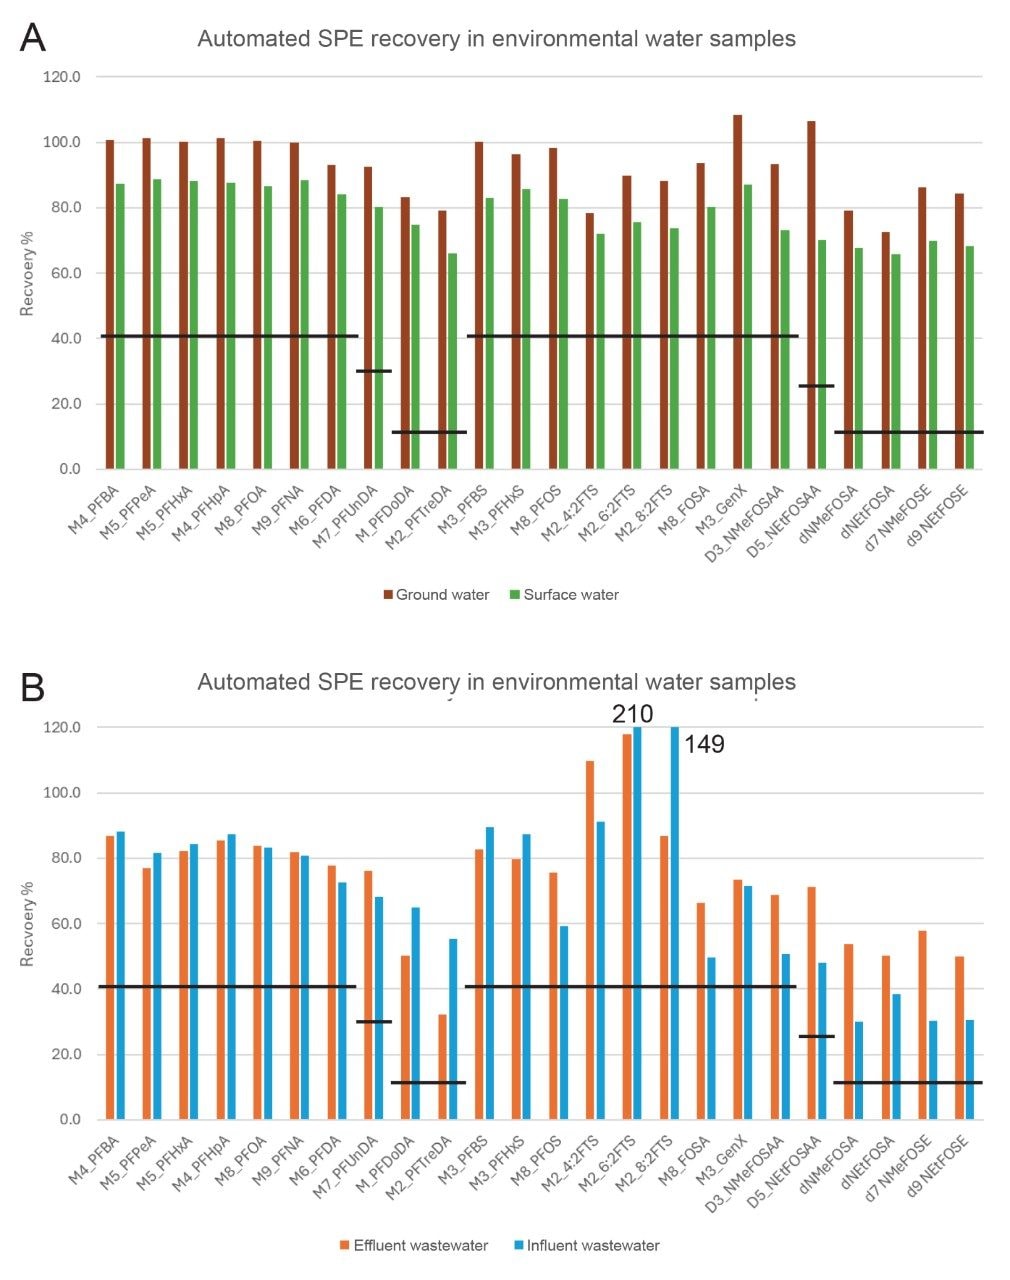
One of the important QC criteria to be demonstrated for method performance according to EPA 1633, is recovery of the extracted internal standards (EIS). The percent recovery of the EIS for each type of water sample tested (ground, surface, influent and effluent) is shown in Figure 2, with the minimum recovery limit identified by the black lines.1 As expected, the more complex wastewater samples did have lower recoveries, but they were all well above the required minimum recovery values. The isotope labeled standards for 6:2 and 8:2 FTS did experience quite a large enhancement effect in the influent wastewater samples. The acceptable maximum recovery for 13C2-6:2 FTS and 13C2-8:2 FTS are 200% and 300%, respectively. The 6:2 FTS internal standard had a slightly higher recovery than that range and may have been influenced by the high concentration of native 6:2 FTS present in the wastewater samples. Due to the internal standard only containing 2 13C isotope labels, there is a potential that natural isotope abundance in a highly contaminated sample may be detected as the isotope labeled standard. Overall, the mean recovery of all EIS among 19 environmental water samples extracted was 78.2% with a mean RSD of 8.1%. This demonstrates that the automated SPE extraction system is reproducible across a range of water sample types and is fit-for-purpose for EPA 1633.
Analysis of a Certified Reference Material
To assess the accuracy of the automated sample preparation technique, a certified reference material (CRM) from Waters ERA was processed along with the authentic samples. The PFAS in the Wastewater CRM is certified for all EPA 1633 analytes, giving a representative reference material for method performance without having to spike unknown matrix samples, which can become complicated without a sample free from PFAS.
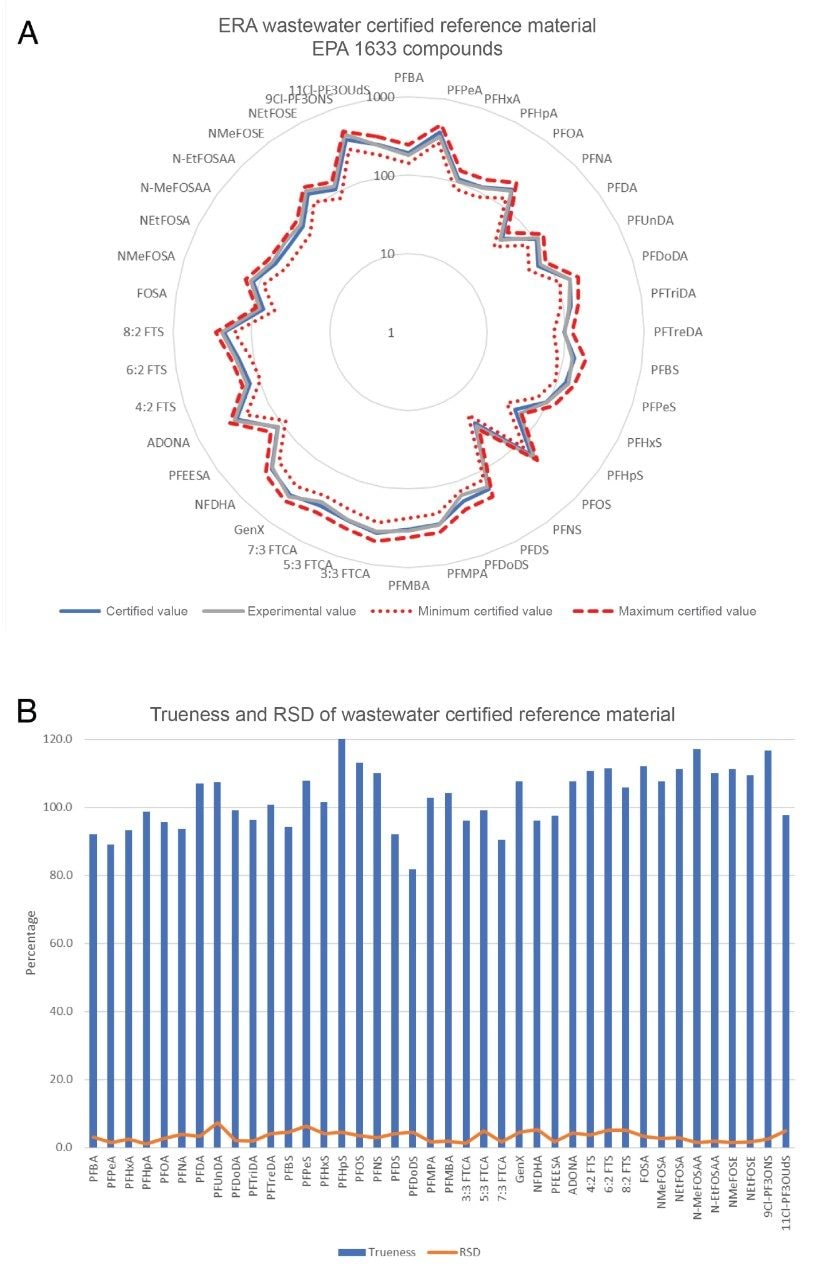
Figure 3(a) shows the average quantitative results for 3 replicate extractions and analyses of the Wastewater CRM compared to the certified values and minimum/maximum certified value range. The trueness and RSDs represented as percentages are displayed in Figure 3(b). All 40 target PFAS in EPA 1633 were quantified within the allowable minimum and maximum concentration range with a mean trueness of 103% and trueness range of 81.8–120%. Mean %RSD of replicates was 2.9% with a range of 1.1–7.3%. The manual extraction and analysis of the same reference material resulted in a mean trueness of 92%, with a range of 73–112%.2 These results demonstrate the automated workflow in combination with the sample analysis is highly accurate and repeatable.
Ongoing QCs and Analysis of Authentic Water Samples
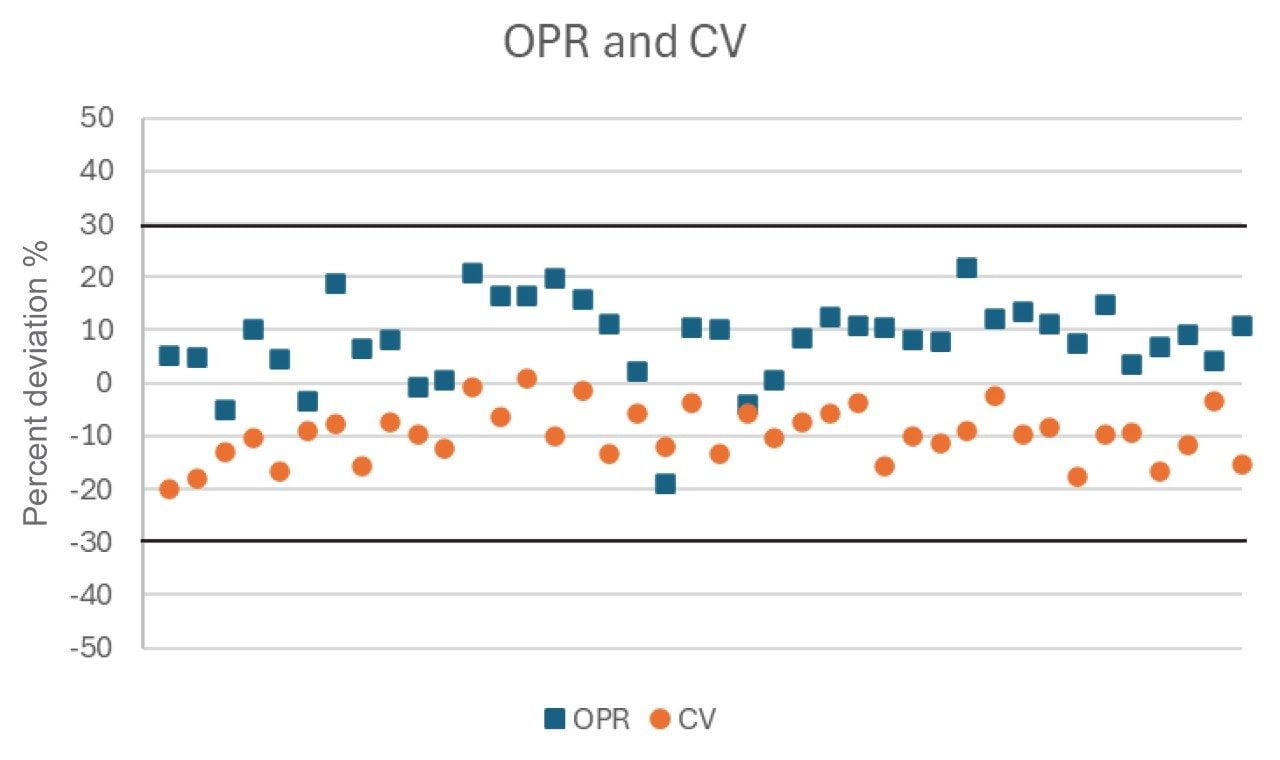
After the initial demonstration that the method performs as required, EPA 1633 requires ongoing quality control measures including an ongoing precision and recovery (OPR) sample. The OPR is a reagent water sample spiked with a known concentrations of the 40 targeted PFAS as well as internal standards and is taken through the full sample preparation procedure. The recovery requirements for the OPR samples vary depending on compound (details can be found in Table 5 and 6 of the EPA 1633 method). The narrowest range of recovery allowed for the native analytes is 70–130% recovery (or ±30% deviation). An OPR sample was extracted in three batches of samples throughout this work to monitor the consistency of SPE extractions. Figure 4 charts the average percent deviation of the OPR extracts across all the batches compared with the percent deviation of the calibration verification (a non-extracted solvent standard injection with a similar ±30% deviation requirement). All compounds were well within the strictest limitation of ±30% deviation for both OPR and CV demonstrating the technique is consistent and accurate over time.
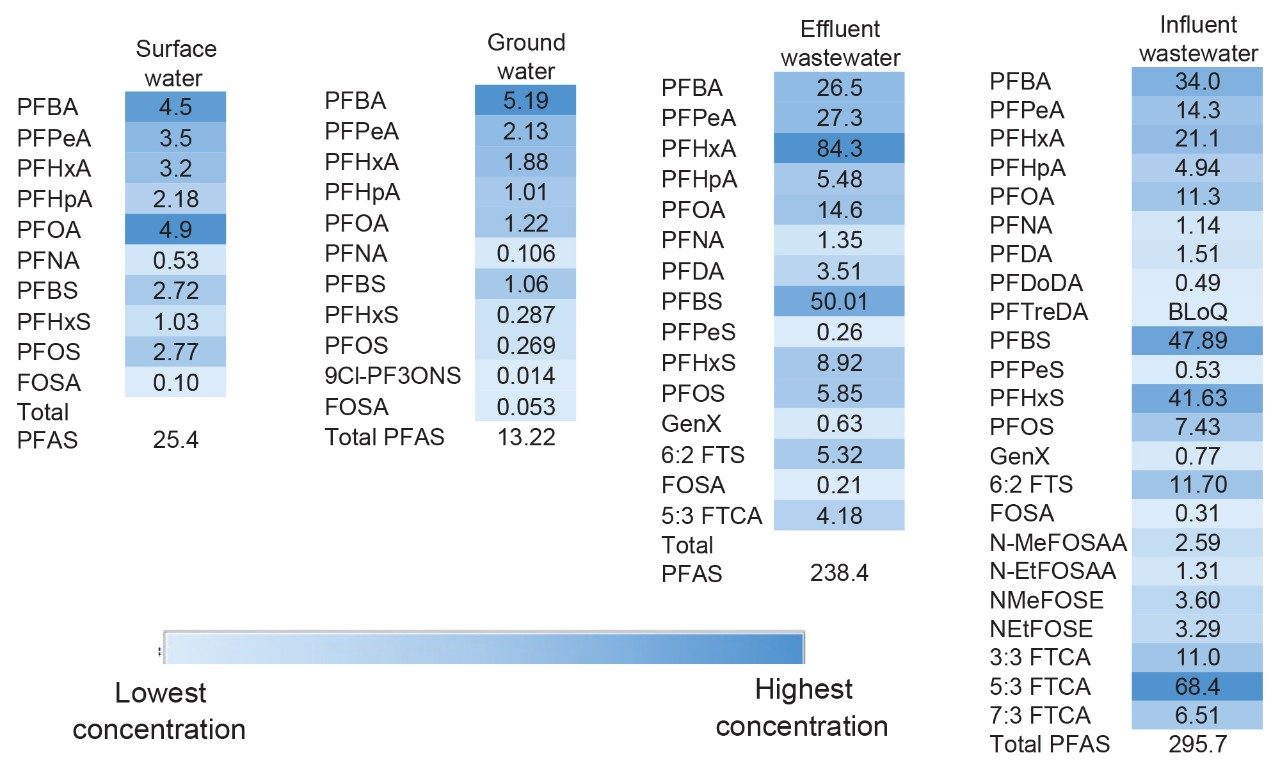
4 different environmental water samples were extracted using the automated SPE system and analyzed using LC-MS/MS to determine the levels of PFAS in authentic sample types. PFAS were detected in all four sample types at significantly different concentration levels with the details of each sample listed in Figure 5. The wastewater samples contained an order of magnitude higher total PFAS levels than the surface and ground water. Comparatively, the total PFAS level in the treated effluent was not significantly reduced from the influent wastewater. The general PFAS concentrations detected using the automated sample preparation workflow were similar to those determined by a manual workflow2 with slight differences expected due to sampling at different times. This gives confidence that the automation of sample preparation produces the same results as manual preparation.
Conclusion
Sample preparation for aqueous samples following the EPA 1633 workflow was successfully automated using the Promochrom SPE-03 system. Full automation of the sample preparation and additional carbon cleanup was made possible due to the use of the Oasis WAX/GCB bilayer dual-phase for PFAS Analysis SPE cartridge. It was shown that the SPE system does not contribute to PFAS contamination of the samples and is therefore suitable for accurate and confident PFAS analysis. Extracted internal standard recoveries in four different water sample types were well above the required minimum recovery values. Additionally, calculated concentrations values for a wastewater reference material were determined to be very accurate when compared to the provided certified range, reinforcing confidence in method accuracy.
4 types of water samples, varying in complexity, were analyzed for the 40 PFAS included in EPA 1633 where PFAS were detected in all samples in a range similar to those detected when the same samples were prepared manually. The data presented demonstrates that the use of an automated SPE extraction system is equivalent to processing the samples manually, allowing laboratories more flexibility in sample handling and potentially increasing sample capacity for EPA 1633.
References
- US Environmental Protection Agency. Analysis of Per- and Polyfluoroalkyl Substances (PFAS) in Aqueous, Solid, Biosolids, and Tissue Samples by LC-MS/MS, Draft 4. July 2023.
- K Organtini, K Rosnack, C Plummer, P Hancock, O Burt. Analysis of Per- and Polyfluoroalkyl Substances (PFAS) in Accordance with EPA 1633 Part 2: Analysis of Aqueous Matrices. Waters Application Note. 720008143. December 2023.
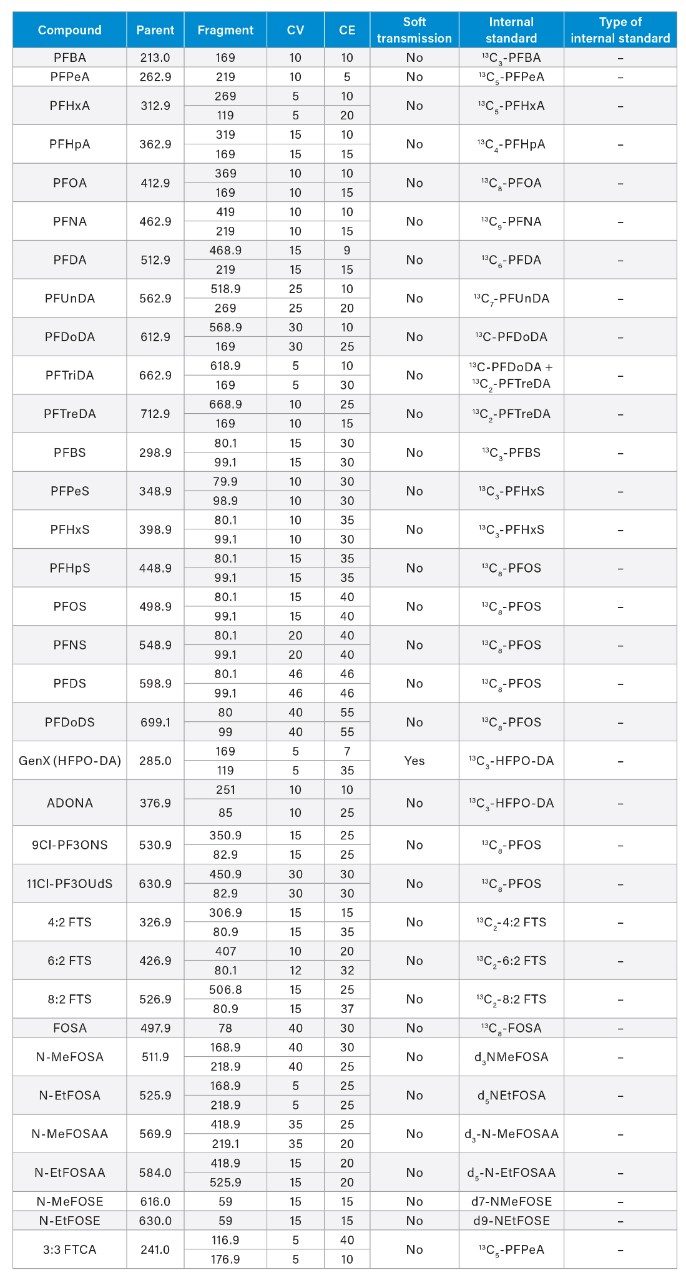
Appendix Table 1. MS Method conditions used for PFAS analysis of EPA 1633 compounds in water samples on the Xevo TQ Absolute MS.


720008825, June 2025