A Streamlined Workflow for Quantitative Bioanalysis using waters_connect for Quantitation Software: A Case Study Using Gefitinib
Robert Plumb
Waters Corporation, United States
Published on November 20, 2025
Abstract
Preclinical and early human drug metabolism and pharmacokinetics (DMPK) studies are essential for drug evaluation programs. LC-MS/MS-based quantitative bioanalysis provides accurate concentration data for the determination of drug and metabolite concentrations in biofluids, enabling pharmacokinetic and toxicokinetic analysis. Successful bioanalytical assays require method development, validation, data acquisition, peak integration, concentration determination, and reporting, all performed in a regulatory-compliant environment. waters_connect™ for Quantitation Software simplifies the time-consuming, complicated process of bioanalytical LC-MS method development, data analysis, and reporting in a compliant-ready environment. This application note demonstrates the use of the waters_connect for Quantitation Software for method development and the sample analysis of gefitinib and its major metabolites in rat plasma.
Benefits
- Automated multiple reaction monitoring (MRM) method development, allowing robust, reproducible methods to be developed quickly and without the need for expert users.
- Simple LC-MS method creation and method execution, minimizing data transcription errors and improving data quality.
- Data-driven results review and reporting, simplifying the process of peak integration review and reporting.
Introduction
The quantification of drugs and their metabolites using in vitro and in vivo studies is essential for efficient drug research and development. Liquid chromatography coupled with tandem quadrupole mass spectrometry is the technology of choice for this application due to its selectivity, specificity, speed, and sensitivity, with modern LC-MS/MS systems providing pg/mL levels of quantification with analysis times of 2–5 minutes.1 Modern drug discovery chemistry processes have resulted in a greater number of compounds entering the development process, which require DMPK evaluation and consequently sample analysis, usually via LC-MS/MS.2 The increased need for sample analysis to support drug development has been mirrored in the generic drug industry, where there is a need to rapidly analyze samples from bioequivalence studies to support regulatory filings.
This pressure on sample analysis has resulted in the need to simplify and fast-track the process of LC-MS/MS method development without sacrificing quality, sensitivity, or regulatory compliance. The waters_connect for Quantitation Software has been specifically designed to address the most challenging bioanalytical issues, providing a rapid simple approach to method development, sample analysis, data review, and reporting, in a compliant ready environment. This application note illustrates the capability of this new, powerful quantification software for the analysis of plasma samples derived from the single subcutaneous administration of gefitinib (Iressa®), a tyrosine kinase inhibitor, to male Sprague Dawley rats.
Experimental
Study Conduct
Plasma samples were collected from 4 male Sprague Dawley rats (7–9 weeks old, 175–225 g), which had been subcutaneously dosed with gefitinib at 10 mg/Kg. Blood samples (50 µL) were obtained via an indwelling catheter pre-dose at 0.10, 0.25, 0.5, 1, 3, 6, 8, and 24 hours post-dose and centrifuged to give approximately 20 µL of plasma. The resulting plasma samples were stored at Pharmacokinetic Study, with full management and local ethical committee review.
A calibration curve containing the authentic standards of gefitinib (Figure 1) and the O-desmethyl metabolite was prepared in control rat plasma over the range of 1–1000 ng/mL. Quality control samples were prepared from a separate weighing of gefitinib and O-desmethyl metabolite at 2.5, 25, and 750 ng/mL.
Method Conditions
The plasma samples were prepared by solid phase extraction using a 96-well Oasis HLB (2 mg) Extraction Plate. Each sample (10 µL) was diluted with an equal volume of 4% phosphoric acid containing gefitinib d6 internal standard (50 ng/mL) and added to the SPE plate, which had been previously conditioned with 200 µL of methanol followed by 200 µL of water. The plate was washed with 50 µL of 5% aqueous methanol and eluted with 2 x 25 µL of acetonitrile. The resulting samples were then diluted with 450 µL of 50:50 methanol:water, for analysis by UHPLC-MS/MS.
The sample extracts were analyzed (1 µL) using an ACQUITY™ Premier UPLC Chromatography System coupled to a Xevo™ TQ Absolute XR Tandem Quadrupole Mass Spectrometer operating in positive ion ESI MRM mode. The chromatographic separations were performed on a 2.1 x 100 mm ACQUITY Premier BEH™ C18 1.7 mm Column maintained at 60 °C with a solvent flow rate of 600 µL/min. The column was eluted with a linear reversed–phase gradient over 2.9 min (see conditions below).
Gefitinib and metabolites were quantified via positive ion electrospray MS (+ESI); MS conditions are provided in Tables 1–4. The MRM transitions were optimized using waters_connect MS Optimization and determined to be 447.18 => 128.1, 433.05 => 128.1, and 453.16 => 134.1 for gefitinib, O-desmethyl metabolite of gefitinib and d6-gefitinib-d6 [internal standard] respectively, with collision energies of 24, 24, and 26 and cone voltages of 35, 35, and 25, respectively. In addition to gefitinib and the O-demethyl metabolite, the following metabolites, for which no authentic standards were available, were monitored M37783, M537194 and M605211 using the transitions 444.60 => 128.1, 422.00 => 321.00 and 461.00 => 142.0.
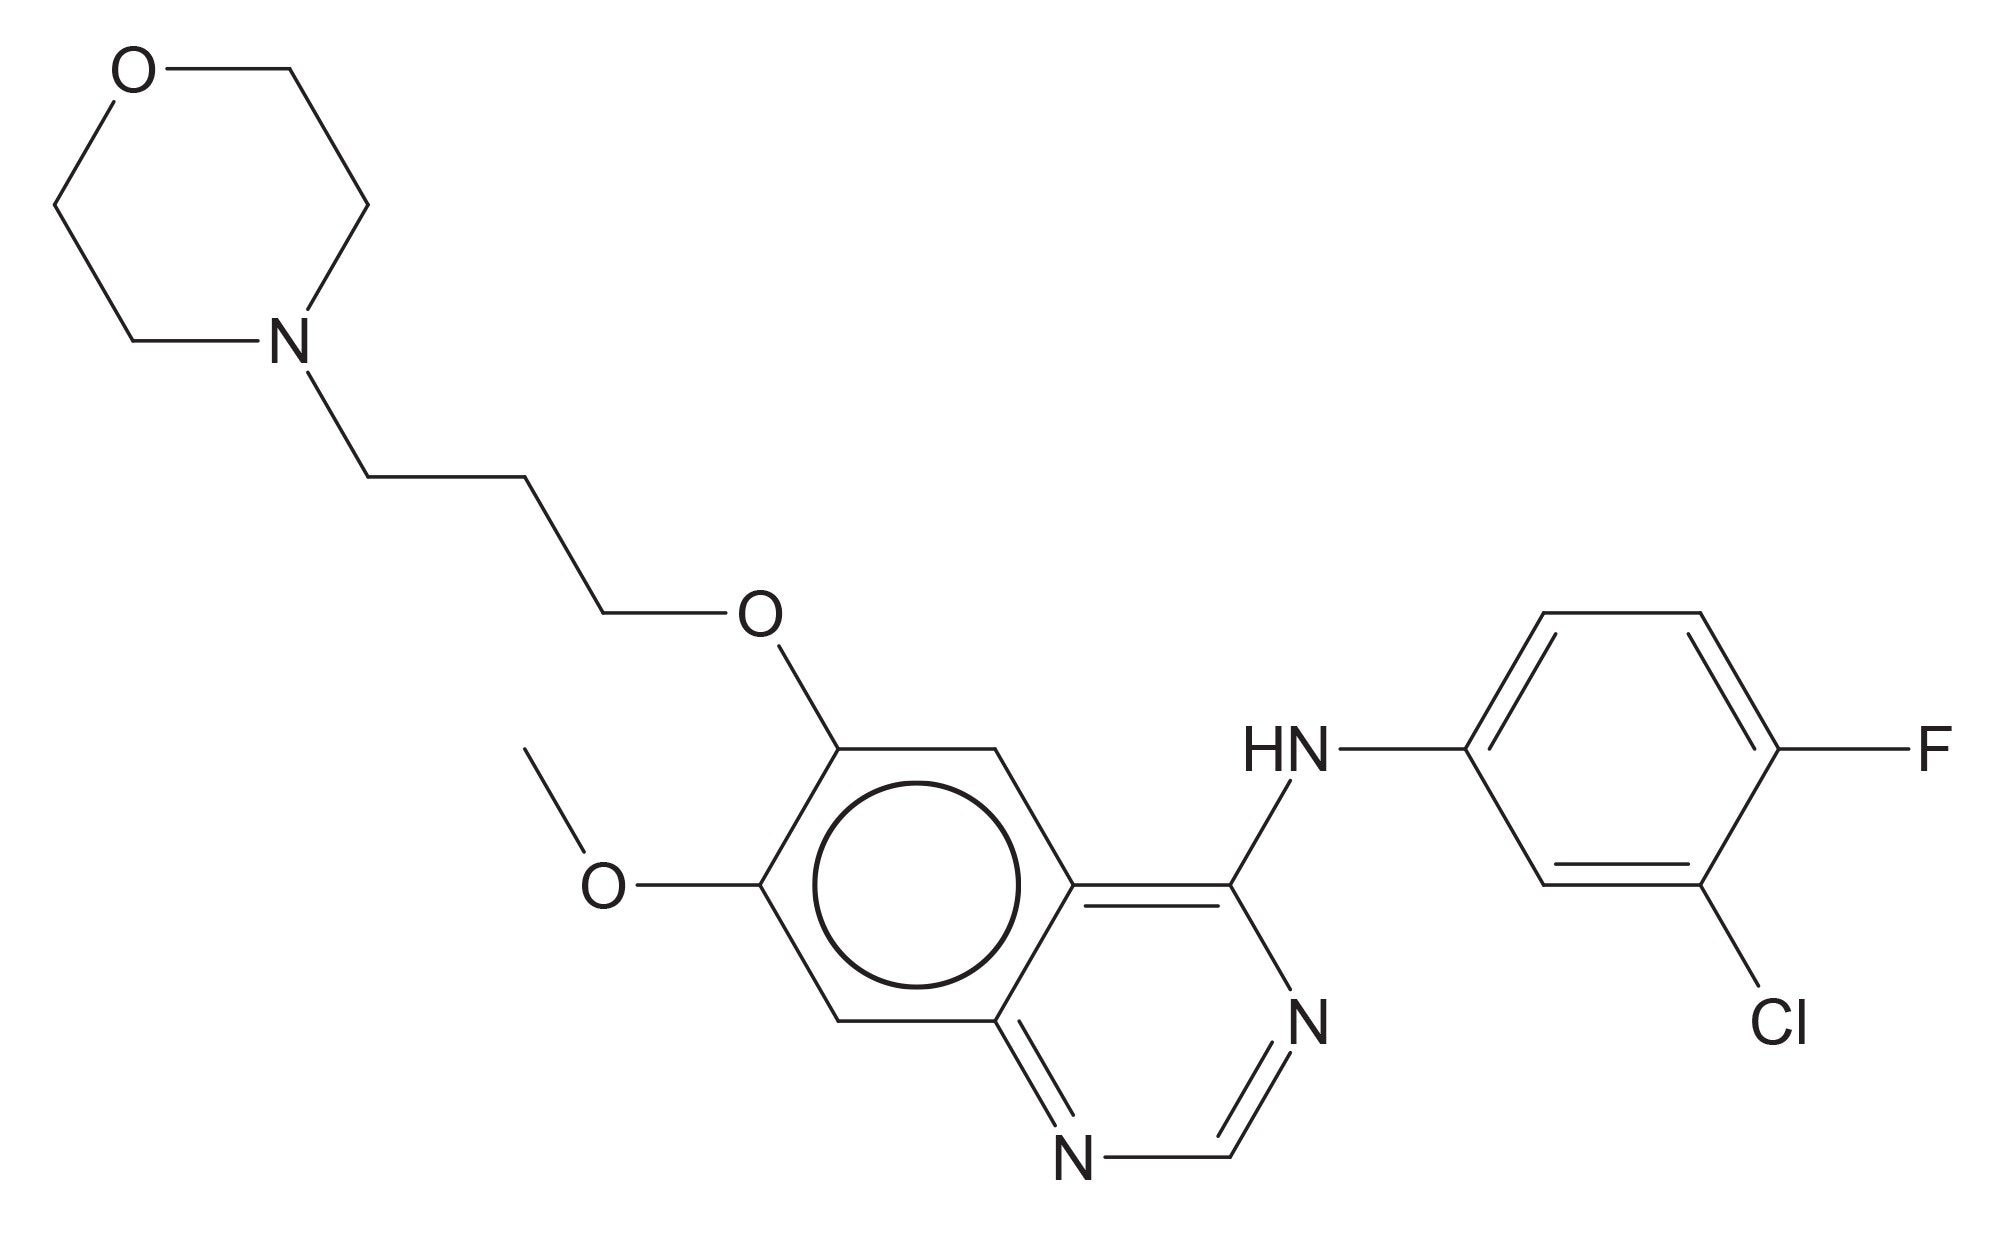
Table 1. LC Conditions
|
LC system: |
ACQUITY Premier UPLC™ Chromatography System |
|
Detection: |
Xevo TQ Absolute XR Tandem Quadrupole Mass Spectrometer |
|
Vials : |
CMS Certified Clear Glass 12 x 32 mm Screw Neck Total Recovery Vial (p/n: 600000671CV) |
|
Column(s): |
ACQUITY Premier BEH C18 1.7 µm Column |
|
Column temperature: |
60 °C |
|
Sample temperature: |
10 °C |
|
Injection volume: |
1 µL |
|
Flow rate: |
600 µL/min |
|
Mobile phase A: |
0.1% formic acid (v/v) in 10mM aqueous ammonium acetate and solvent |
|
Mobile phase B: |
0.1% formic acid, 10mM aqueous ammonium acetate (v/v) in acetonitrile |
|
Gradient: |
The column was eluted with a linear reversed–phase gradient of 5–50% B over 2.9 min following an initial 0.5 min hold at 5% B. At 2.91 min the mobile phase composition was increased to 95% B for 1.5 min before returning to the initial conditions of 5% B at 4.4 mins. |
Table 2. Chromatography Gradient Table
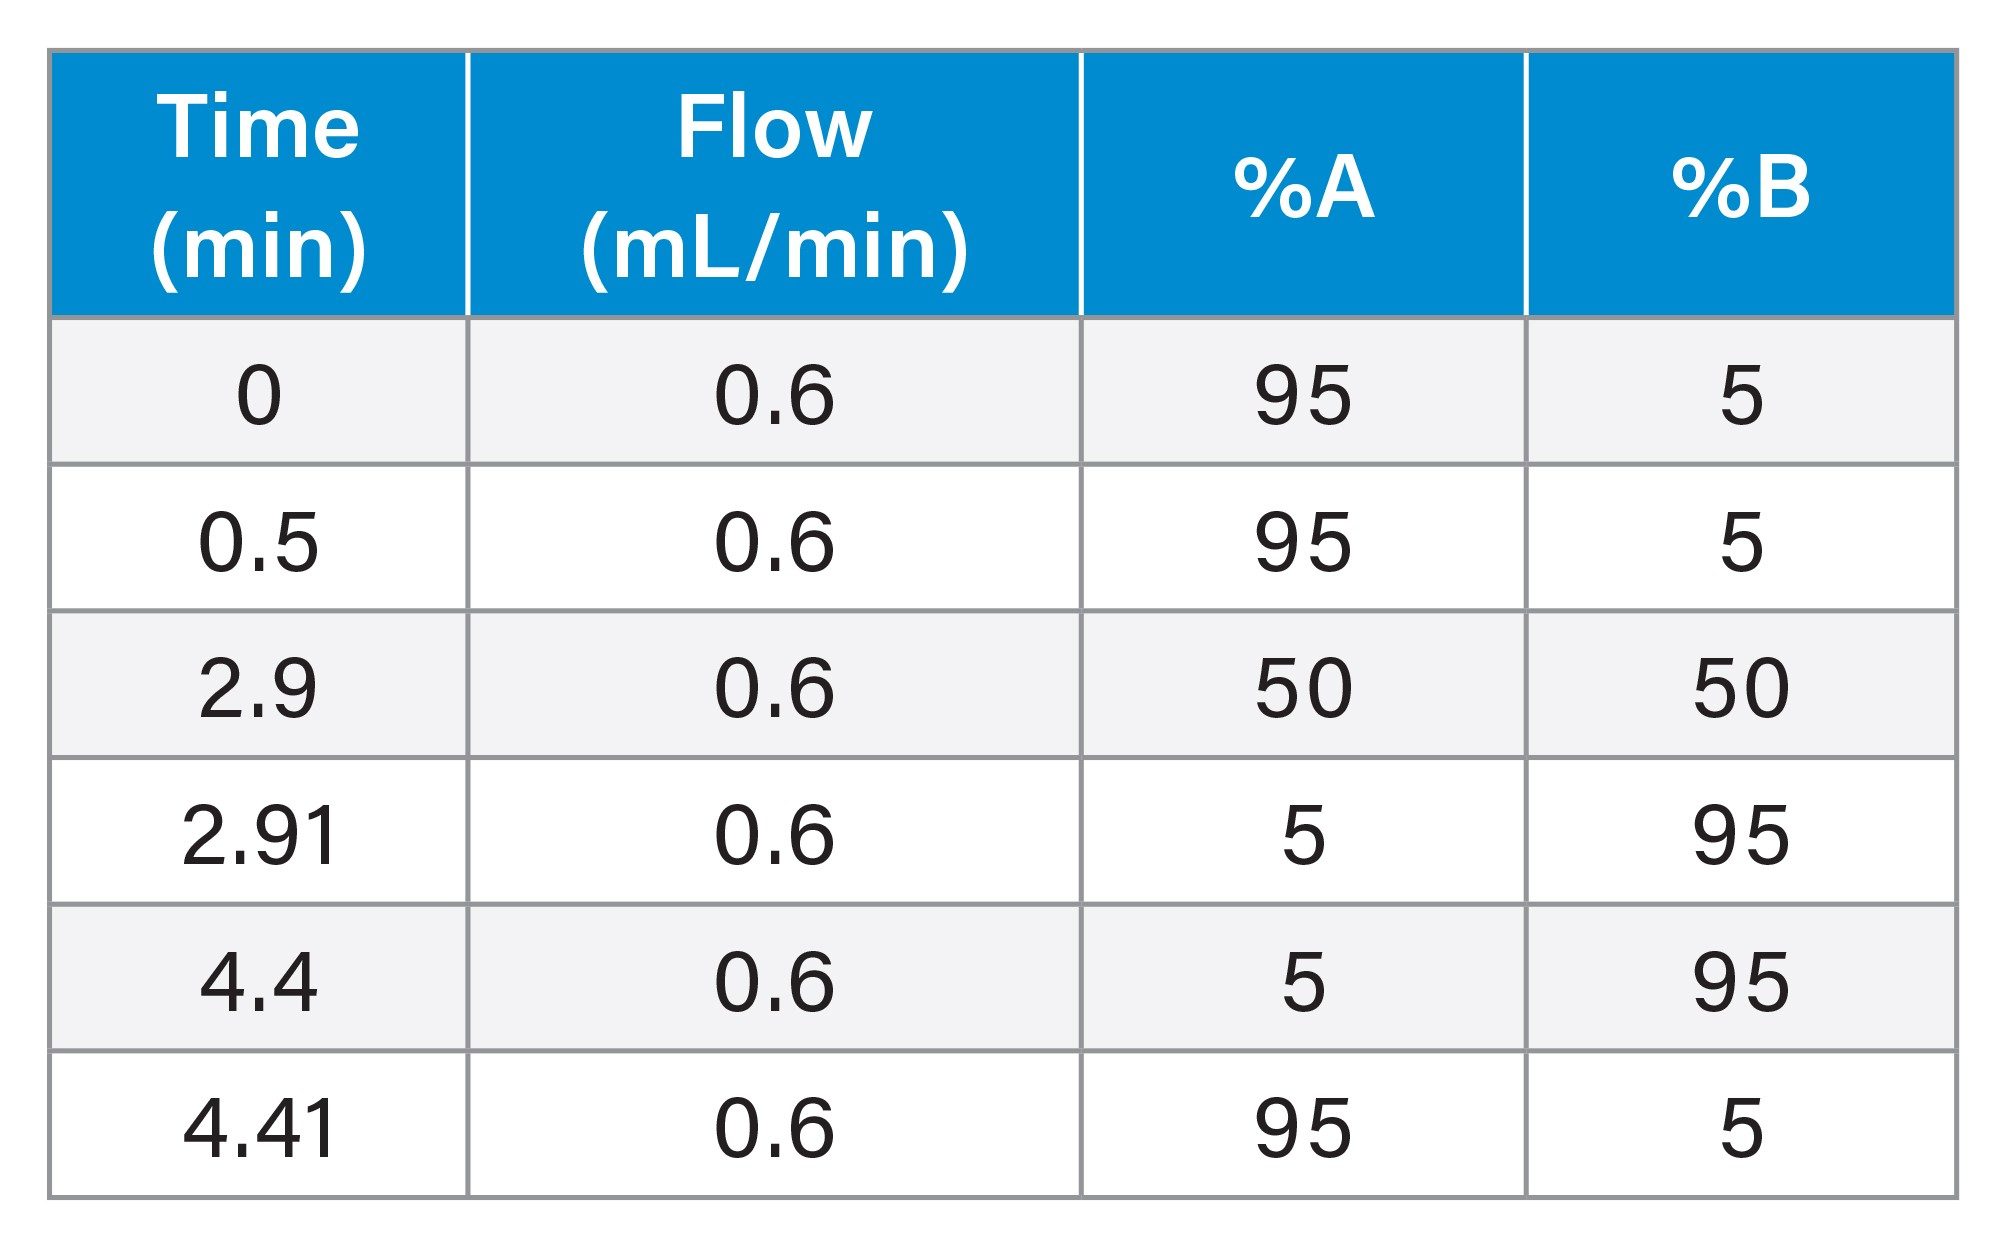
Table 3. MS Conditions
|
MS system: |
Xevo TQ Absolute XR Tandem Quadrupole Mass Spectrometer |
|
Ionization mode: |
ESI + |
|
Acquisition range: |
MRM |
|
Capillary voltage: |
1 KV |
|
Collision energy: |
Compound dependent |
|
Cone voltage: |
Compound dependent |
Table 4. Data Management
|
Chromatography software: |
waters_connect for Quantification Software |
|
MS software: |
waters_connect for Quantification Software |
|
Informatics: |
waters_connect MS Quan v 2.3 |
Results and Discussion
Gefitinib, (Iressa® N-(3-chloro-4-fluorophenyl)-7-methoxy-6-(3-morpholinopropoxy)quinazolin-4-amine (C22H24ClFN4O3)) is tyrosine kinase inhibitor marketed for the treatment of non-small cell lung and other cancers.3-5 It acts by interrupting cell signalling through the epidermal growth factor receptor (EGFR) in target cancer cells. Previous studies in laboratory animals and humans 4,5 have shown that gefitinib is well absorbed, with a bioavailability of approximately 60% following oral administration. Gefitinib undergoes extensive metabolism via CYPs 3A4, 3A5 and 2D6.[4–5, 6] In some cases, these functionalization reactions undergo further biotransformation to form sulphate and glucuronide conjugates, with O-desmethyl-gefitinib (M523595), morpholino carbonyl metabolite (M605211), desfluoro-phenol (M387783) and M537194 (ring-opening and partial degradation of the morpholine ring) being the major metabolites detected in the circulatory system. The aim of this study was to determine the pharmacokinetics of gefitinib following subcutaneous administration to the male rat at 10 mg/Kg. To support this study, a rapid LC-MS/MS method was developed for the quantification of gefitinib, M523595, M605211, M387783, and M537194 over the range of 1–1000 ng/mL.
MRM Method Development
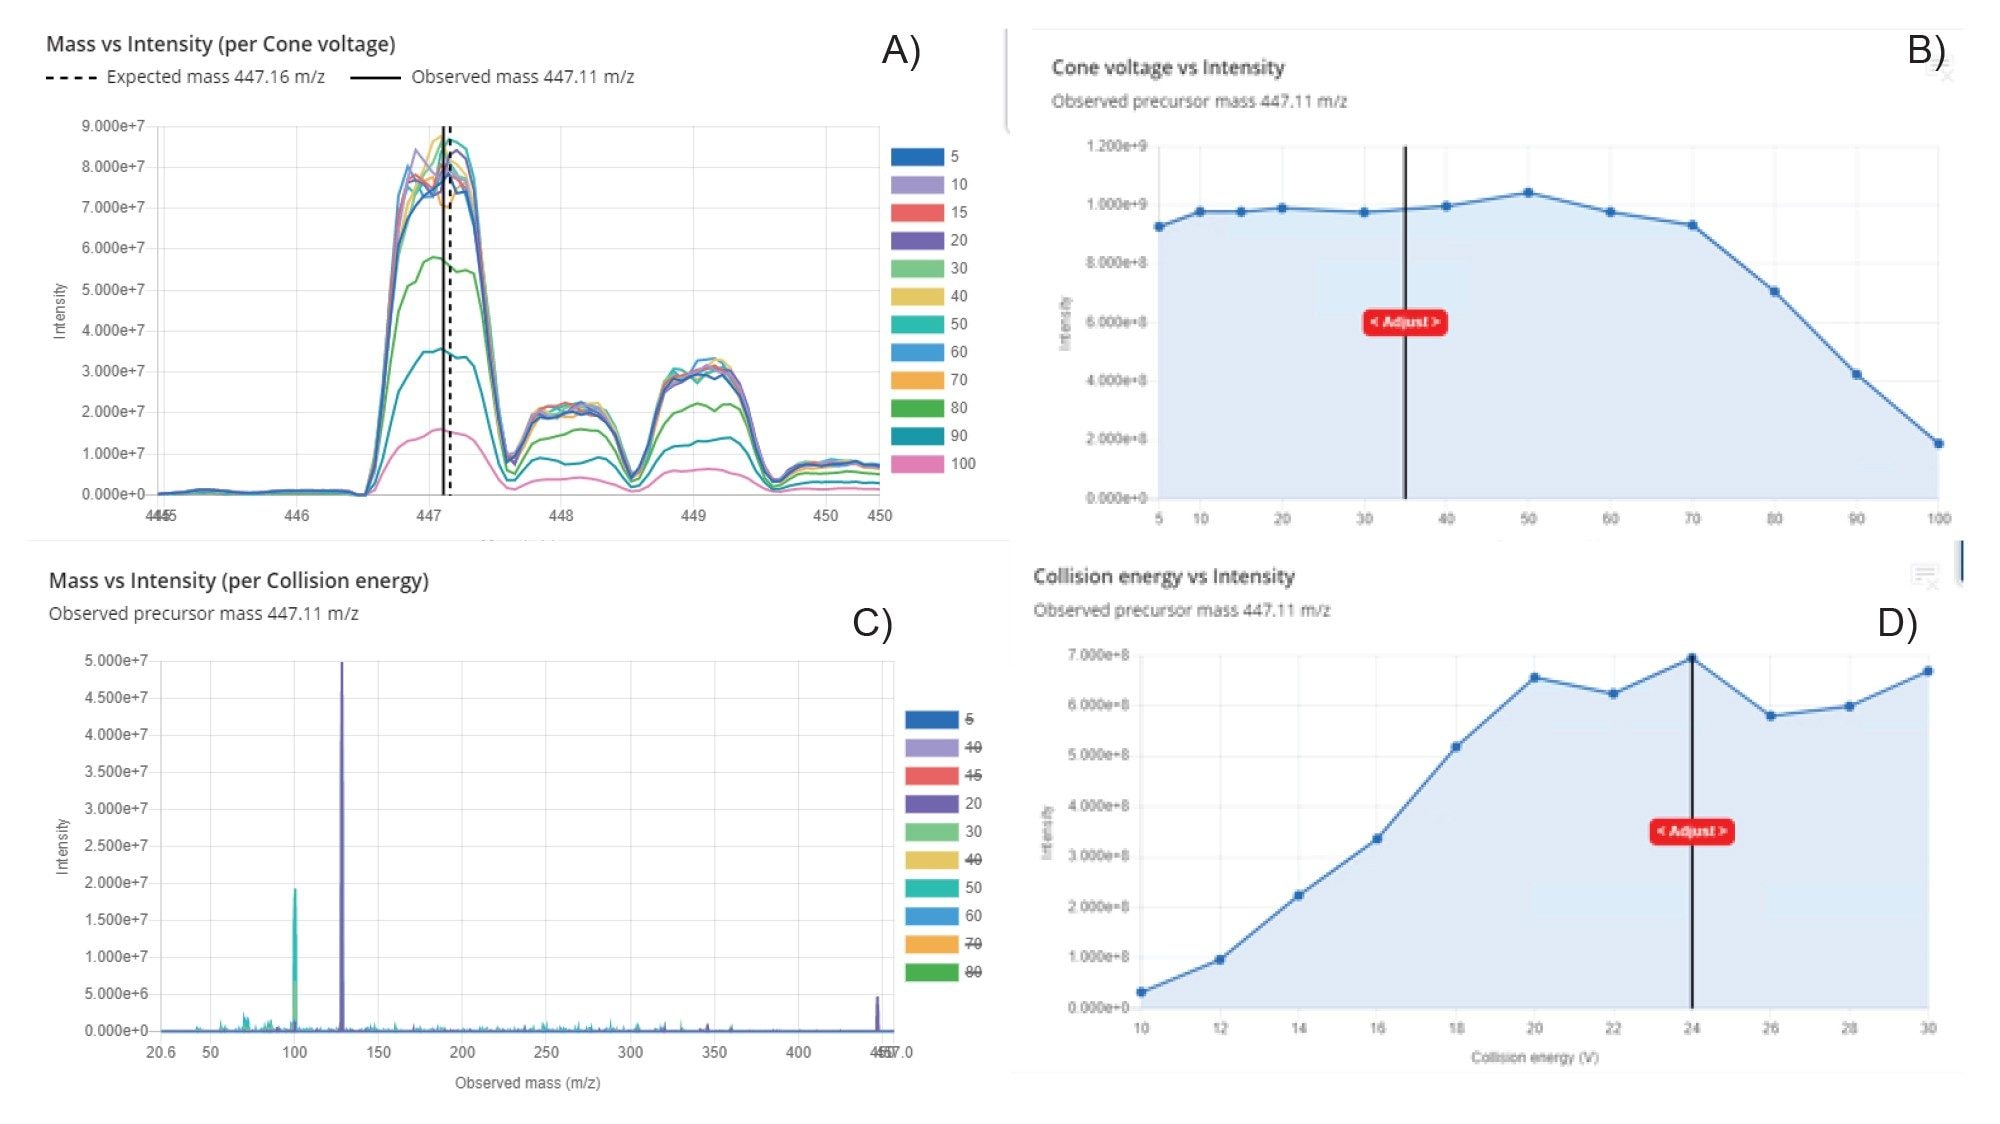
A solution containing gefitinib, gefitinib d6, and O-desmethyl metabolite (M523595) at 100 ng/mL was prepared in methanol:0.1% formic acid (50:50) and infused into the Xevo TQ Absolute XR Mass Spectrometer at 15 µL/min. All three analytes were detected in positive ion mode, with gefitinib, gefitinib d6, and M523595 giving rise to MS1 signals at m/z = 447.16, 453.91, and 433.14 respectively, with a maximum response at 1 KV.
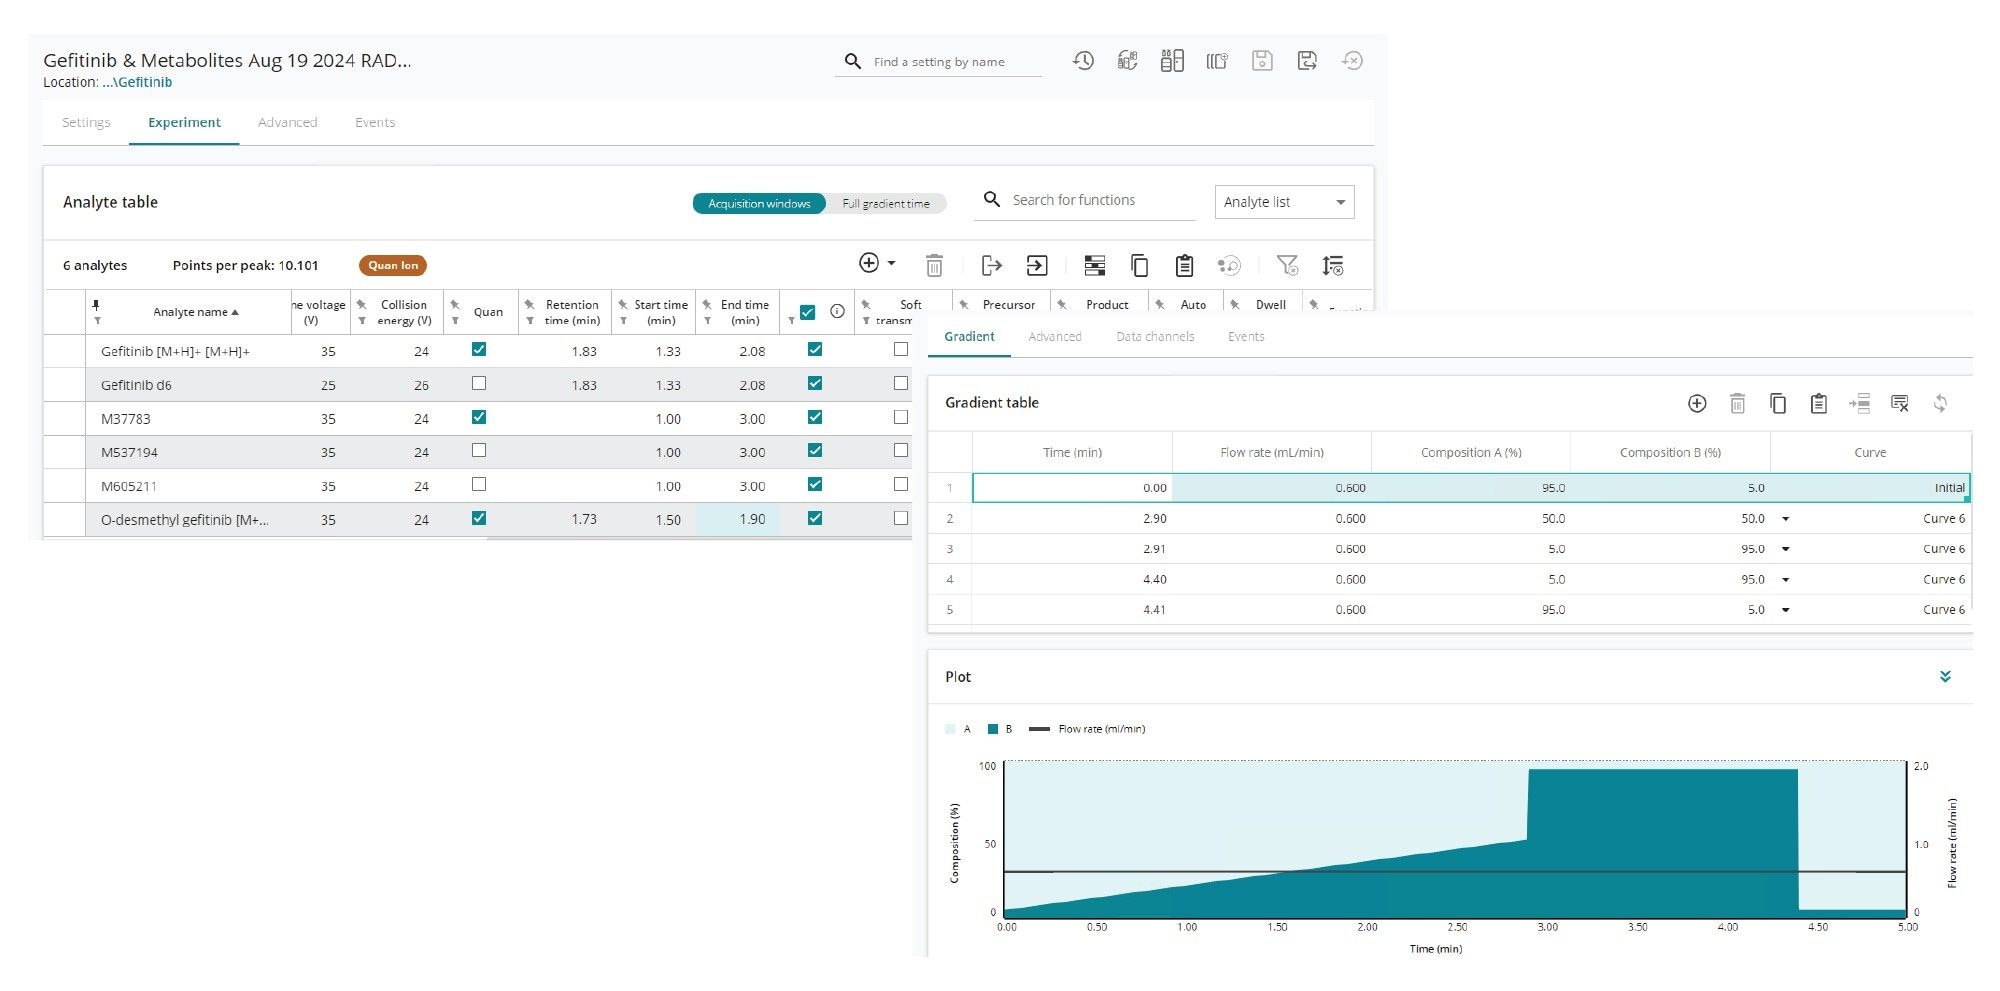
MRM methods were then developed for gefitinib, gefitinib d6, and M523595 using the waters_connect MRM Optimization Tool (see Waters Application Note 720009125). Focusing on each compound sequentially, this optimization tool uses an iterative approach to first detect the precursor ions and any related adducts, then optimize the cone voltage for each of the precursor ions. The next step is to perform product ion discovery and then optimize the collision energy for each of the product ions; the results produced for the MRM optimization of gefitinib are given in Figure 2. The final optimized values are displayed in a summary table from which the MRM transitions of interest were directly exported to the waters_connect Acquisition Method Editor (AME) to generate the LC-MS method (Figure 3). The [precursor ion] → [product ion] CE pairs giving the strongest signal were m/z = 447.11 → 128.01, m/z = 453.40 → 134.01 & m/z = 433.05 → 128.12 for gefitinib, gefitinib d6, and M523595, respectively. As no authentic standards were available for M605211, M387783, and M537194, the MRM transitions for these compounds were obtained from previous publications.6
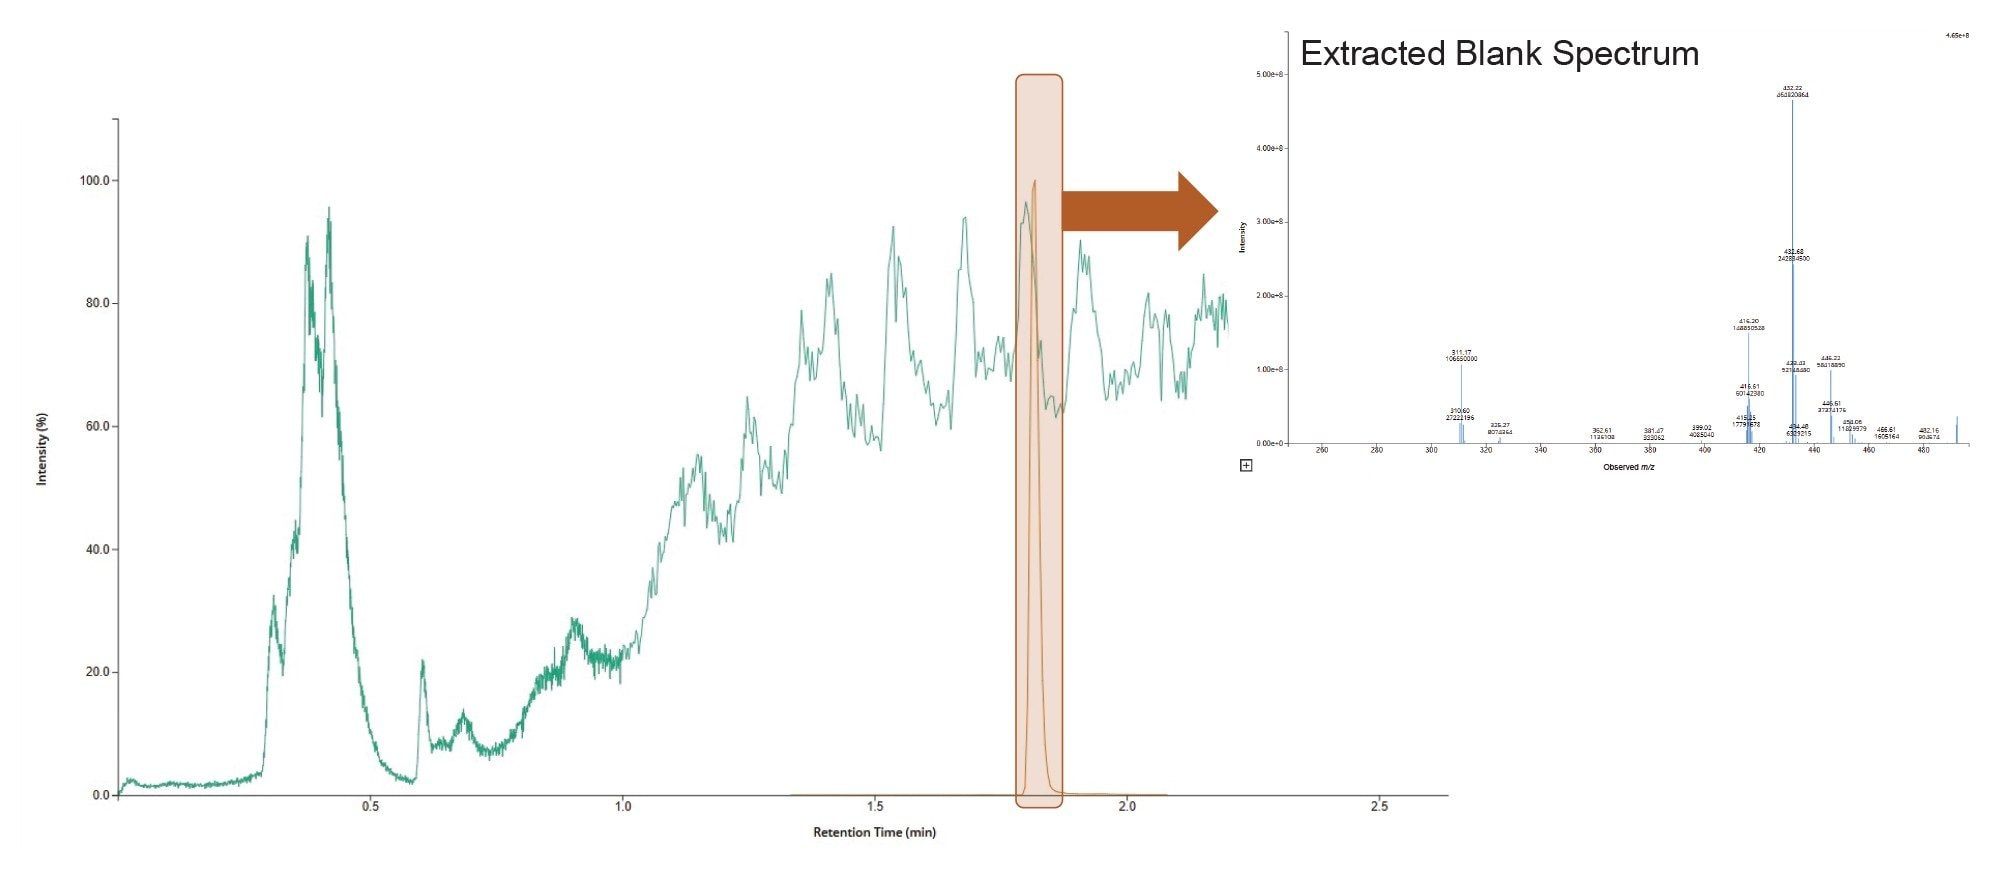
The MRM transitions of interest were further evaluated in blank extracted rat plasma to investigate matrix interference and signal suppression from endogenous compounds in the sample extract. In addition to the analyte MRM transitions, RADAR data acquisition was employed to monitor the background signal from the extracted matrix. The data shows that there were no interfering ions co-eluting with the gefitinib peak (tR = 1.83 min) (Figure 4).
Sample Analysis
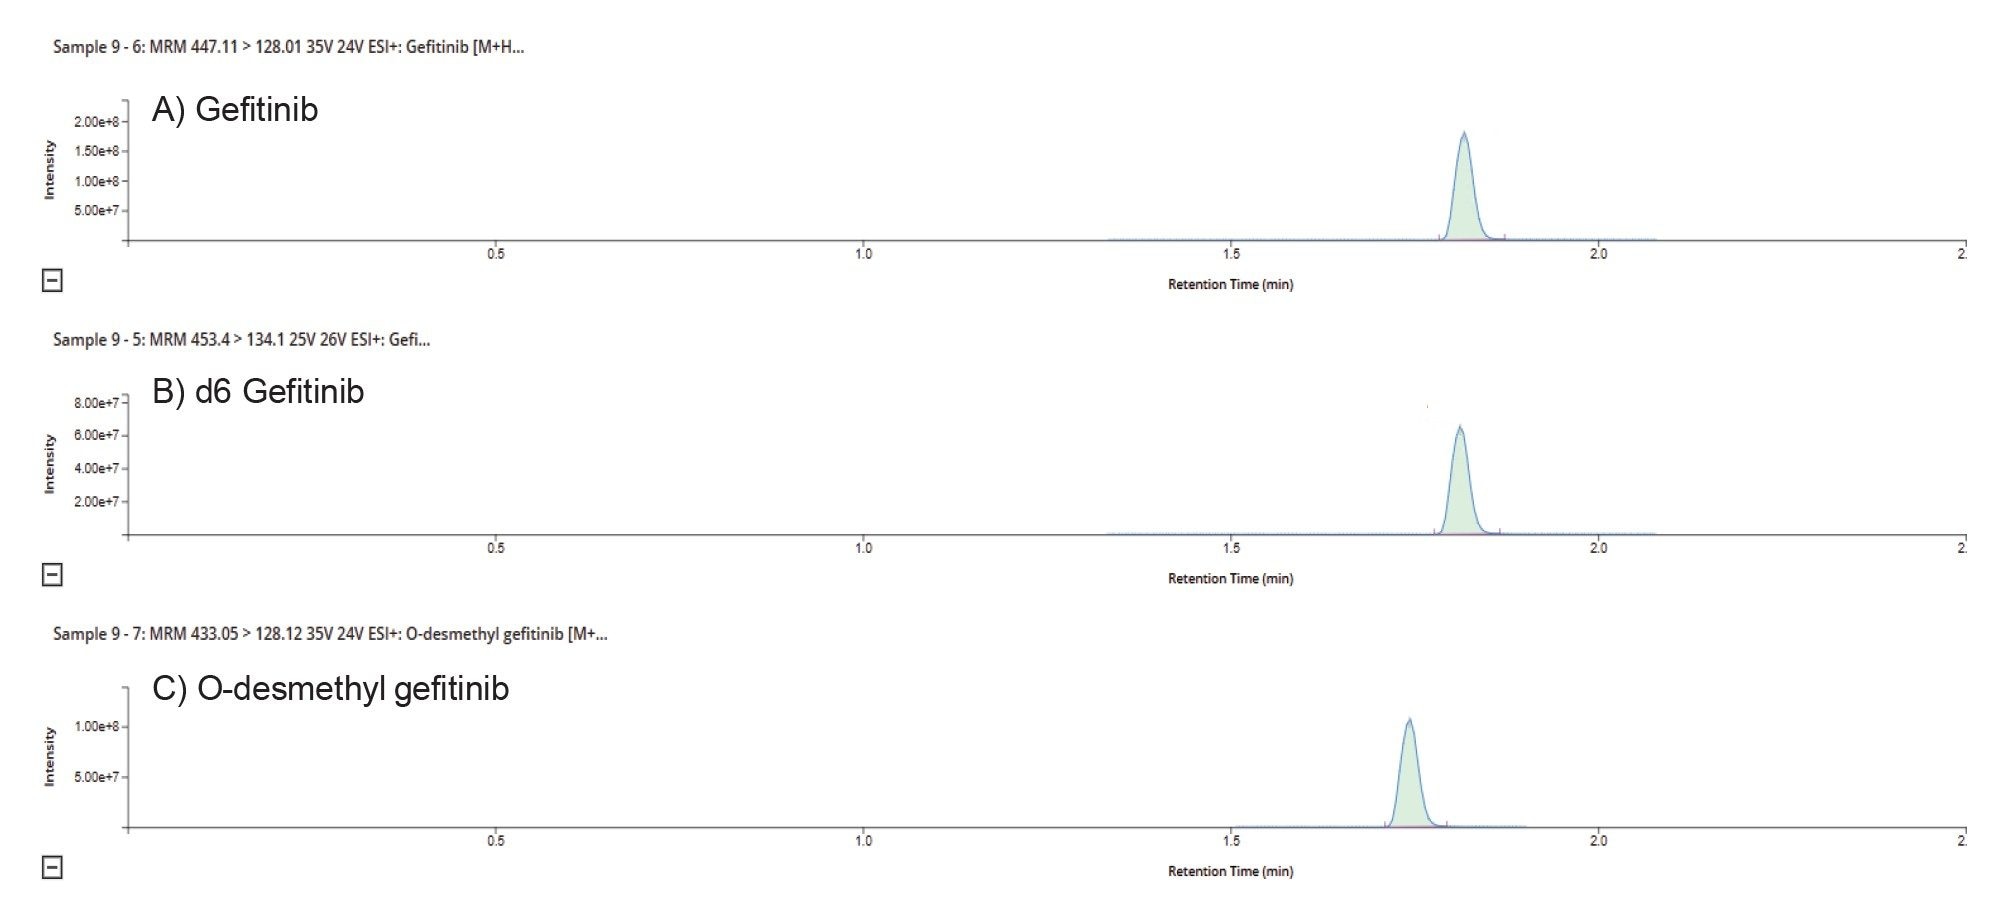
After column equilibration and chromatography–mass spectrometry system suitability checks, the samples were analyzed in the following order solvent blank; double blanks; plasma matrix blank; calibration curve samples (1, 2, 5, 10, 50, 100, 500 & 1000 ng/mL); plasma matrix blank; extracted plasma samples with 6 QCs (2 at each concentration) equally distributed throughout the samples; plasma matrix blank; and a second set of calibration curve samples (1, 2, 5, 10, 50, 100, 500 & 1000 ng/mL). For batch acceptance, the calculated concentration of the QC samples had to be within ±15% of the nominal value, with at least 2/3 achieving this and no more than one failure at each concentration value. Gefitinib and d6 gefitinib eluted from the column with a retention time of tR = 1.83 min and the O-desmethyl metabolite (M523595) eluted with a retention time of tR = 1.76 min (Figure 5). The morpholino carbonyl metabolite (M605211) eluted with a retention time of tR =2.61 min, and the two less abundant metabolites, M387783 (desfluor phenol) and M537194 (ring-opening and degradation of morpholino ring) eluted with retention times of tR = 1.20 and tR = 1.75 min, respectively.
Data Review and Reporting
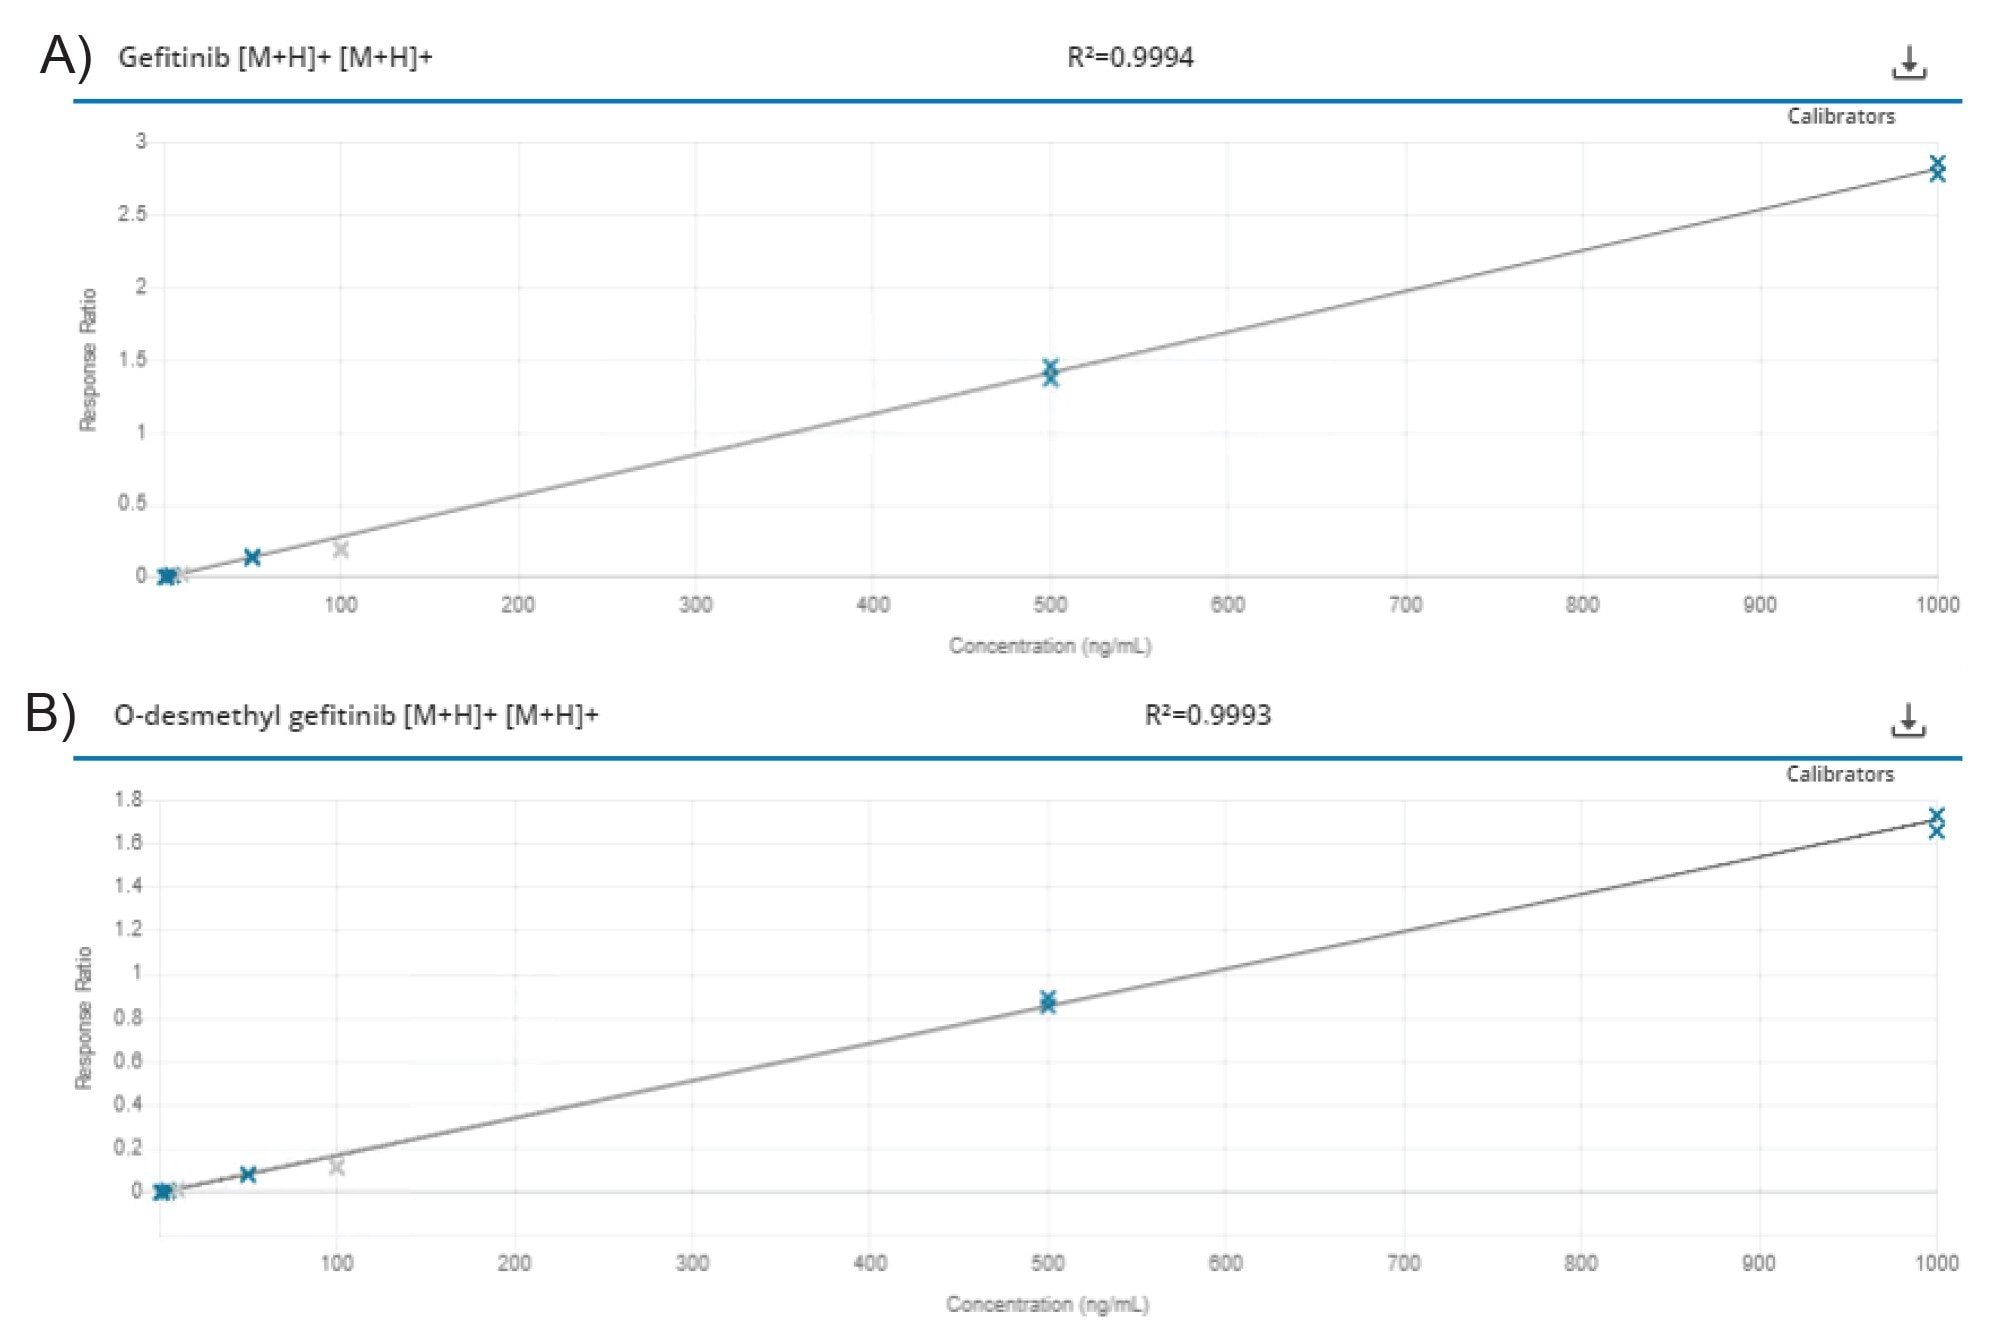
LC-MS/MS data were processed using MS Quan (ver 2.3) Application in the waters_connect for Quantitation Software. Gefitinib was quantified via the use of the d6 gefitinib internal standard; the o-desmethyl metabolite was quantified against a standard curve generated from the authentic standard. As no authentic standard was available for the M605211, M387783, and M537194 analytes, these were quantified against the gefitinib calibration line. Gefitinib response was determined to be linear over the range 1–1000 ng/mL, with R2 = 0.9994 using 1/x weighting and internal standard calibration; the O-demethyl metabolite method was determined to be linear over the range 1–1000 ng/mL (R2 = 0.9993) using 1/x weighting. Representative calibration lines for gefitinib and the O-desmethyl metabolite are shown in Figures 6 A & B, respectively.
Data review can be one of the most time-consuming tasks in bioanalytical sample analysis, and often involves sequentially opening multiple acquisition files and checking the peak integration/baseline allocation. This becomes extremely challenging with large sample batches and analysis with multiple analytes. This process is simplified within the waters_connect for Quantitation Software using MS Quan. Following data acquisition, the LC-MS/MS data are processed using the analysis method, which contains information on (1) analytes (name, retention time, MRM transition), (2) standard and QC concentration levels, (3) processing parameters (thresholds, RT tolerance, smoothing) and (4) integration settings (automatic, liftoff, touch down, force peak). Following peak integration, the results were visualized in the MS Quan results viewer. The dashboard view provides a summary of the batch, including calibration lines, QC residuals, and any exceptions. Other review options allow for cals & QCs, blanks, internal standard, peak integration review, and results reporting.
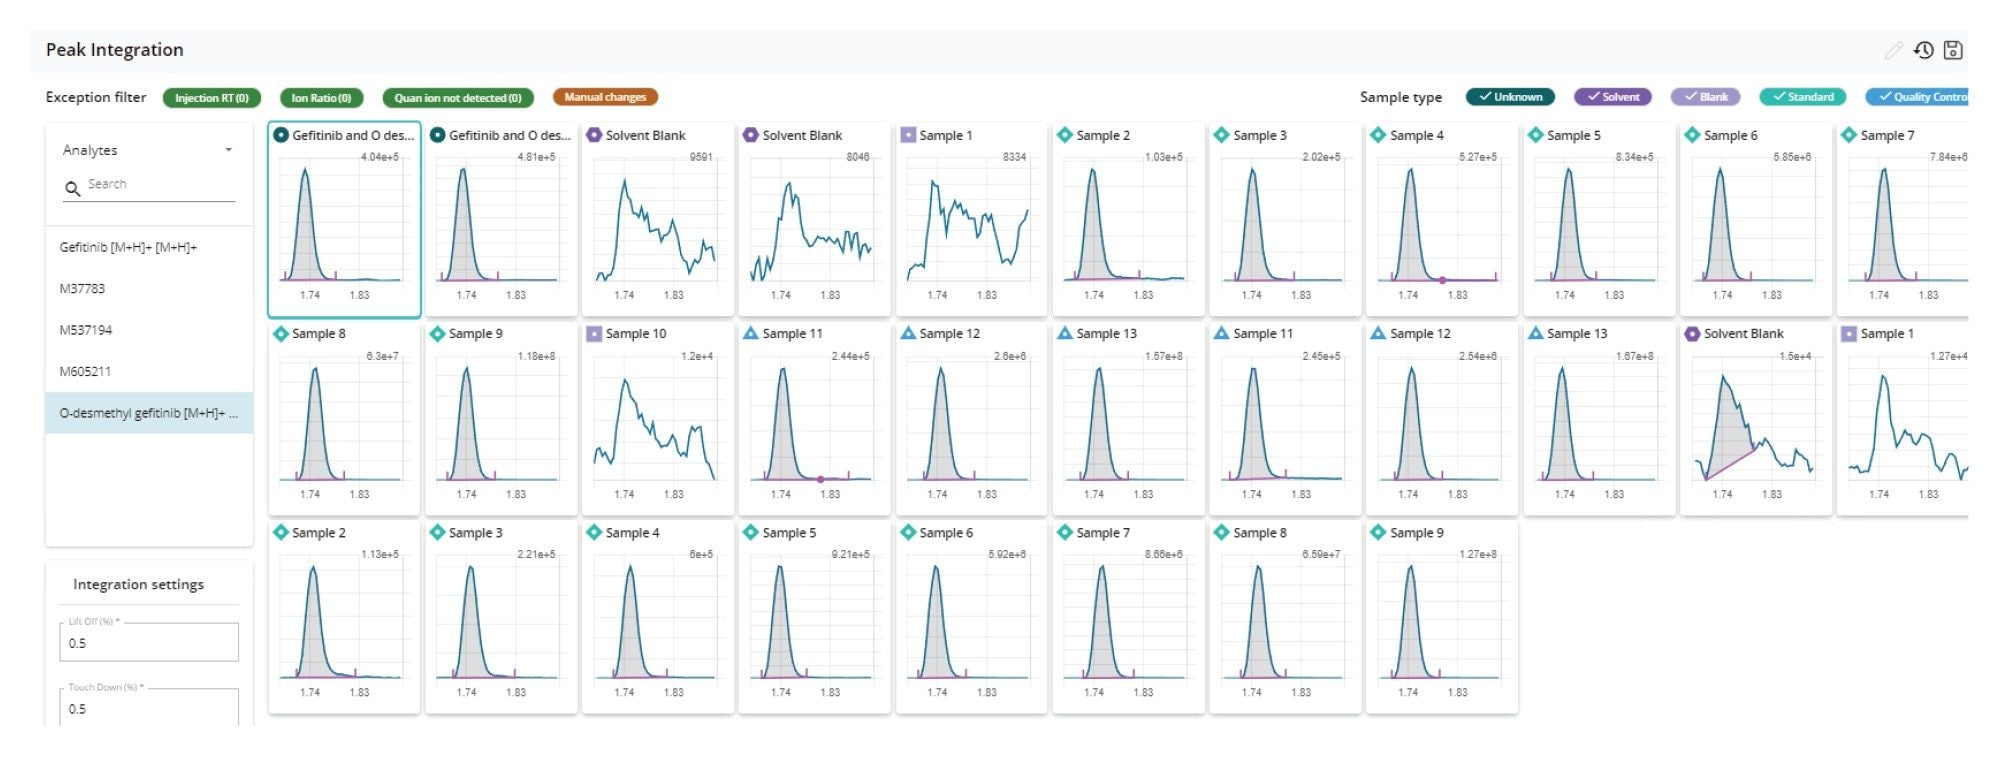
In the peak integration view, the baseline allocation for all the injections can be reviewed in one pane by compound (MRM transition) as illustrated in Figure 7 for the review of the O-desmethyl metabolite of geftinib (m/z = 433.05 → 128.12). This pane can also be further filtered to show just the unknowns, standards, QCs, or blanks. In this view, individual peak integration for the whole sample set can be quickly reviewed and changed as necessary. A rule set can be employed in the processing method to flag samples that fall outside acceptance criteria, such QC concentration exceeding the nominal value by ±15%, a missing internal standard, retention time variation outside acceptable limits, and others. These criteria can be used to quickly filter the results view, allowing the scientist to concentrate on these issues first.
After data review the derived concentration values, results, can then be exported either via the reporting function or via the injection review tab, or exported to a LIMS system. Analysis of the results showed that calculated concentration for all of the QCs, for both gefitinib and the O-desmethyl metabolite, were within the ±15% of the nominal value.
Pharmacokinetics
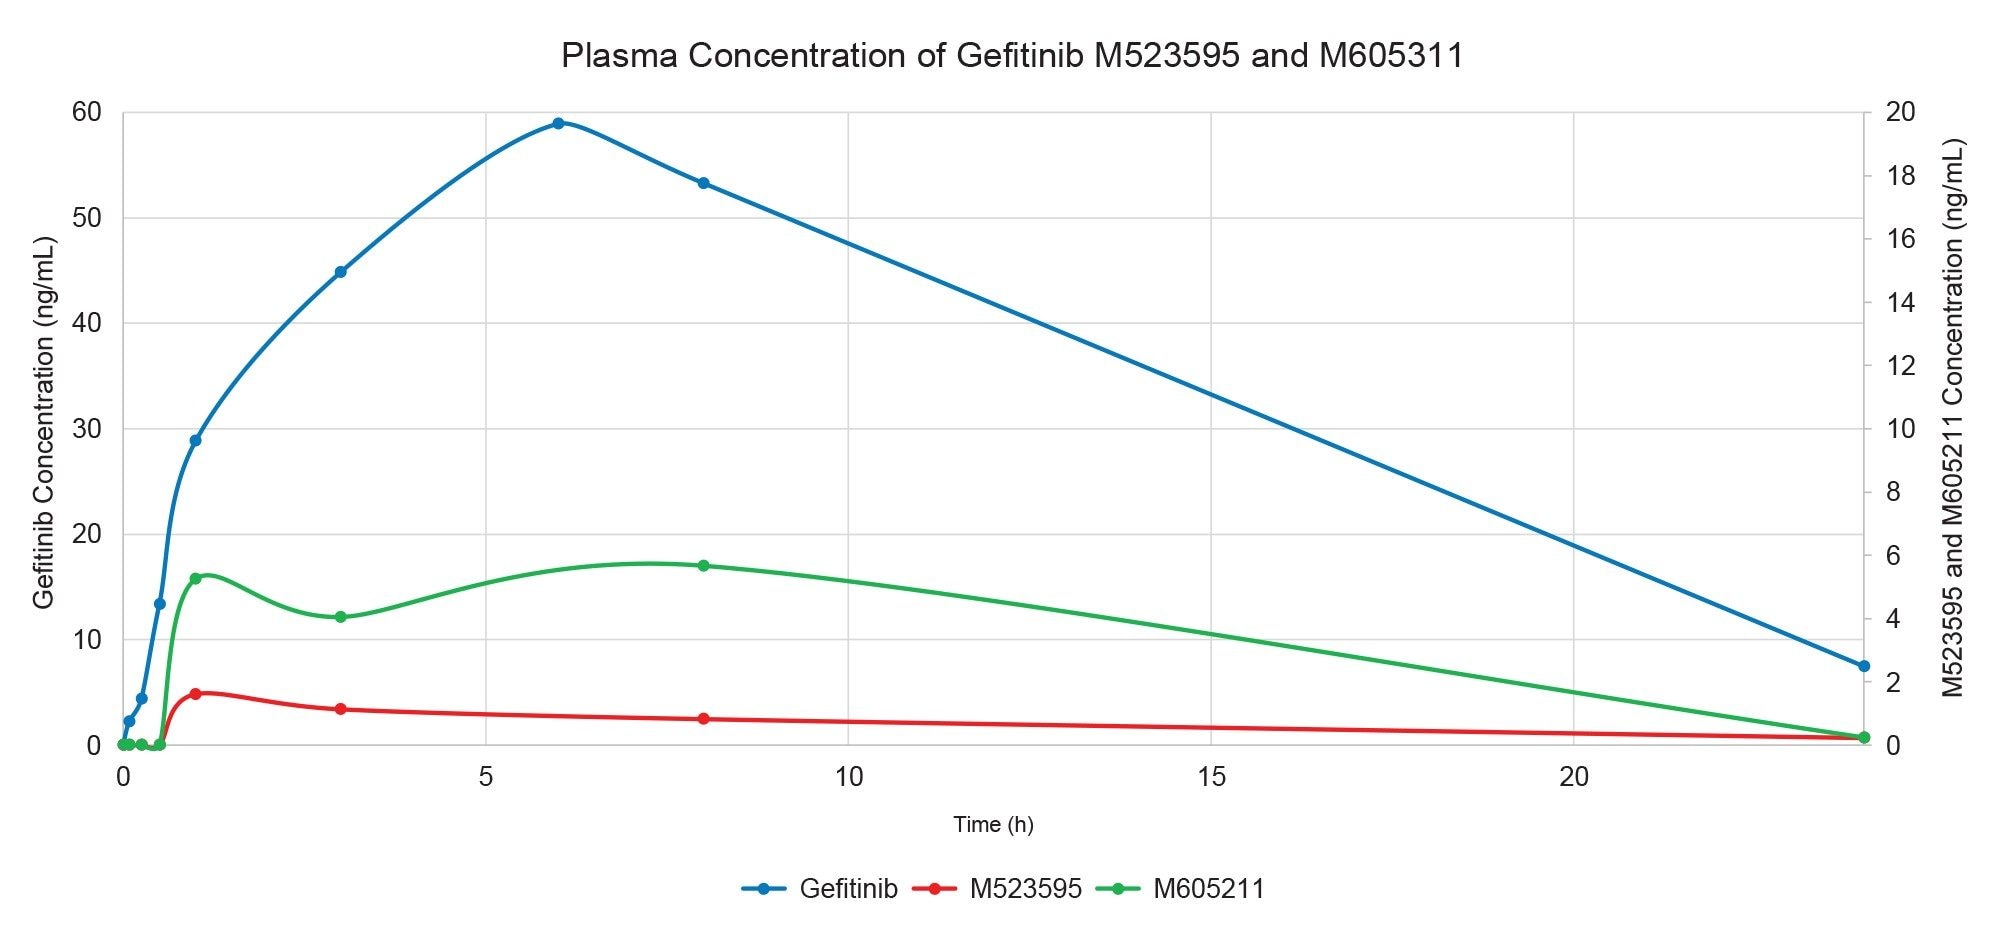
The resulting drug concentration data from the individual animals were combined to give a plasma concentration vs time (0–24 h) profile for gefitinib and major metabolites. Following dosing, the concentration of gefitinib steadily increased, reaching a peak plasma concentration of 58.9 ng/mL at the 6 h time point, after which it slowly decreased but was still detectable at the 24 h time point. The half-life (T1/2) of gefitinib was determined to be 6.5 h with an AUC0-t of 670 ng/mL/h. M387783 (desfluoro-phenol) and M537194 (morpholine ring cleavage) metabolites were detected but were below the limit of quantification (0.35 ng/mL) in all the study plasma samples. The O-demethylated metabolite (M523595) showed a peak concentration of 1.72 ng/mL, T½ = 8.1 h, and AUC 0–t 17.2 ng/ml.h, whereas the morpholino carbonyl metabolite (M605211) gave a peak concentration of 6.0 ng/mL, T½ = 3.8 h and AUC 0–t 88.2 ng/ml.h.
Conclusion
The accurate determination of the pharmacokinetics of a compound in preclinical drug development and in human testing is essential for efficient compound evaluation. The process of developing an LC-MS/MS method to support drug quantification in biofluids and processing the study samples can be challenging and time-consuming. The waters_connect for Quantitation Software has been specifically designed to streamline the process method development, data acquisition, and results reviewing. The MS optimization tool in waters_connect for Quantitation Software automates and simplifies the process of [Precursor ion] → [Product ion] CE pair optimization, and the RADAR functionality quickly screens the MRM transitions for matrix interference. Following data acquisition, the waters_connect MS Quan provides a data-driven approach to processing and data analysis. Results can be filtered to allow the DMPK scientist to focus on any potential issues, such as calibrants, QCs, and missing peaks first. The waters_connect for Quantitation Software was used with the Xevo TQ Absolute XR Mass Spectrometer and ACQUITY Premier UPLC System to develop a rapid quantification method for gefitinib and its major metabolites in plasma and quantify plasma samples from a rat pharmacokinetic study.
References
- Molloy BJ, King A, Gethings LA, Plumb RS, Mortishire-Smith RJ, Wilson ID. Investigation of the pharmacokinetics and metabolic fate of Fasiglifam (TAK-875) in male and female rats following oral and intravenous administration. Xenobiotica. 2023;53(2):93–105. doi: 10.1080/00498254.2023.2179952.
- Hu, Y., Xue, X., Han, T. et al. An effective system for senescence modulating drug development using quantitative high-content analysis and high-throughput screening. Commun Biol 8, 1316 (2025). https://doi.org/10.1038/s42003-025-08758-6.
- Dhillon S. Gefitinib: a review of its use in adults with advanced non-small cell lung cancer. Target Oncol. 2015: 10: 153–170. doi: 10.1007/s11523-015-0358-9.
- McKillop. D. et al. Pharmacokinetics of gefitinib, an epidermal growth factor receptor tyrosine kinase inhibitor, in rat and dog. Xenobiotica, 34(10), 901–915, 2004. doi: 10.1080/00498250400009189.
- McKillop, D. et al. Metabolic disposition of gefitinib, an epidermal growth factor receptor tyrosine kinase inhibitor, in rat, dog and man. Xenobiotica, 34, 917–934. (2004). doi.org/10.1080/00498250400009171.
- Molloy BJ, King A, Mullin LG, Gethings LA, Riley R, Plumb RS, Wilson ID. Rapid determination of the pharmacokinetics and metabolic fate of gefitinib in the mouse using a combination of UPLC/MS/MS, UPLC/QTof/MS, and ion mobility (IM)-enabled UPLC/QTof/MS. Xenobiotica, 2021: 51: 434–446. https://doi.org/10.1080/00498254.2020.1859643.
Acknowledgements
The laboratory animal studies were performed at Evotec LTD (Macclesfield, UK) under UK Home Office License PP9552589 Protocol 2-Pharmacokinetic Study, with full management and local ethical committee review.
720009135, November 2025