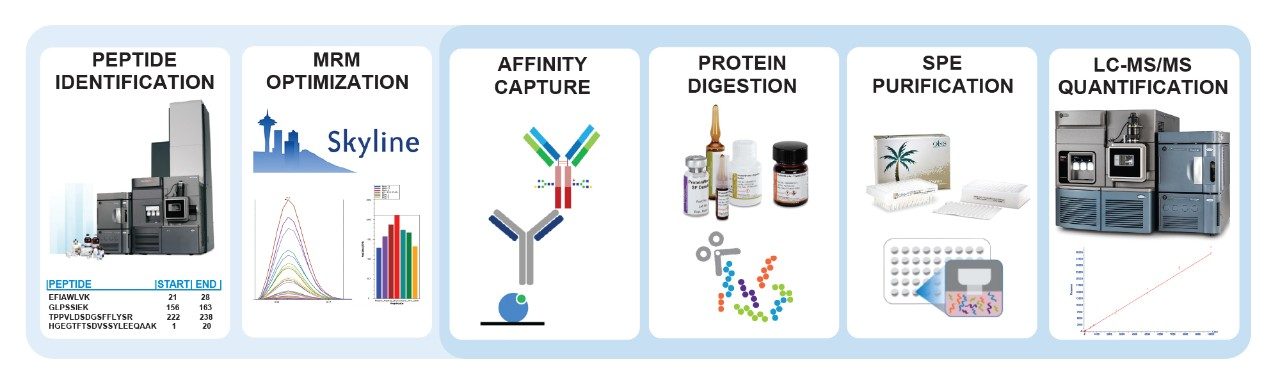
• 應用手冊

How to Maximize Bioanalytical Performance of Fc-Fusion Proteins: Practical Sample Preparation and LC-MS/MS Workflows for Dulaglutide Quantification from Plasma

How to Maximize Bioanalytical Performance of Fc-Fusion Proteins: Practical Sample Preparation and LC-MS/MS Workflows for Dulaglutide Quantification from Plasma

  • Caitlin Dunning
  • Mark Wrona
  • Waters Corporation

Abstract

This application note describes a complete sample preparation workflow for quantitative assay development of Fc containing therapeutics. With an Fc specific immunoaffinity capture method, fast and reproducible digestion workflow, and selective SPE, lower limits of quantification of 1 ng/mL using 50 μL of plasma were achieved.

Benefits

  • ProteinWorks Auto-eXpress Low Digest Kits for simple and fast trypsin digestion
  • Oasis PRiME MCX μElution SPE to purify and concentrate samples 
  • ACQUITY UPLC Peptide BEH C18, 300 Å Column to improve peak area and manage peptide carryover 
  • High sensitivity measurement of dulaglutide, achieving 1 ng/mL LLOQ using UPLC separation and a Xevo TQ-XS Mass Spectrometer

Introduction

Glucagon-like peptide-1 (GLP-1) receptor agonists, such as the GLP-1 hormone, have been identified as novel agents for the treatment of Type 2 diabetes. The potential for this hormone as a therapeutic is limited by its short half-life and rapid excretion. However, it has been demonstrated that fusion to an Fc moiety can improve these PK characteristics.1 Dulaglutide (TRULICITY) is a fusion of a GLP-1 analogue and IgG4 Fc, developed as an adjunctive therapy to improve glycemic control in Type 2 diabetes patients. Development of mAb and fusion protein therapeutics is rising and there is a need for universal workflows which can be used to rapidly develop quantitative assays in support of preclinical PK studies.2 LC-MS/MS assays are desirable due to their high sensitivity and specificity capabilities. However, upstream method development can still be challenging due to the many sample preparation and acquisition steps which must be assessed and optimized. The work herein describes a complete sample preparation workflow for quantitative assay development of Fc containing therapeutics. With an Fc specific immunoaffinity capture method, fast and reproducible digestion workflow, and selective SPE, lower limits of quantification of 1 ng/mL using 50 μL of plasma were achieved.

Experimental

Sample preparation

Preparation of samples, calibration standards, and QC samples

Calibration curve standards and quality control (QC) samples of dulaglutide were prepared in commercially available rat plasma at various concentration levels (1–10,000 ng/mL). All calibration curve standards and blanks were prepared in duplicate, and all QC levels were prepared in sextuplicate. With the exception of blanks, all samples were spiked with SILu MAb K4 (Sigma, P/N: MSQC7) as the internal standard (ISTD).
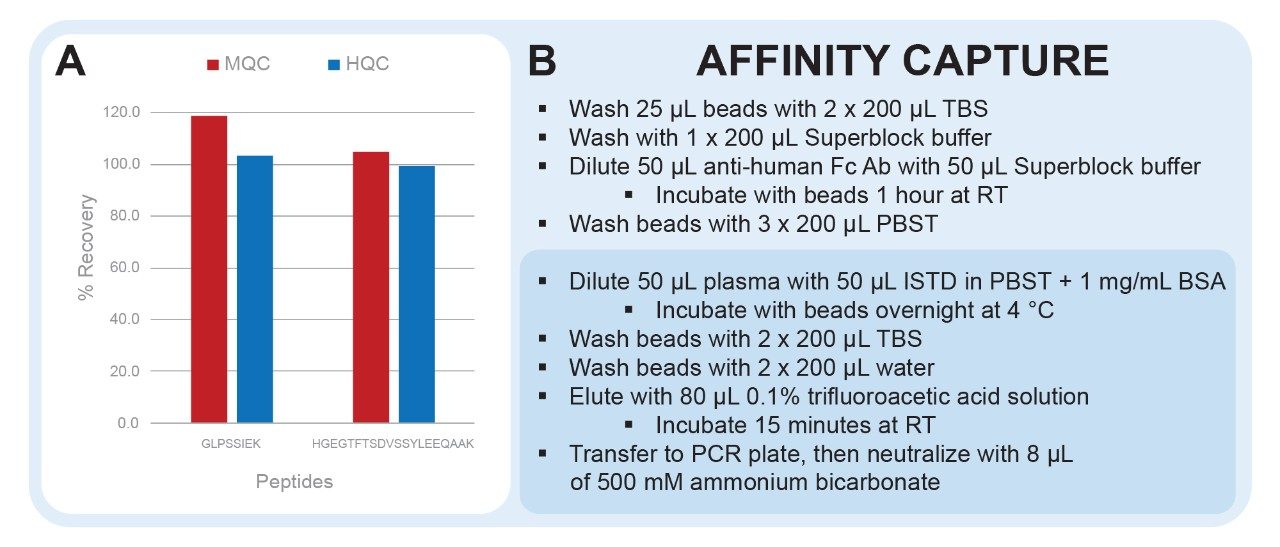
Affinity capture

Dulaglutide and its ISTD were extracted from rat plasma with biotinylated goat anti-human Fc antibody coupled to streptavidin coated magnetic beads (Promega P/Ns V7830 and V7820). Internal standards were prepared at 1 μg/mL in PBST (Thermo Scientific, P/N: 28352 ) with 1 mg/mL bovine serum albumin (BSA). Bead slurry was washed with tris buffered saline (1x TBS pH 7.4, Fisher P/N: BP2471500) and equilibrated with SuperBlock T20 (PBS) Blocking Buffer (Thermo Scientific, P/N: 37516). Biotinylated antibody was diluted with SuperBlock Buffer and incubated for one hour with mixing (1200 rpm) at room temperature. Beads were washed and equilibrated with PBST followed by addition of rat plasma and ISTD. Samples were incubated with mixing overnight at 4 °C, washed two times with TBS, and then washed two times with water to remove salts. The immunopurified samples were eluted from the beads with trifluoroacetic acid and mixed for 15 minutes. Eluates were transferred to a clean PCR plate and then adjusted to pH 8.0.

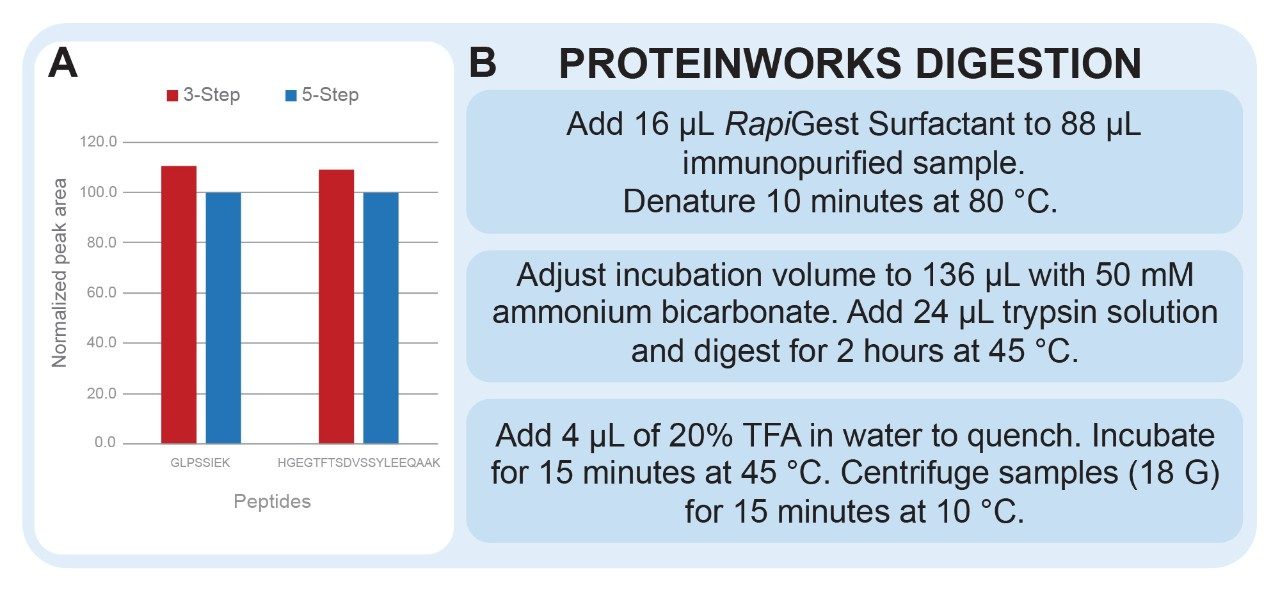
Digestion using ProteinWorks Auto-eXpress Low Digest Kit

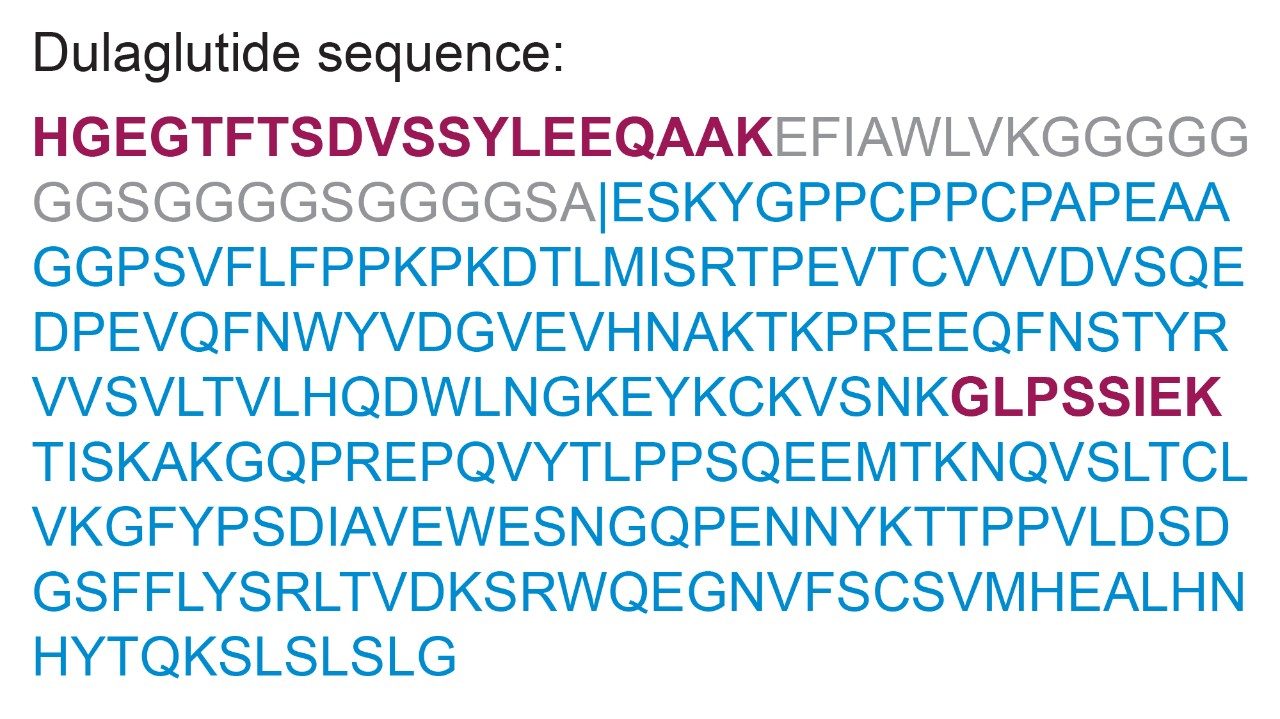
Immunopurified samples of dulaglutide (88 μL) were digested via the ProteinWorks Auto-eXpress Low Digest Kit (P/N: 176004077) using the ‘low volume’ protocol. Briefly, samples were denatured with RapiGest surfactant, digested with trypsin, and the reaction was quenched with acid. Precipitated RapiGest was removed from samples via centrifugation. Final digested sample volume was 164 μL.

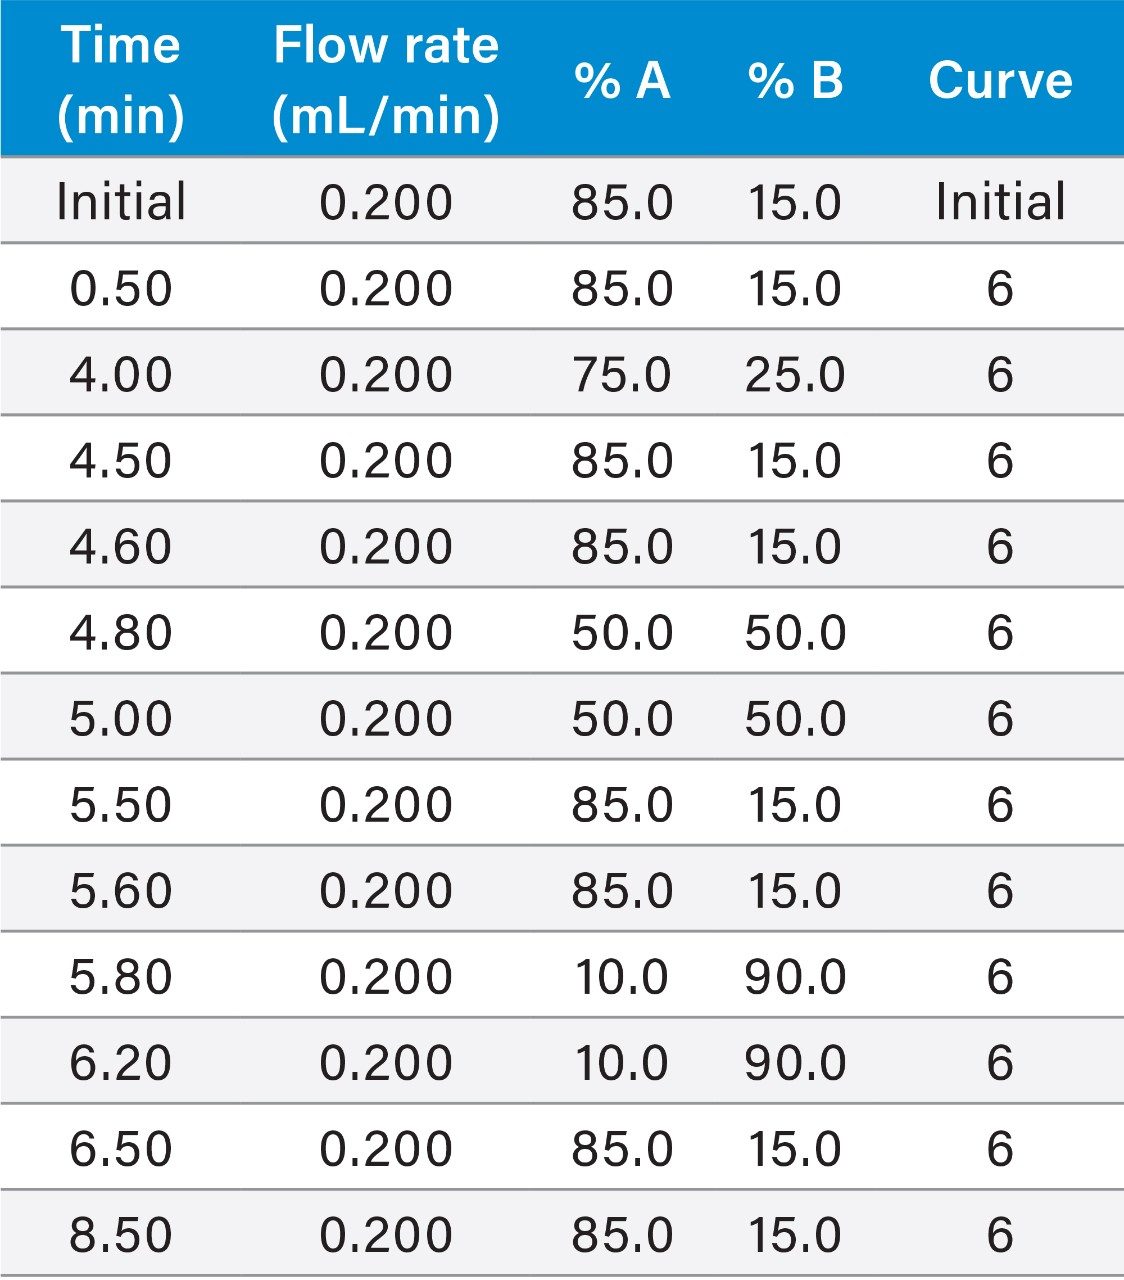
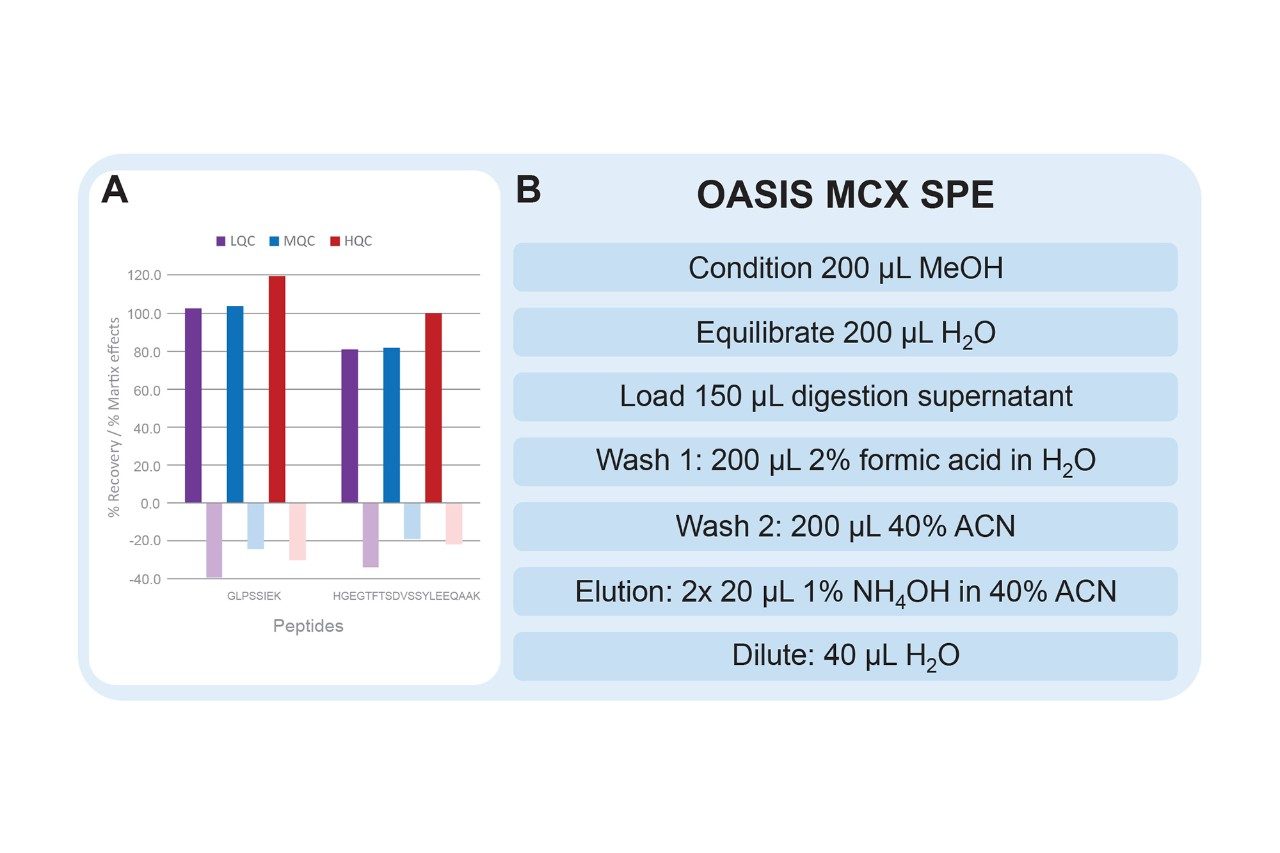
SPE using Oasis MCX 96-well μElution Plate

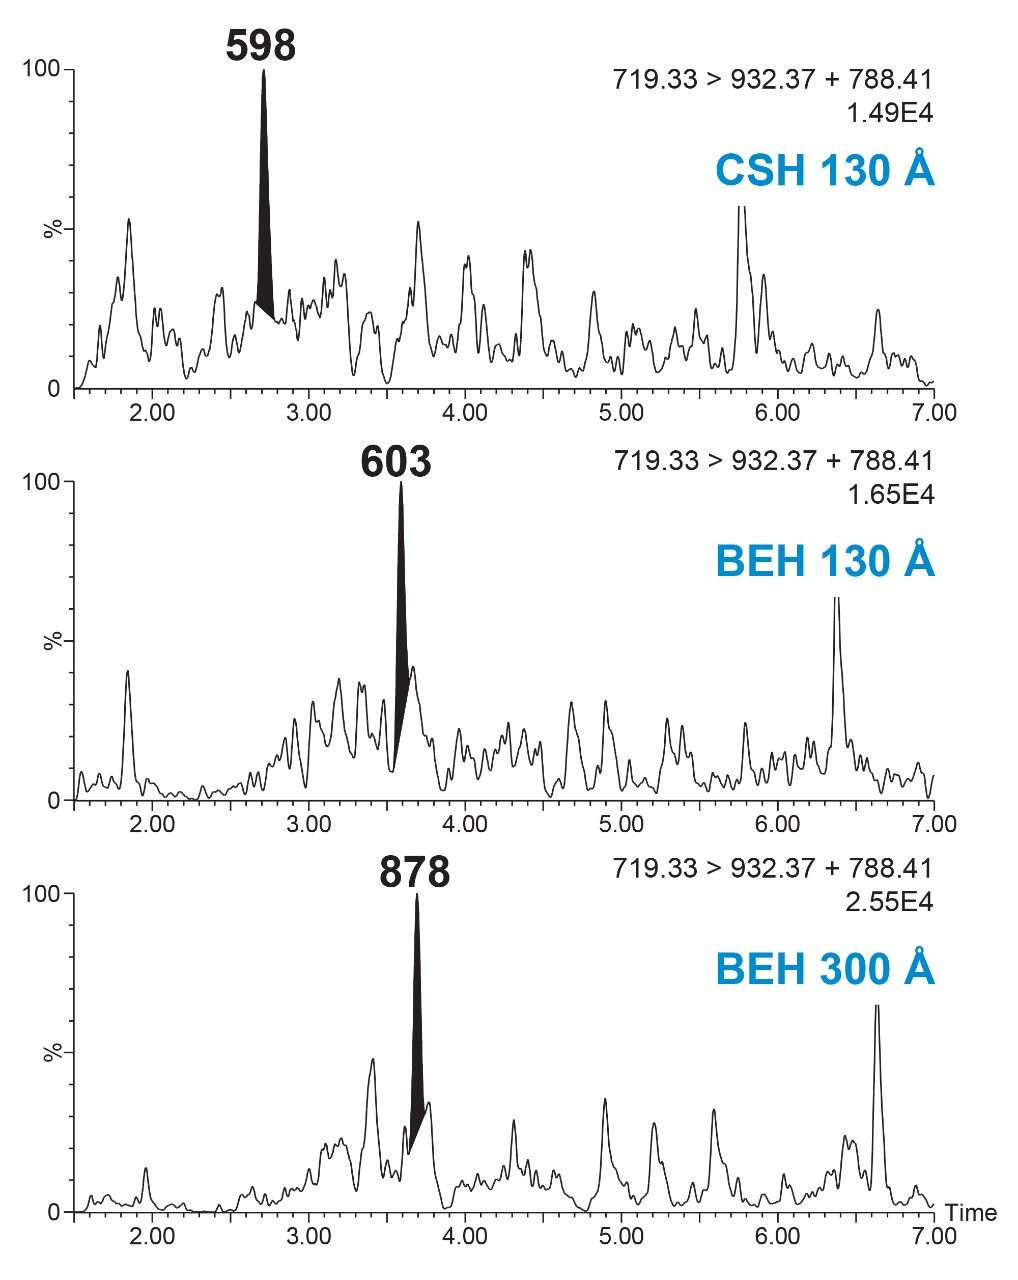
All wells of a 96-well Oasis PRiME MCX μElution Plate (P/N: 186008914) were conditioned with methanol and then equilibrated with water. Digest supernatants (150 μL) were loaded onto the SPE plate, subsequently washed with 2% formic acid in water, and followed by 40% acetonitrile in water. Peptides were eluted from the sorbent using 1% ammonium hydroxide in 40:60 (v/v) acetonitrile:water. Eluates were collected in a QuanRecovery LC-MS compatible sample plate with MaxPeak High Performance Surfaces (P/N: 186009184), and then diluted with water. 15 μL of each sample were injected onto an ACQUITY UPLC I-Class PLUS System equipped with a 2.1 × 100 mm Peptide BEH C18 Column (P/N: 186003686) and a Xevo TQ-XS Mass Spectrometer.

LC-MS/MS method conditions

LC system:

ACQUITY UPLC I-Class PLUS (Fixed Loop)

Detection:

Xevo TQ-XS Mass Spectrometer, ESI+

Column:

ACQUITY UPLC Peptide BEH C18, 300 Å, 1.7 μm, 2.1 × 100 mm

Column temp.:

80 °C

Sample temp.:

10 °C

Injection volume:

15 μL

Mobile phase A:

0.1% Formic acid in water

Mobile phase B:

0.1% Formic acid in acetonitrile

MS system:

Xevo TQ-XS

Capillary:

1.2 kV

Cone:

20 V

Source offset:

30 V

Source temp.:

150 °C

Desolvation temp.:

600 °C

Cone gas flow:

150 (L/Hr)

Desolvation gas flow:

1000 (L/Hr)

Collision gas flow:

0.15 (mL/min)

Nebulizer gas flow:

7.0 bar

Data management:

MassLynx v4.2

Quantification software:

TargetLynx XS

LC gradient:

Results and Discussion

Protein therapeutics can be difficult to extract from biologic matrices and accurately quantify due to the complexity and variability in sample preparation workflows. Often, advanced techniques, from peptide identification to sample preparation (Figure 1), are required to meet the desired limits of quantification. In order to aid in this development process, this work demonstrates and advises on how to develop and optimize preclinical quantification assays for Fc containing therapeutics.

Figure 1. Quantitative assay development workflow utilizing peptide mapping, Skyline MRM optimization, sensitive and selective sample preparation techniques, and a Xevo TQ-XS Mass Spectrometer for LC-MS/MS quantification.

Surrogate peptides must be representative of the protein of interest. To gain an understanding of the entire dulaglutide protein, surrogate peptides were chosen from both the GLP-1 and Fc regions. The N-terminal peptide of GLP-1, HGEGTFTSDVSSYLEEQAAK (HGEG) was chosen as a surrogate for the intact fusion protein containing at least one copy of the GLP-1 sequence. From the Fc region of the protein, GLPSSIEK (GLPS) was chosen as a surrogate for the total Fc level (Figure 2.)

Figure 2. Dulaglutide amino acid sequence highlighted with surrogate peptides used for quantification.3

Once surrogate peptides have been chosen, MRM transitions must be identified and optimized. This can be time consuming and difficult due to the many matrix interferences present in even the cleanest samples. Skyline (MacCoss Labs, University of Washington),4 an open access software, can be used to accelerate this process by comprehensively screening all possible MRMs, and then quickly optimizing the most sensitive transitions for collision energy. In just two days or less, MRMs can be rapidly identified and optimized prior to screening for matrix specificity. Using Skyline, sensitive and selective MRMs for the HGEG and GLPS peptides were identified and optimized for LC-MS/MS analysis via a Xevo TQ-XS Triple Quadrupole Mass Spectrometer. In order to improve signal to noise and reproducibility at the LLOQ, two transitions were summed for the quantification of each peptide. These transitions can be found in Table 1.

Table 1. Mass spectrometry parameters for the quantification of dulaglutide.

Sample Preparation

Affinity capture

To reach low ng/mL levels of quantification, affinity capture is required. The affinity capture protocol demonstrated here (Figure 3, panel B) has been optimized to improve analyte recovery, decrease matrix background, and decrease the effects of non-specific binding. Demonstrated in Figure 2, panel A, excellent recovery was achieved for dulaglutide. 

Figure 3. Immunopurification recovery of dulaglutide at mid and high QC concentrations (Panel A) and affinity capture protocol (Panel B).

Streptavidin coated magnetic beads are blocked with SuperBlock buffer during conjugation of the biotinylated anti-human Fc antibody. This decreases non-specific binding of matrix proteins to the surface of the beads in subsequent steps. Non-specific binding is further mitigated by the addition of 1 mg/mL BSA during the sample incubation step. This will decrease sample losses and improve capture reproducibility. 0.1% trifluoroacetic acid was chosen as the elution solution to ensure maximum recovery. Although this elution solution is strongly acidic, it is still easily neutralized, making it amenable to downstream sample processing such as digestion, which is carried out at pH 8.0.

Tryptic digestion

Protein digestion protocols involve many steps which need to be assessed and optimized. ProteinWorks Auto-eXpress Digest Kits and protocols provide an excellent starting point to optimize digestion for quantitative assays (Figure 4, Panel B). Below, we outline which aspects of the ProteinWorks protocol are commonly assessed and explain how these changes can improve quantitative results.

Reduction and alkylation of proteins is commonly employed in digestion protocols. However, when surrogate peptides do not contain cysteine residues, it may not be necessary to include these steps. Demonstrated in Figure 4, Panel A, comparable results were achieved for the quantification of dulaglutide when reduction and alkylation steps were removed. Removing these steps saved one hour of sample preparation time and reduced the overall complexity and chance for error of the assay.  

Figure 4. Peak area comparison of 3-step (denaturation, digestion, quench) and 5-step (denaturation, reduction, alkylation, digestion, quench) ProteinWorks digestion protocol (Panel A). Peak area of 3-step results are normalized to peak area of 5-step results. ProteinWorks ‘low volume’ digestion protocol (Panel B).

Optimization of digestion parameters increases familiarity with the protein of interest and can help to identify undesired experimental artifacts. In our method development experiments (not shown), temperature remained constant, while trypsin amounts and digestion time were varied. As affinity capture methods increase in specificity, the total amount of protein to be digested decreases, and less trypsin is required to achieve complete digestion. ProteinWorks trypsin can be diluted with water and peak area and missed cleavages should be monitored to determine how much trypsin is actually necessary for the assay. Digestion time must also be considered. The combination of RapiGest denaturation and digestion at 45 °C allows for digestion time as short as 2 hours for monoclonal antibodies (~150 kDa). Smaller proteins may require less time to achieve complete digestion and should be assessed. As parameters are varied, it’s important to monitor for missed cleavages and undesired modifications, such as deamidation and oxidation, as these modifications and incomplete digestion can skew quantitative results. For this assay, it was determined that the standard ProteinWorks 3-step protocol provided the best results for quantification of dulaglutide.

SPE

Solid phase extraction (SPE) can remove salts and matrix interferences, and concentrate samples. Tryptic peptides are generally basic due to the C-terminal lysine and arginine residues, making them positively charged under acidic conditions. Due to this, a strong cation exchanger, such as Oasis MCX, will provide the best recovery and removal of matrix interferences.

In order to decrease matrix effects and matrix background, one should optimize the organic wash (Wash 2) and elution solution. A simple experiment which optimizes the percentage of organic solvent to be used aids in determining the maximum amount that can be used without eluting peptides of interest. To further reduce matrix effects, the minimum amount of organic solvent needed to elute peptides, while maintaining maximum recovery, should be used as the elution solution.

The optimized SPE protocol for dulaglutide surrogate peptides is shown in Figure 5, panel B. In comparison to the traditional MCX SPE protocol, a stronger wash solution of 40% acetonitrile was used to improve matrix effects (vs. 5% methanol). An elution solution strength of 40% acetonitrile was required to elute the HGEG peptide which is slightly more hydrophobic than the GLPS peptide. Matrix effects were further improved by decreasing the amount of ammonium hydroxide in the elution solution from 2% to 1% (v/v) (results not shown). This change ensures that some matrix interferences which were more strongly bound to the MCX sorbent are not eluted. With this optimized SPE protocol, excellent recovery of the peptides of interest was achieved (Figure 5, panel A).

Figure 5. SPE recovery and matrix effects of dulaglutide signature peptides at low, mid, and high QC concentrations (Panel A). Optimized Oasis PRiME MCX SPE protocol for the purification of dulaglutide peptides (Panel B).

Chromatography

Adequate separation of the dulaglutide surrogate peptides GLPS and HGEG was achieved with the use of an ACQUITY UPLC Peptide BEH C18, 1.7 μm, 300 Å, 2.1 × 100 mm Column and gradient elution from 15–25% B at 0.2 mL/min and 80 °C. The combination of a large pore size column, low flow rate, and high column temperature were required to effectively manage peptide carryover following high concentration samples. The effect of pore size and column chemistry were determined by screening several columns during method development, as seen in Figure 6. Peptide CSH C18 (charged surface hybrid of BEH) 130 Å and Peptide BEH C18, 130 Å Column performance were compared to the Peptide BEH C18, 300 Å Column. The CSH Column displayed adequate peak area and separation of the HGEG peptide at the LQC level, but blanks (not shown) had co-eluting matrix interferences with high signal, leading to a decrease in the effective assay LLOQ. The BEH 130 Å Column showed similar selectivity and elution profile as the 300 Å column. However, increasing the pore size led to decreased matrix interferences in the blanks and increased peptide peak area by ~1.5x at the LQC. Due to this, the 300 Å column was chosen, as any increase in peak area is especially important at such low concentration levels.

Figure 6. Peak area comparisons of dulaglutide peptide HGEGTFTSDVSSYLEEQAAK using ACQUITY UPLC Peptide CSH C18 130 Å, ACQUITY UPLC Peptide BEH C18 130 Å, and ACQUITY UPLC Peptide BEH C18 300 Å columns.

Linearity, precision, and accuracy

Linear, precise, and accurate quantification of dulaglutide was achieved using 50 μL of rat plasma, which was immunopurified, digested, and SPE purified. Lower limits of quantification (LLOQs) of 1 ng/mL were achieved and calibration curves were linear (r2 > 0.99) from 1–10,000 ng/mL using a 1/X2 linear fit (Table 2). All calibration curves, intra, and inter-day QC levels were accurate within ±15% and CVs were < 11% and were consistent with standard bioanalytical method validation guidance criteria. QC performance statistics for all runs are highlighted in Table 3. Chromatographic performance of blanks, LLOQ, and LQC samples are illustrated in Figure 7.

Table 2. Linear dynamic range and standard curve statistics for dulaglutide peptides extracted from rat plasma.
Table 3. Inter and Intra-day QC quantitative performance for dulaglutide peptides extracted from rat plasma.
Figure 7. Representative blank, LLOQ, and LQC chromatograms of dulaglutide peptides extracted from 50 μL of rat plasma.

Conclusion

The work described here encompasses a complete workflow for the development of Fc-fusion protein quantification assays. The combination of specific protein-level capture, fast and simple digestion, and selective peptide SPE enabled the high sensitivity quantification of dulaglutide from rat plasma.

  • Fc specific immunoaffinity purification to improve sample cleanliness and LLOQs.
  • Oasis PRiME MCX SPE to purify and concentrate samples, improving peak area, and reproducibility at low concentrations.
  • Large pore size column capable of operation at high temperatures for best carryover performance.
  • 1 ng/mL LLOQ achieved with excellent precision and accuracy, with four orders of linearity.

References

  1. Glaesner W, Vick AM, Millican R, Ellis B, Tschang SH, Tian Y, Bokvist K, Brenner M, Koester A, Porksen N, Etgen G, Bumol T. Engineering and Characterization of the Long- Acting Glucagon-Like Peptide-1 Analogue LY2189265, an Fc Fusion Protein. Diabetes Metab Rev. 2010;26(4):287–296. 
  2. Kang L, Camacho RC, Li W, D’Aquino K, You S, Chuo V, Weng N, Jian W. Simultaneous Catabolite Identification and Quantitation of Large Therapeutic Protein at the Intact Level by Immunoaffinity Capture Liquid Chromatography- High-Resolution Mass Spectrometry. Anal. Chem. 2017;89(11):6065–6075. 
  3. Dulaglutide protein sequence. Retrieved August 2019 from https://www.drugbank.ca/drugs/ DB09045. 
  4. Skyline targeted mass spec environment (2019). Downloaded August 2019 from https://skyline.ms/ project/home/software/Skyline/begin.view.

720006823, April 2020

回到頁首 回到頁首