• 應用手冊

Optimized Workflow for API Process Impurities using 2D LC-MS/MS

Optimized Workflow for API Process Impurities using 2D LC-MS/MS

  • Claude R. Mallet
  • Yong Liu
  • Tim Novack
  • Waters Corporation
  • 默克公司
Methanol bottle and chemicals with hazard symbols

Abstract

This application demonstrates a micro sequential extraction protocol to capture and characterize unknown entities for an API process impurity application using the ACQUITY UPLC System with 2D Technology.

Benefits

  • retention selectivity
  • micro-extraction

Introduction

The ‘holy grail’ during an active pharmaceutical ingredient (API) synthesis is the irrefutable isolation and identification of impurities or metabolites for key intermediates (small or large molecules). This is followed by multiple chromatographic steps, manual fraction collection with concomitant lengthy evaporative steps and compromised losses in yield for gains in purity. Even with meticulous planning and sample handling, the definitive NMR spectrum is elusive. It is not uncommon for a purification to absorb 3–6 weeks of dedicated instrument and analyst time with the futile result of a complicated, un-interpretable NMR spectrum. A reasonable compromise of this fit-for-purpose process would be to automate the isolation and purification steps.

The concept of multi-dimensional-chromatography is a well established technique for the analysis of complex mixtures. However, since its beginning, the technique is also perceived as highly complex in term of hardware and also difficult to gain in depth insight for practical usage. The peak capacity (or separation power) can be increased by combining several separation dimensions (most instances utilize two) each using optimized conditions for maximum resolution. The main challenge is the transfer of closely resolved analytes from the primary resolving dimension (PRD) to the secondary resolving dimension (SRD).

In recent years, advances in software control and automation have enabled hyphenated instrumentation platforms to offer enhanced performance and throughput. The use of multi-fluidic circuits can decrease sample handing in term of time, resources and consumables. In this application, an intermediate API entity from a reputable pharmaceutical company will be used to demonstrate the optimized workflow with 2D LC-MS/MS.

Experimental

The chromatographic conditions were tested on several trapping chemistries (Oasis HLB, XBridge C18, and C8) and separation chemistries (BEH C18 and HSS T3). The loading (low pH, high pH and neutral pH) and eluting mobile phase (MeOH + 0.5% formic acid and ACN + 0.5% formic acid) were also optimized using an automated process.

The extraction process was performed using a reversed-phase protocol with a 3 cc Oasis HLB SPE barrel. The sorbent was conditioned by using 5 mL of methanol followed by 5 mL of water. The solid API sample was dissolved in methanol at 5 mg/mL with acetonitrile. The extraction procedure started with 1 mL of the API solution diluted to 1% with 99 mL of water. The entire solution was loaded onto the HLB extraction cartridge for sequential elution. Several elution conditions were evaluated using three elution solvents (methanol, acetonitrile, acetone) at three pH values (3, 7 and 10). The Xevo TQD System was set in scan mode from 50 to 800 amu.

Chromatography and MS/MS conditions

Loading conditions

Column:

Oasis HLB 20 μm

Loading:

Milli-Q Water (pH 7, no additives)

Flow rate:

2 mL/min

At-column dilution:

5% (0.1 mL/min pump A and 2 mL/min pump B)

UPLC conditions

UPLC system:

ACQUITY UPLC 2D configured for “Trap and Elute” with At-column dilution

Runtime:

10 min

Column:

ACQUITY UPLC BEH C18, 2.1 x 50 mm, 1.7 μm

Column temp.:

60 °C

Mobile phase A:

Water + 0.5 % formic acid

Mobile phase B:

Acetonitrile + 0.5 % formic acid

Elution:

5 minute linear gradient from 5% (B) to 95% (B)

Flow rate:

0.500 mL/min (pump C)

Injection volume:

5 μL

MS conditions

System:

ACQUITY UPLC

Column:

ACQUITY UPLC BEH C18 2.1 x 100 mm, 1.7 μm

Column temp.:

45 °C

Flow rate:

0.3 mL/min

Mobile phase A:

1 mM ammonium formate in water, containing 0.01% formic acid

Mobile phase B:

1 mM ammonium formate in acetonitrile:water (95:5, v/v), containing 0.01% formic acid

Gradient:

0 min, 20% B; 2 min, 20% B; 15 min, 40% B; 16 min, 70% B; 17 min, 95% B; 18 min, 95% B; 18.5 min, 20% B; 20 min, 20% B

Injection volume:

10 μL

Analysis time:

20 min

Strong wash:

Acetonitrile

Weak wash:

water/acetonitrile (95:5, v/v)

Results and Discussion

This application demonstrates the advanced capability of the ACQUITY UPLC System with 2D Technology with the Xevo TQD Mass Spectrometer for the identification of process impurities during synthesis of key API intermediate. In most impurity profiling cases, the risk of missing unknown entities outweigh the use of extensive extraction or clean up. In this instance, the user simply dissolved the solid intermediate in methanol and used a direct-injection approach for analysis. The resulting chromatogram is shown in Figure 1a. As to be expected, the analytical profile shows a wide distribution with multiple peaks. For example purpose, two masses (m/z 535.5 and 534.5) were extracted from the full scan (Fig 1b). The chromatogram shows two peaks at 3.61 min and at 5.03 min. By combining mass spectrum under each peak, a combined mass spectrum shows clearly an intense signal at 533.5 and 534.5 m/z, with a clear difference in mass distribution.

 Full scan analysis of the API
Figure 1. A) Full scan analysis of the API un-extracted in methanol, B) extracted mass spectrum at 354 m/z, C) combined mass spectrum of peak 3.61 min, D) combined mass spectrum of peak 5.03 min.

Both peaks were re-analyzed using the Xevo TQD in product ion scan mode and the fragmentation results (Figure 2) clearly demonstrate two distinct entities with a 1 amu parent mass difference. With two well separated components, it becomes apparent that those two entities are exhibiting distinct affinity towards the stationary phase. By incorporating an optimized 3D extraction process, additional information pertaining to the entities physical and chemical properties (example: acidic or basic moieties, polarity, etc.) could help the process of structure elucidation and ensuring a wider retention and elution coverage to capture unknown entities requiring a specific and often time narrow retention parameter.

Product ion scan of mass 353.5 m/z
Figure 2. A) Product ion scan of mass 353.5 m/z at RT 3.62 min, B) Product ion scan of mass 354.5 m/z at RT 5.05 min, C) Combined product ion spectrum of peak 3.61 min, D) combined product ion spectrum of peak 5.05 min.

Micro extraction optimization – effect of hydrophobicity1,2,3

The 3D extraction process starts by understanding the entities’ solubility and hydrophobicity (retention1,2,3). The sequential elution process shown in Figure 3 (Step 1) begins by loading a 100:1 aqueous dilution of the intermediate stock solution. This high aqueous dilution ensures maximum retention on the solid-phase sorbent. In this case, a polymer base sorbent with excellent wettability and wide retention capability for both hydrophobic and hydrophilic moities was chosen. The next step follows a sequential elution profile. In this instance, a 10% incremental cut was selected as a starting point. The sequential analysis produced ten fractions, each with different aqueous/organic ratios, which would require total evaporation to dryness and reconstitution before analysis if a single dimension chromatography was selected as the primary analytical tool. With at-column dilution enabled in conjunction with the 2D chromatography, each cut is refocused on the same trapping material, thus eliminating the time consuming evaporation to dryness step. Furthermore, each cut is eluted on a high resolution Si-C18 analytical column.

 Sequential elution protocol
Figure 3. Sequential elution protocol: Step 1- sequential cut at 10%, Step 2- hydrophobicity effect, and Step 3- pH effect.

The chromatogram for each cut is displayed in Figure 4. As expected, a distribution profile shows weakly retained entities in the low organic cuts. As the organic percentage is increased, the later eluters are showing up at higher retention times. When the TIC’s are extracted for m/z at 534.5 (Figure 5), the peaks shows a gaussian distribution with a maximum signal at 50% methanol for the entity at 3.64 min and at 80% methanol for the entity at 5.05 min, respectively. By selecting solvents for their different elution strength, (Step 2 in Figure 3) a more complete solubility profile emerges which can be utilized for a precise heart cut elution.

Full scan chromatogram for methanol sequential elution
Figure 4. Full scan chromatogram for methanol sequential elution.
 Mass extracted chromatograms
Figure 5. Mass extracted chromatograms at 354.3 m/z for methanol sequential elution.

Micro extraction optimization – effect of pH

Once the hydrophobicity evaluation is complete, acidic or basic moieties can be probed by repeating the same sequential elution at pH 3 and 10 (see Step 3 in Figure 3). The results for the sequential elution at pH 10 with methanol revealed a new entity only observed at high pH (Figure 6). Since the extraction procedure was repeated with three separate protocols, the new entity at 4.20 min shows a maximum signal at 90% with methanol, 50% with acetonitrile and 60% with acetone (see Figure 7).

Mass extracted chromatograms at 354.5 m/z
Figure 6. Mass extracted chromatograms at 354.5 m/z for methanol high pH sequential elution (selectivity profile).
Mass extracted chromatograms at 354.5 m/z for methanol, acetonitrile and acetone at high  profile.
Figure 7. Mass extracted chromatograms at 354.5 m/z for methanol, acetonitrile and acetone at high pH sequential elution (selectivity and hydrophobicity profile).

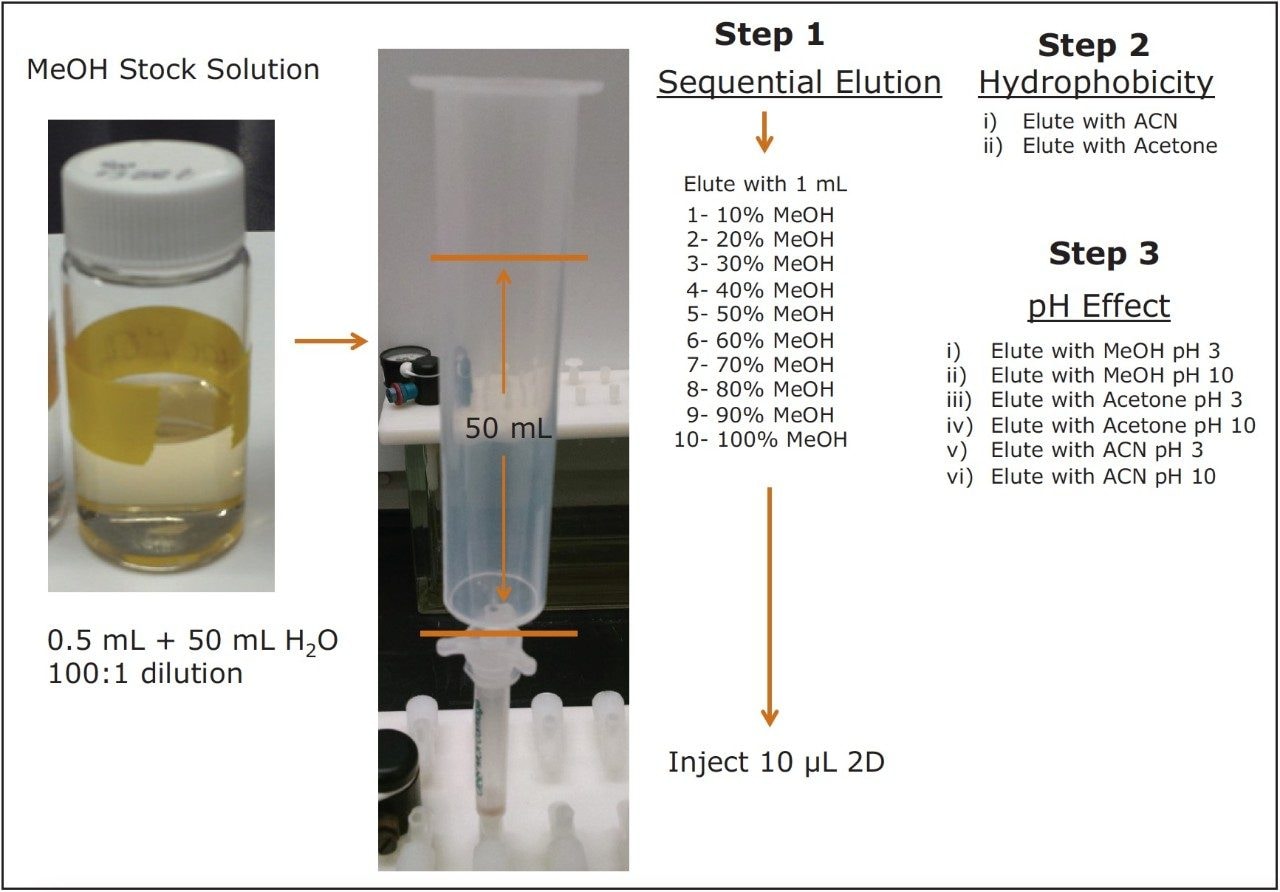
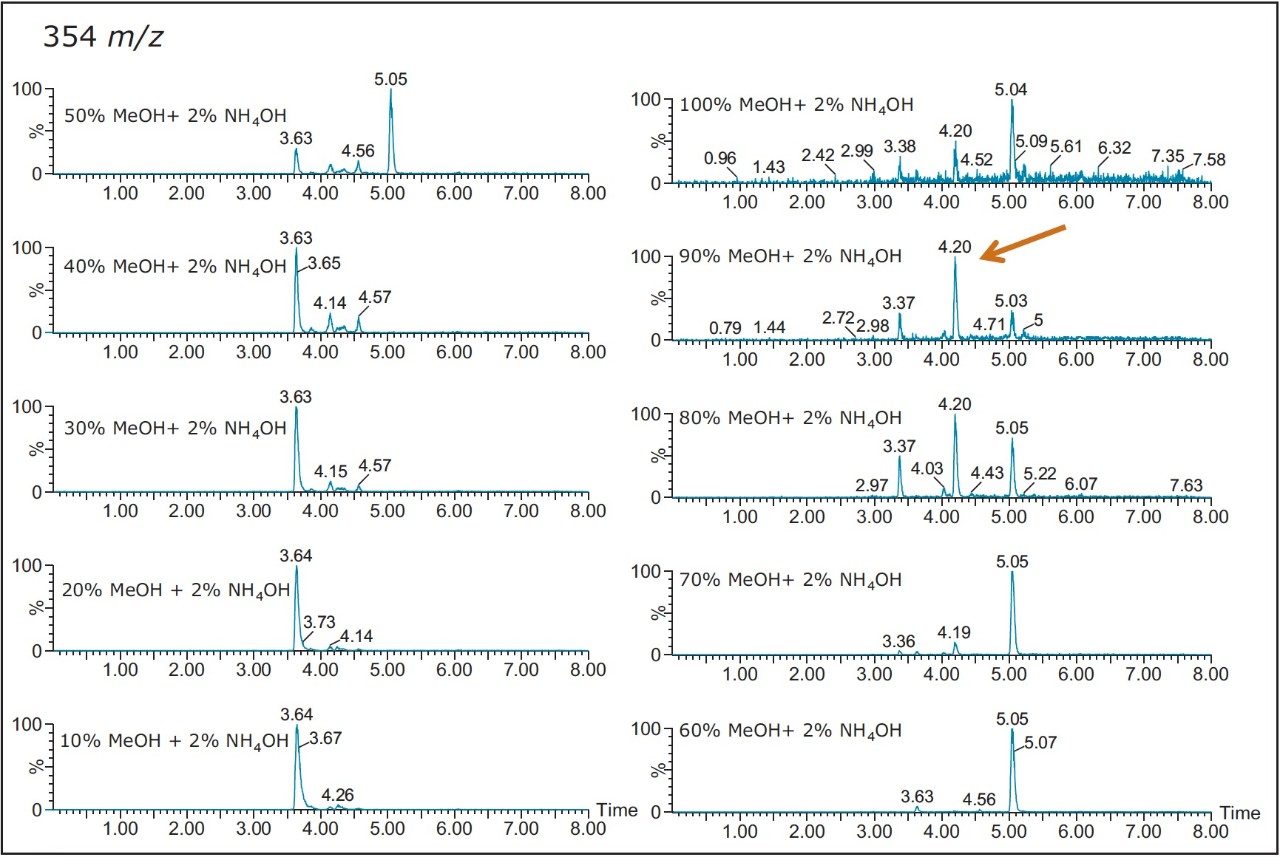
Also, at high pH elution, the 5.05 min entity shows weak solubility in acetonitrile and acetone. However, the 3.64 min entity shows a weak response with methanol. This result shows a viable option to retain and screen unknown entities based on their chemical and physical properties. Currently, most unknown impurities or metabolite identification relies on a simple solubilization step, followed by a direct injection onto an LC/MS system. The rational with this approach is related to the fear of potential breakthrough with current extraction techniques (LLE, SPE, SPME, etc.). The micro extraction process relies on a high retentive value for both hydrophilic and hydrophobic entities using a novel polymer blend (Oasis HLB) as a stationary phase. The wetting property of the co-polymer also offers high retention capabilities and is not prone to breakthrough effect by hydrophobic collapse if the sorbent is run dry. The wide pH stability (1–14) and large organic solvent compatibility enables the option of crafting various elution strategies for effective screening applications.

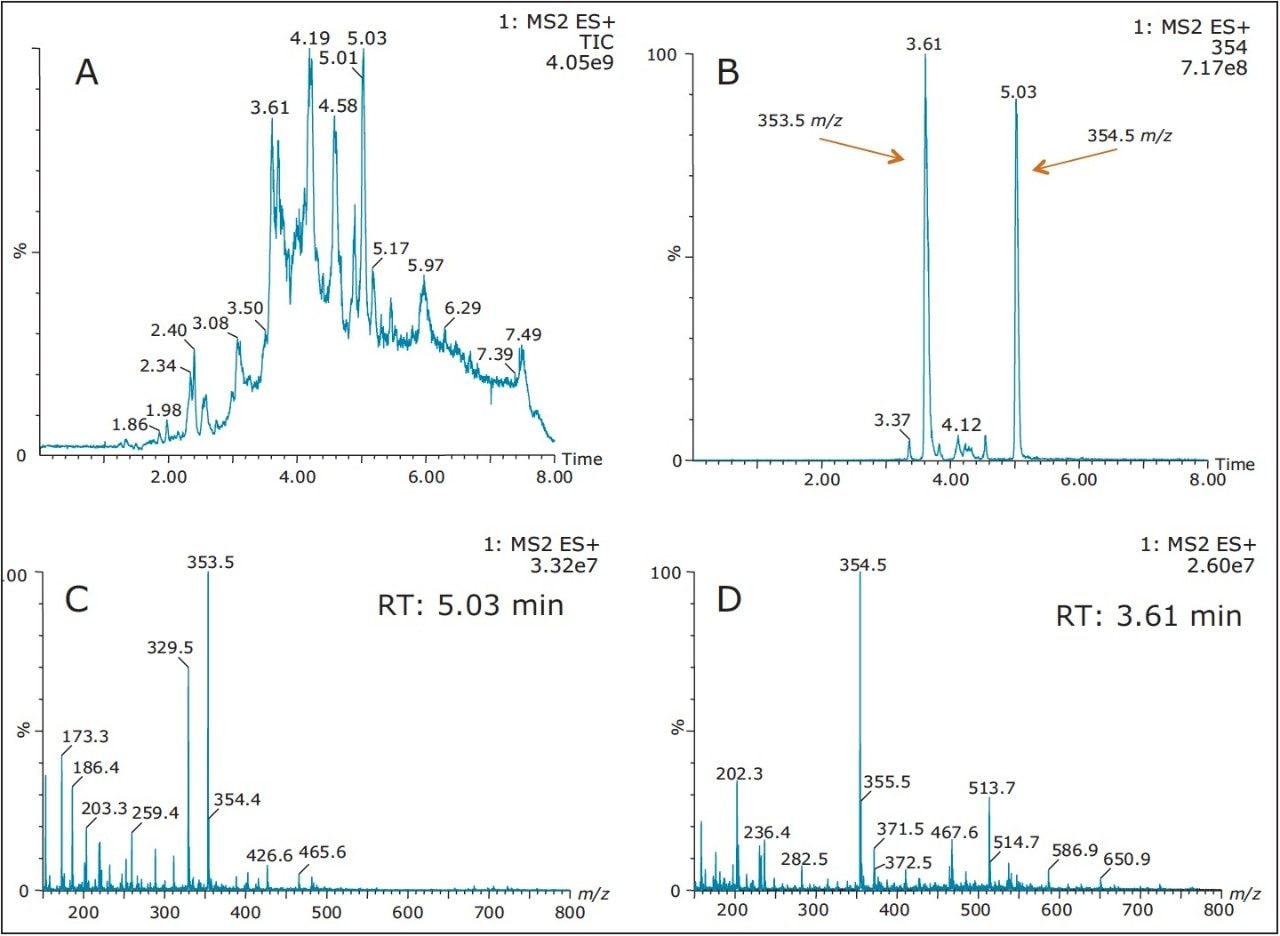
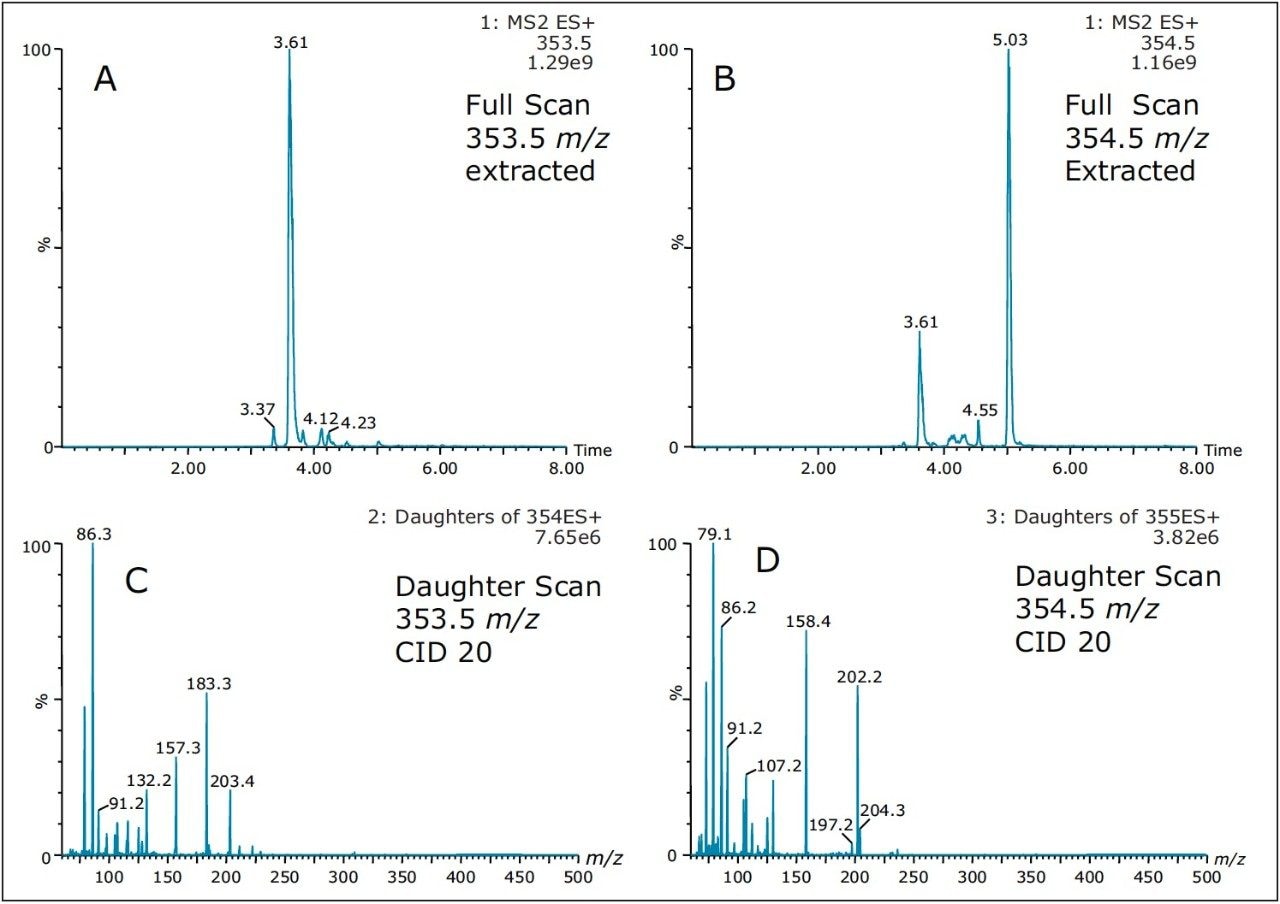
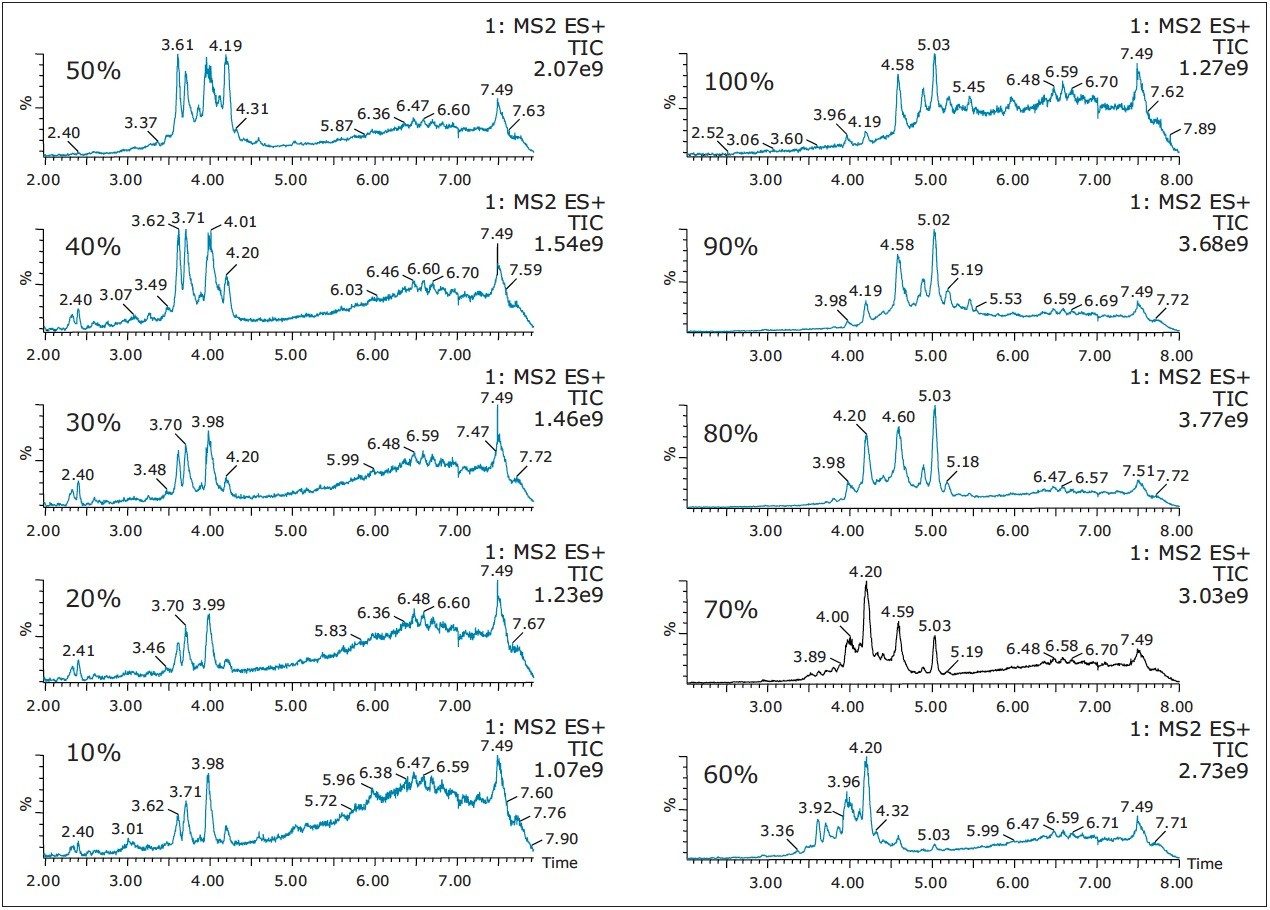
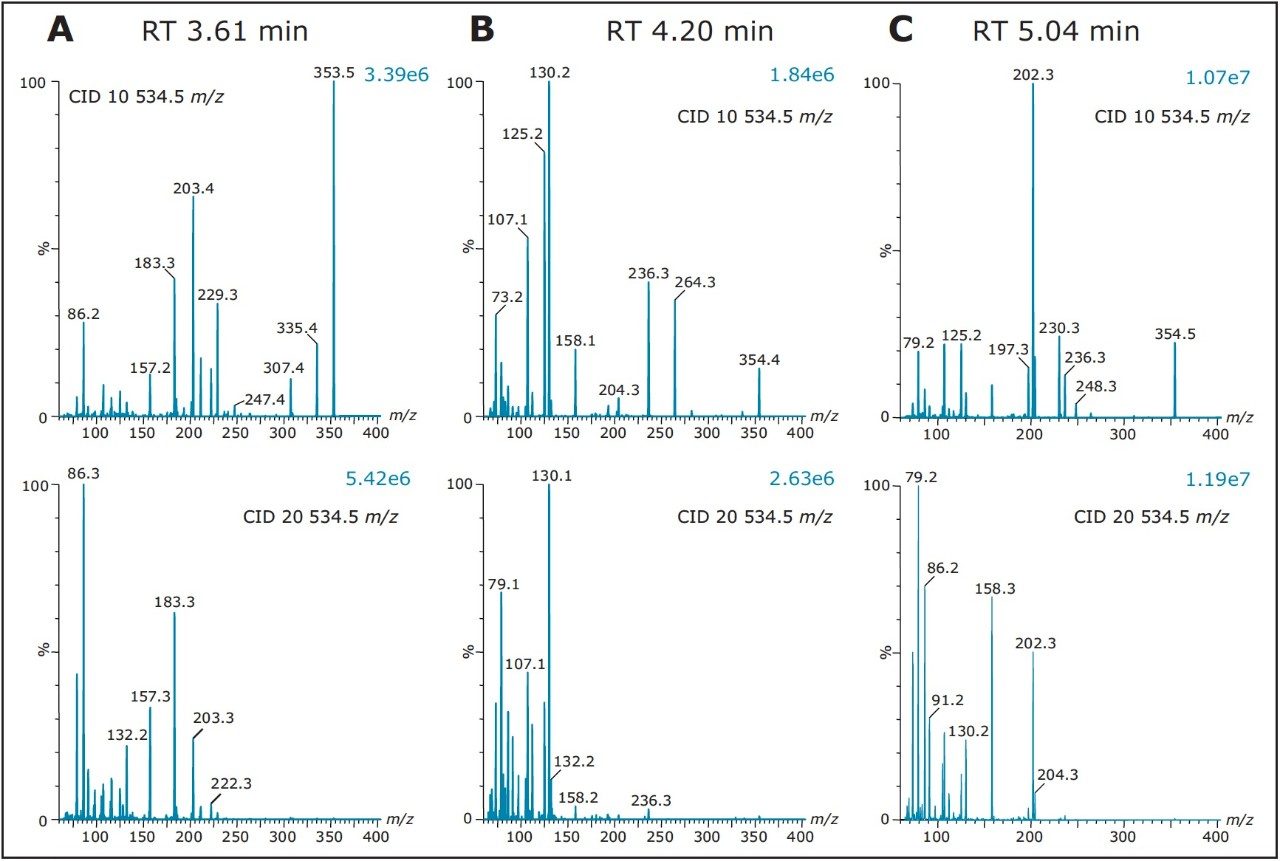
As such, Figure 8 shows product ion spectrum at 10V and 20V CID (collision induced dissociation) fragmentation values for the 3.61 min at 353.3 m/z using the maximum signal at 20% MeOH + 2% NH4OH sequential elution. The low collision value shows the parent mass at 353.3 and major fragment ions at 335.4, 229.3, 203.4, and 183.3 m/z. The product ion spectrum with the CID set at 20V shows the same common fragment ions. The strength of the micro sequential extraction is the discovery of two entities sharing the same m/z with different retention times. The entity at 4.20 min at 354.4 m/z is only detected with the high pH elution (maximum signal at 90% MeOH + 2% NH4OH) and shows major fragment ions at 264.3, 236.3, 130.2, 125.2, and 107.1 m/z. However, the entity at 5.04 min (same m/z value), show a completely different fragmentation pattern while showing a few common m/z fragmentation ions at low mass. This observation suggests the two entities share a similar backbone structure.

Product ion spectrum
Figure 8. A) Product ion spectrum at 10V and 20V CID for mass 353.3 at RT 3.61 min (30% ACN high pH elution), B) Product ion spectrum at 10V and 20V CID for mass 354.3 at RT 4.20 min (90% MeOH high pH elution), C) Product ion spectrum at 10V and 20V CID for mass 354.3 at RT 5.04 min (70% MeOH high pH elution).

Conclusion

This application demonstrates a micro sequential extraction protocol to capture and characterize unknown entities for an API process impurity application using the ACQUITY UPLC System with 2D Technology. The current minimum extraction approach for targeting unknown entities starts the identification process and generally gives an overview of the sample complexity. From this starting point, key extraction steps are added to capture a retention profile based on hydrophobicity/hydrophilic properties and common molecular moieties (acidic, basic or neutral). Each additional step increases the probability of finding an optimum isolation methodology for any given entity in a raw sample. In this application, two unknowns with identical masses were detected, with one entity only visible under a specific extraction condition.

References

  1. Mallet, C.R., Analysis of Pharmaceuticals and Pesticides in Bottled, Tap and Surface Water using ACQUITY UPLC with 2D Technology, Application Note720005167EN, 2014.
  2. Mallet, C.R, Multi-Dimensional Chromatography Compendium: Trap and Elute vs. At-column Dilution, Application Note 720005339EN, 2015.
  3. Mallet. C.R., Botch-Jones, S., Illicit Drug Analysis in Urine using 2D LC-MS/MS, Application Note 720005533EN, 2015.

720005573, January 2016

回到頁首 回到頁首