Phthalates, esters of phthalic acid, are often used as plasticizers for polymers such as polyvinylchloride. They are widely applicable in various products including personal care goods, cosmetics, paints, printing inks, detergents, coatings, and food packaging. These phthalates have been found to leach readily into the environment and food as they are not chemically bound to plastics. As such they are known to be ubiquitously present in our environment.
Phthalates have been reported to show a variety of toxic effects related to reproduction in animal studies, which has resulted in these compounds being considered as endocrine disruptors. Screening food and beverages for phthalates contamination is required by many legislative bodies, although regulations vary from country to country in regards to acceptable daily tolerances and specific migration limits.
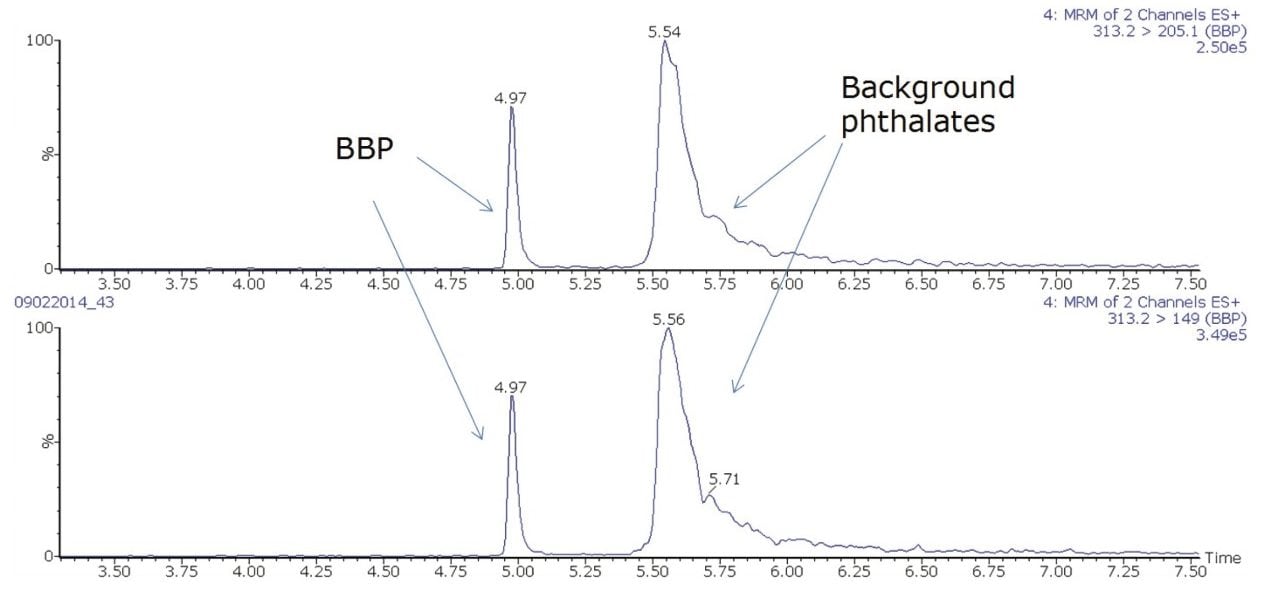
Traditionally, phthalates have been analyzed by gas chromatography-mass spectrometry (GC-MS), where derivatization and/or extraction and sample preparation is often required to improve chromatographic separation.1 The resulting GC-EI-MS spectra can lack selectivity, where the base ion, used for identification and quantification of many common phthalates is the non-selective m/z 149 (C8H5O3) ion. Furthermore, background contamination of phthalates remains a significant challenge due to their ubiquitous presence.
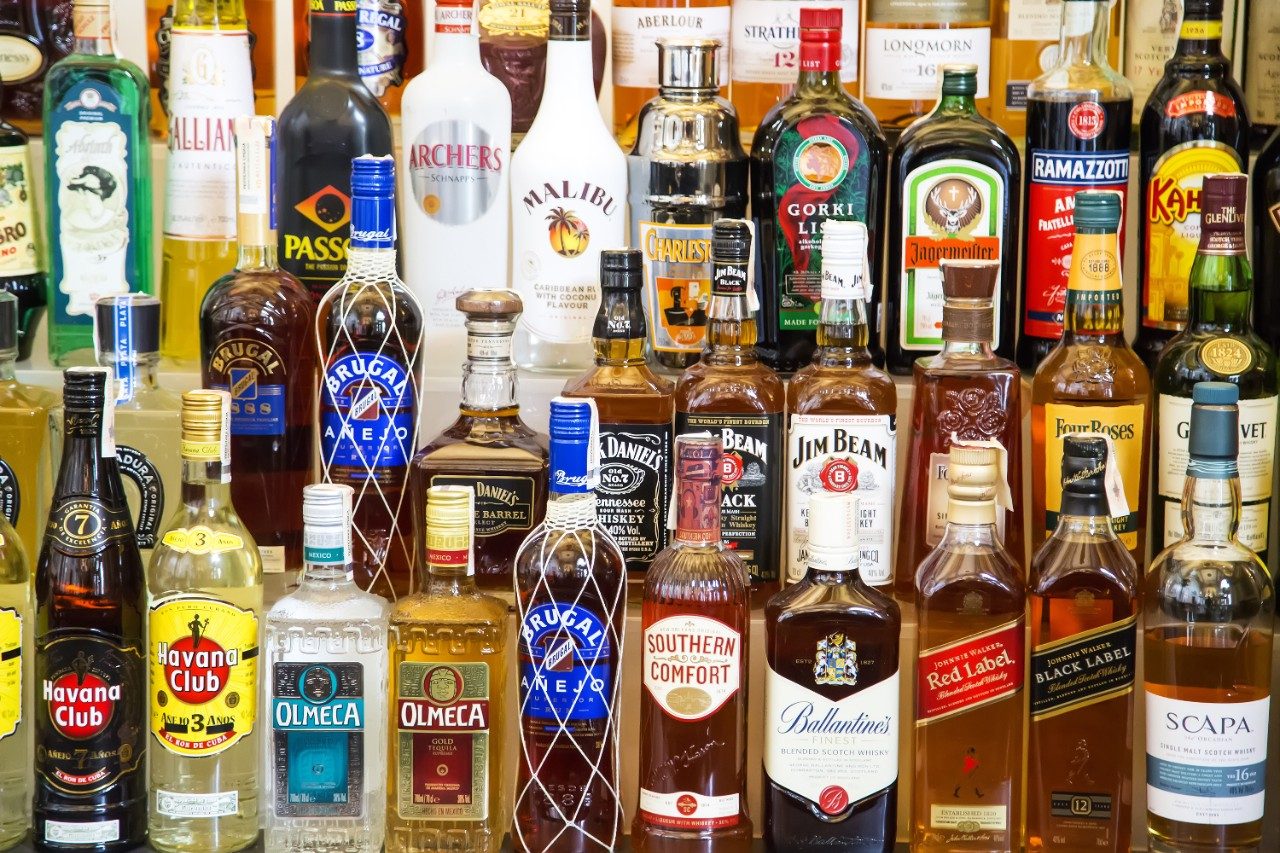
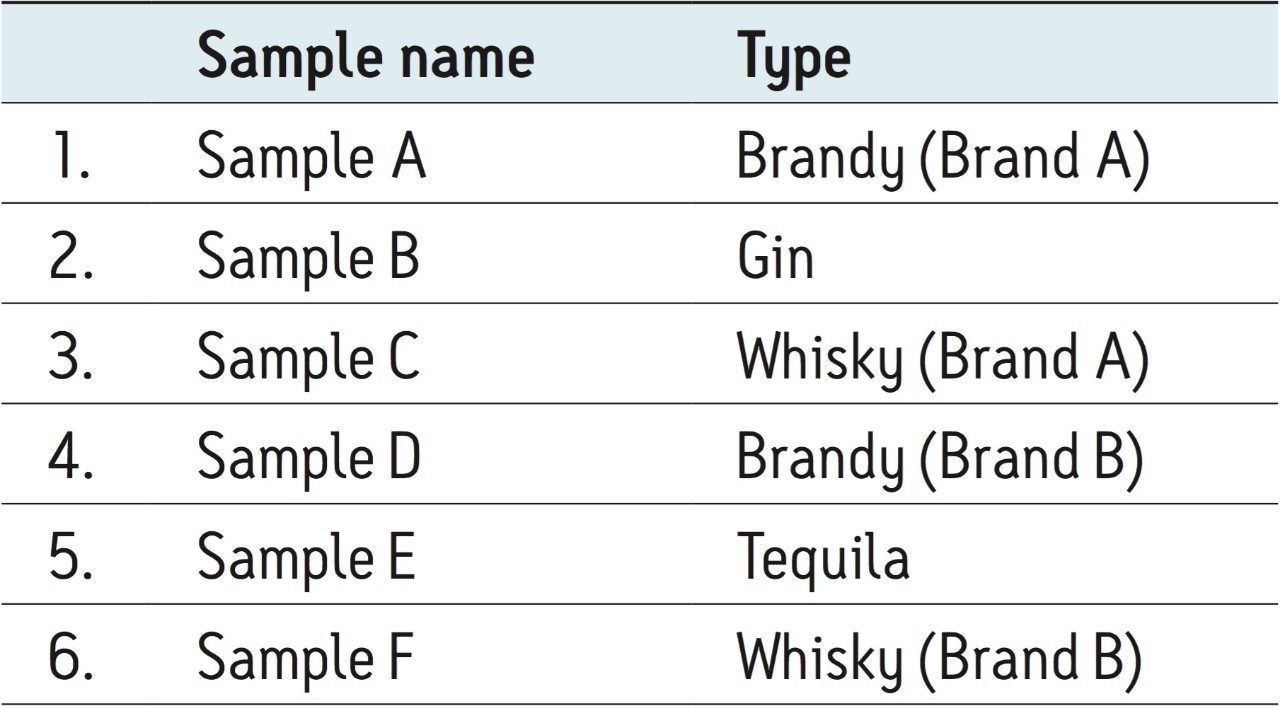
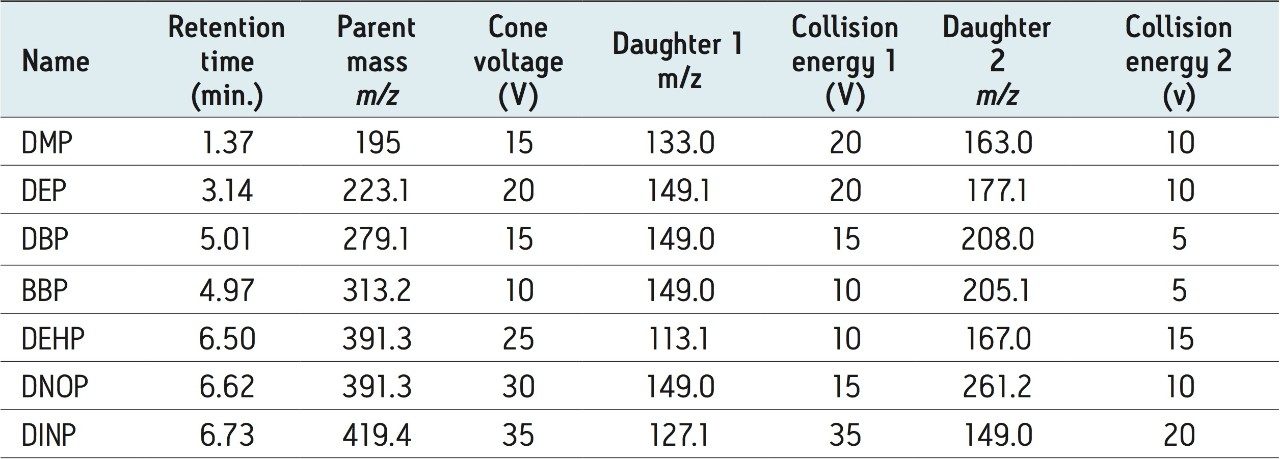
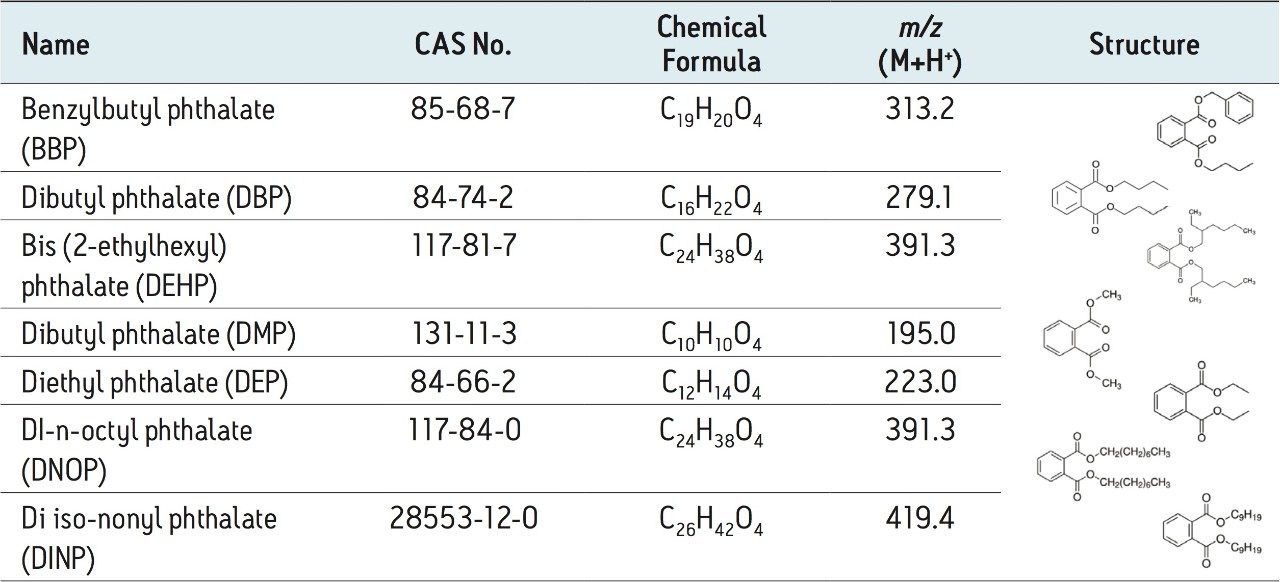
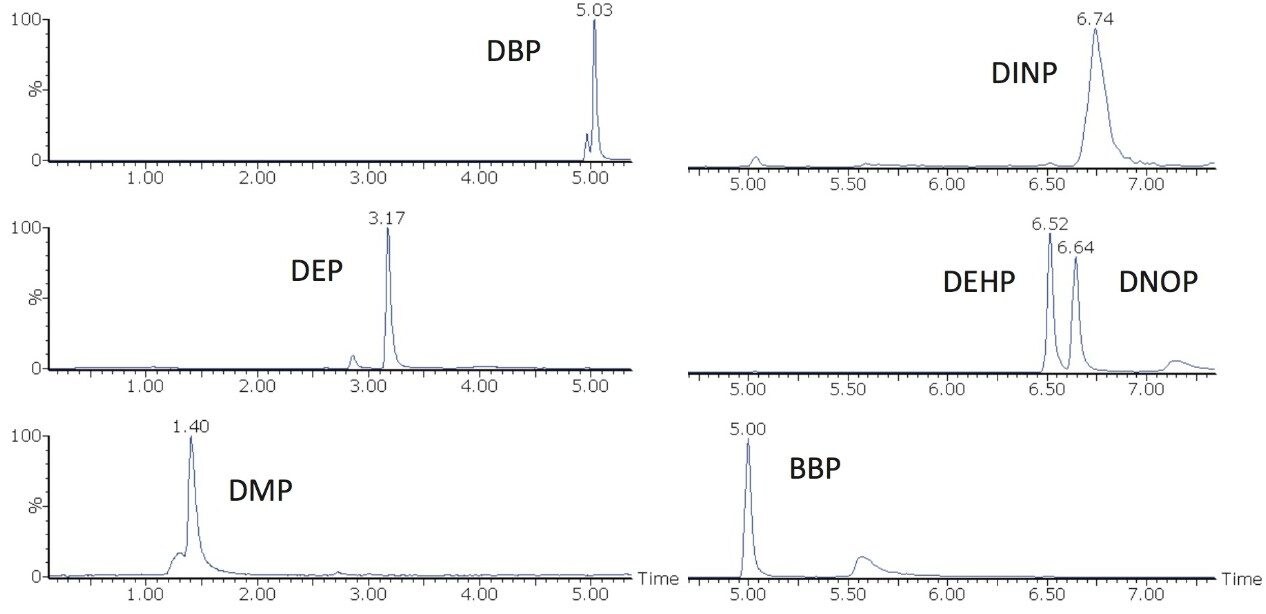
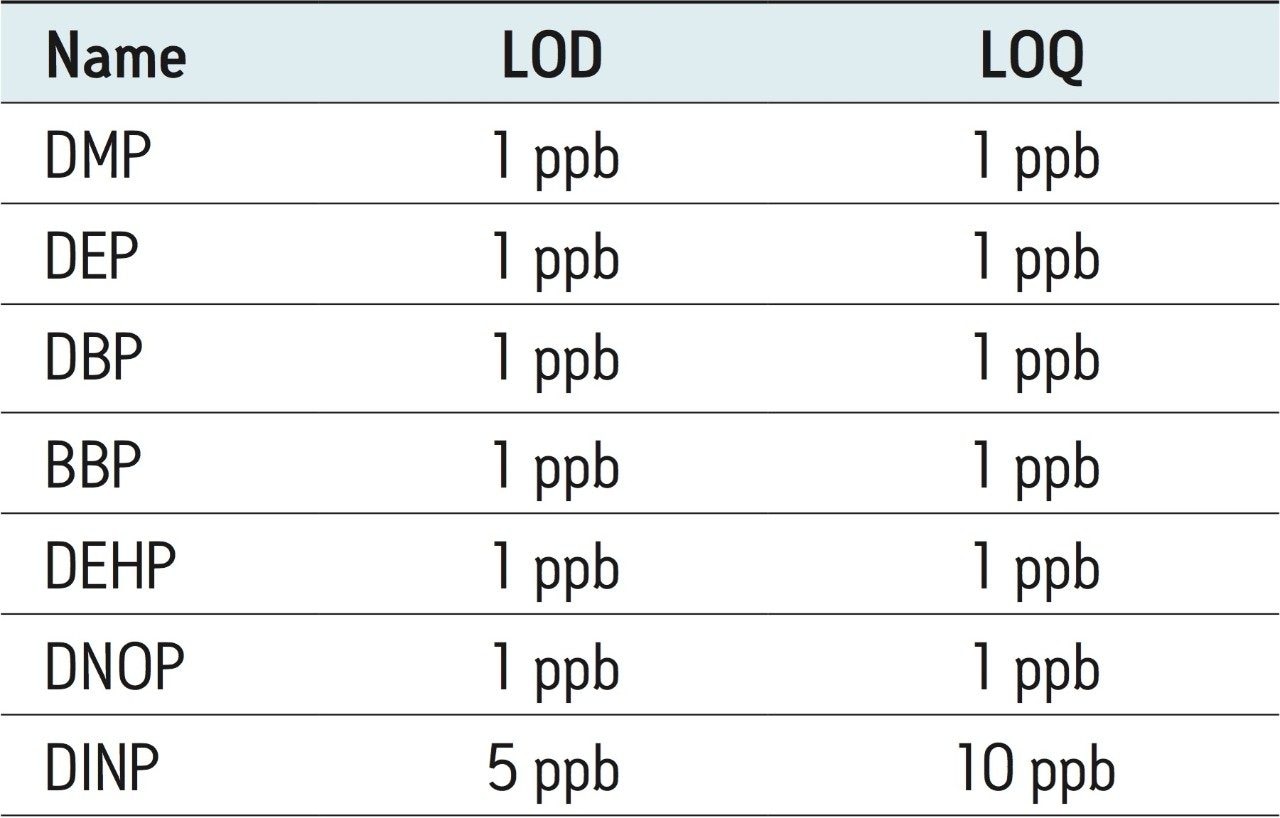
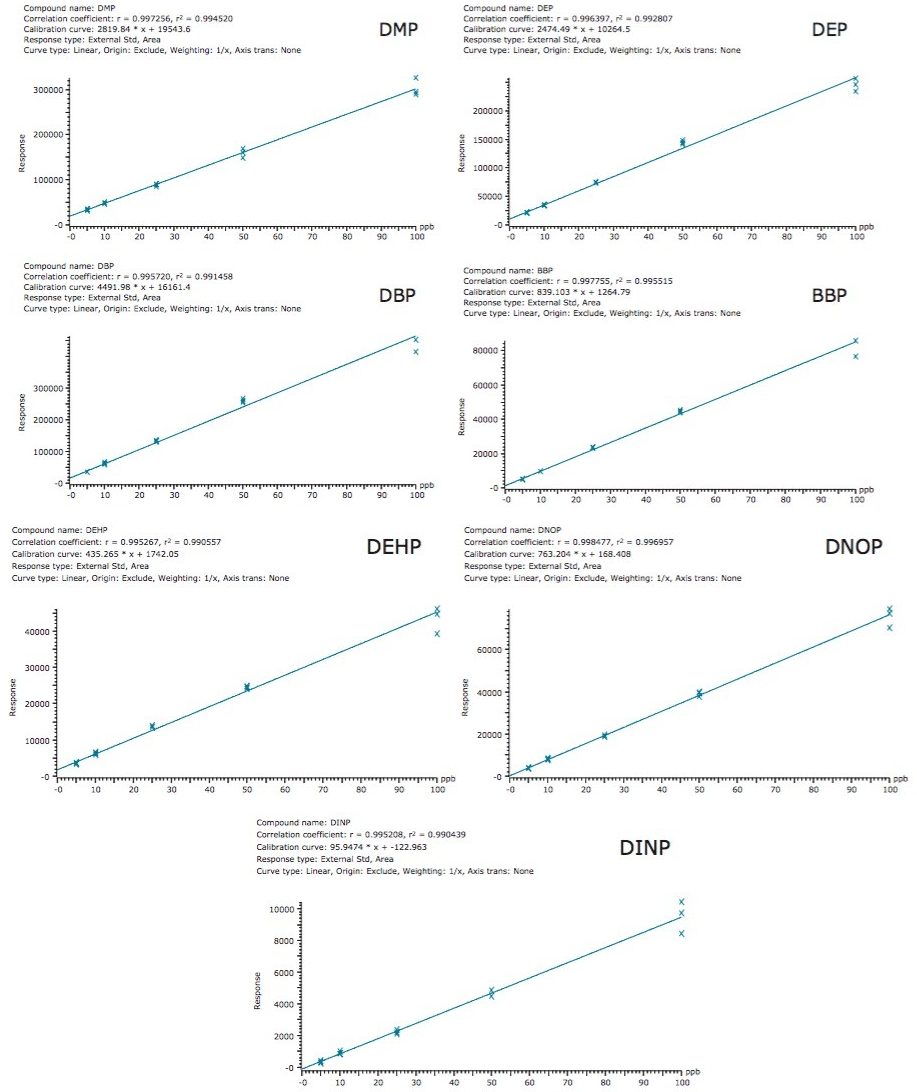
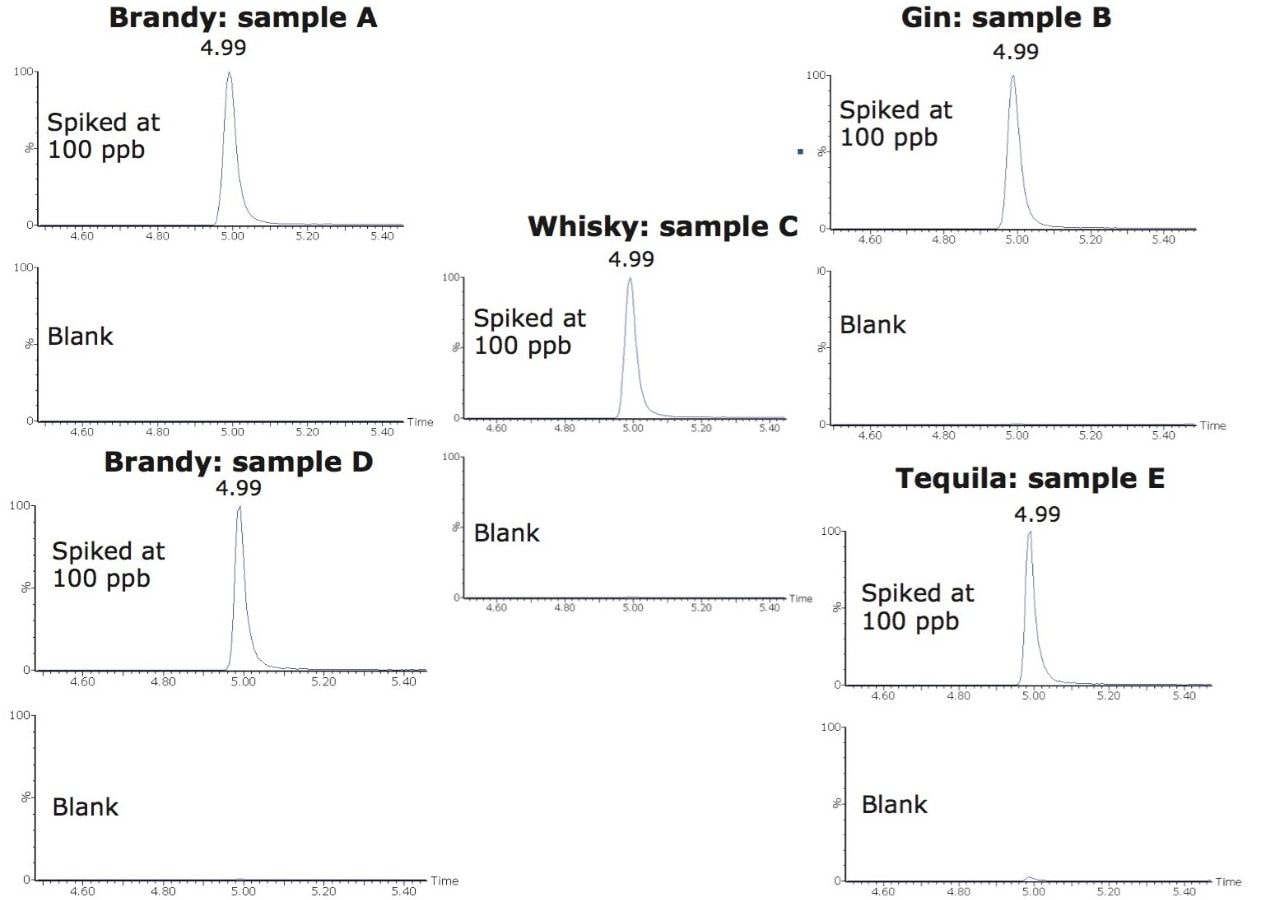
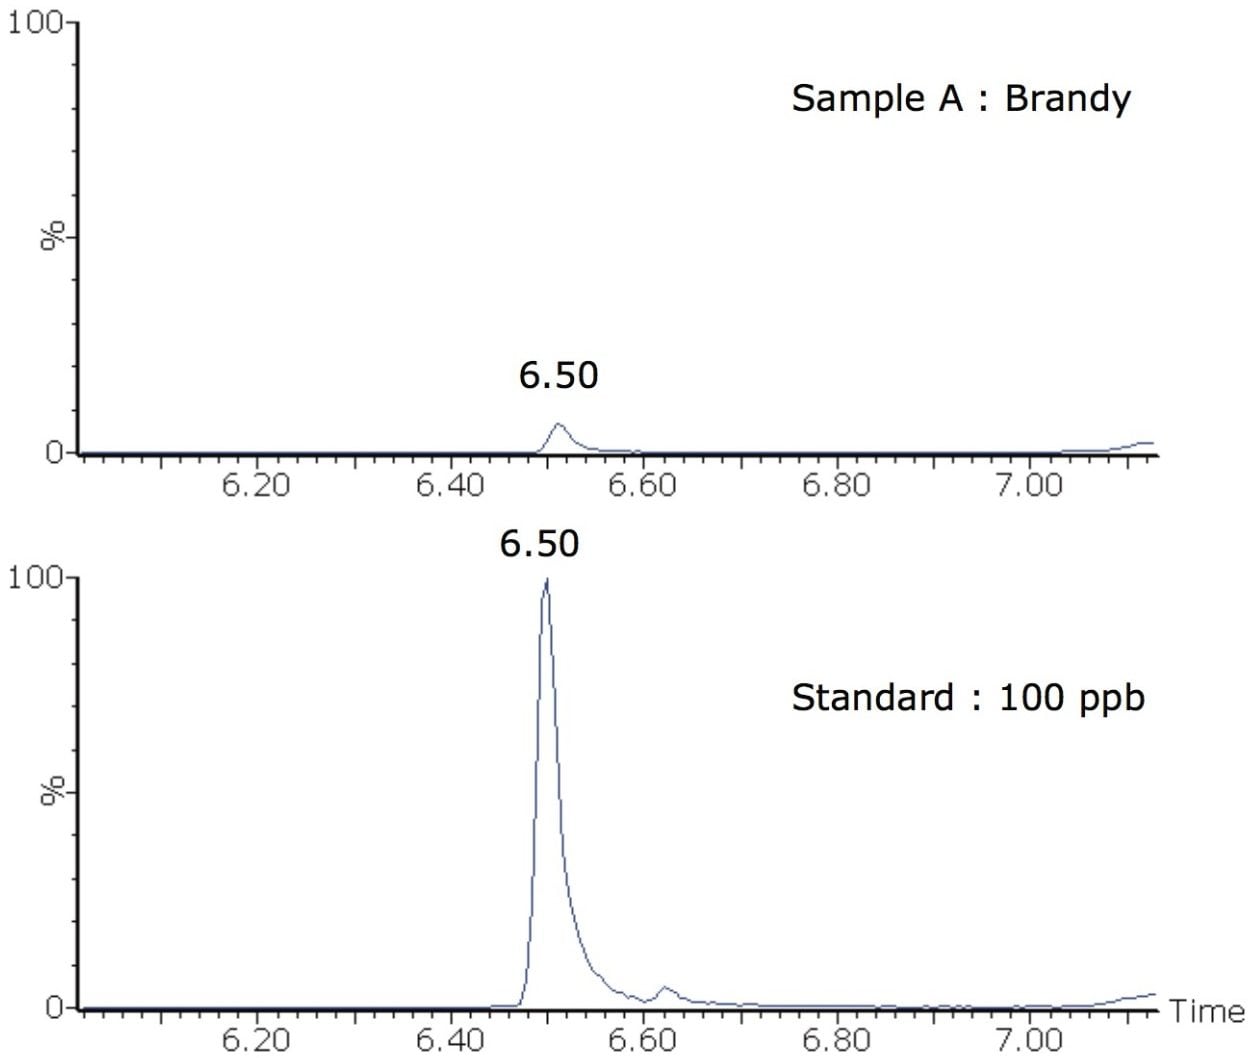
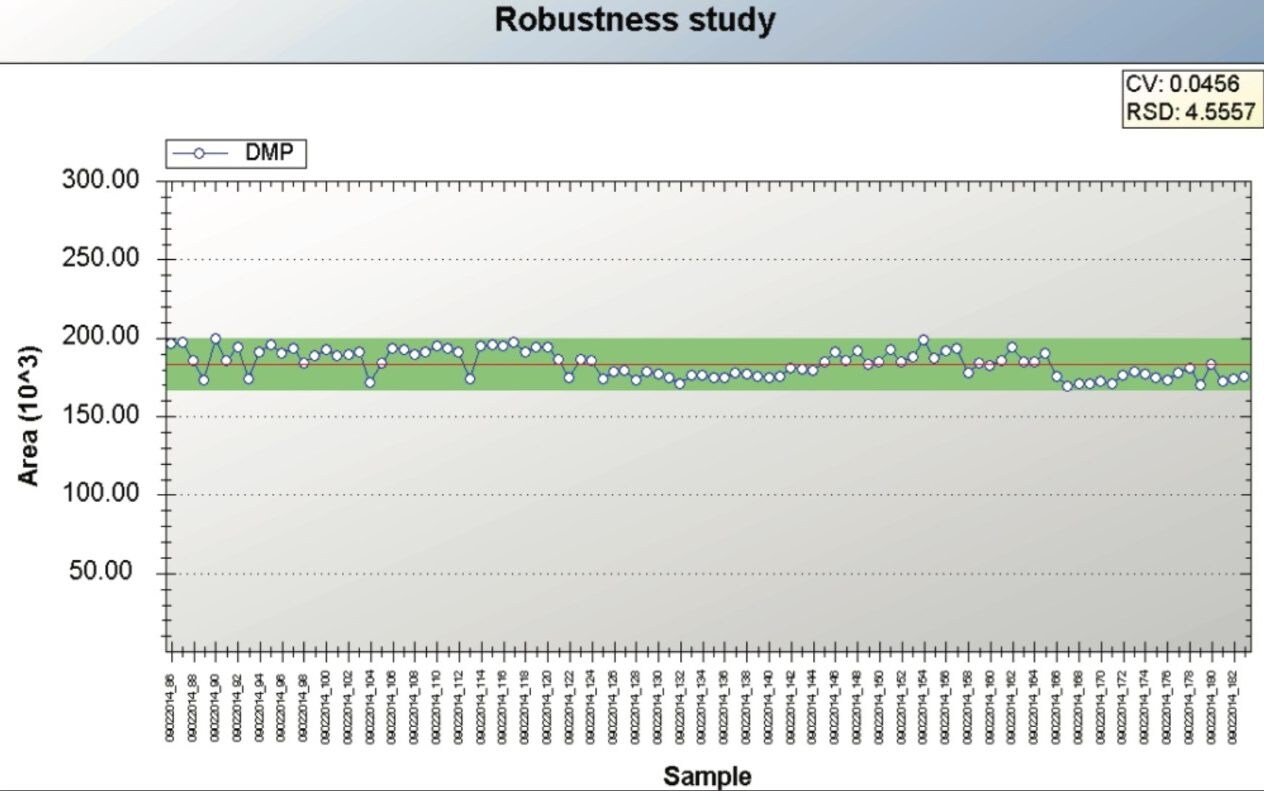
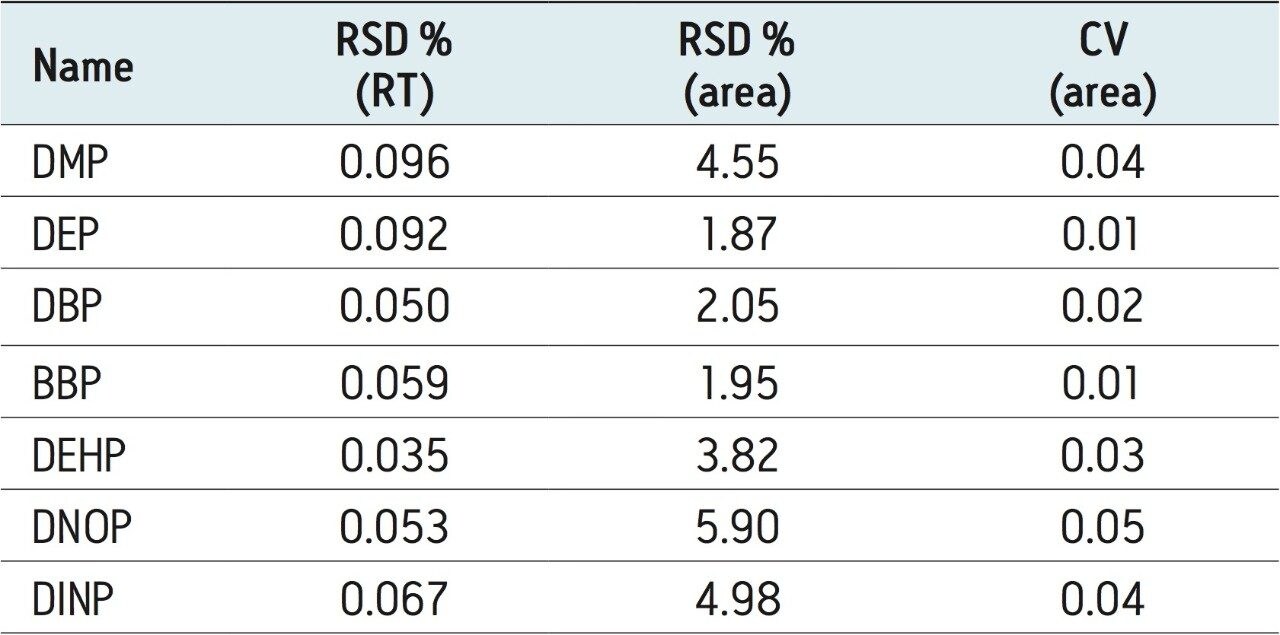
In this application note phthalates were separated on a reversed-phase column within 11 minutes using UltraPerformance Liquid Chromatography (UPLC) coupled to a tandem quadrupole mass spectrometer. In order to assess the method’s applicability, various brands of distilled spirits were tested. Repeated injections of the samples were made to evaluate method robustness over a number of days. Limits of detection (LOD) and quantification (LOQ) of seven key phthalates (DEHP, BBP, DBP, DNOP, DEP, DMP, and DINP) in the sample will be presented.