This application note examines three methods spanning widely over the operating space in SFC, and compares the amount of variation that can be expected for each during robustness testing.
Robustness testing of a chromatographic method is a way to measure the tolerance limits of the method by deliberately varying the critical parameters associated with the method. The purpose of robustness testing is to understand the chromatographic variation that can be expected with unintentional variation in the execution of the method. This exercise is often performed during method validation and when a method will have to be carried out across several different instruments and laboratories.
Within the operating space of supercritical fluid chromatography (SFC), the allowable range of pressures and temperatures in which one can perform chromatography, we can experience varying degrees of mobile phase compressibility depending on the method parameters used. In general, SFC mobile phase becomes more compressible as we decrease pressure and increase temperature. Therefore, a method with lower pressure and higher temperature will experience larger variation in mobile phase density with small changes in the method parameters when compared to methods at higher pressure and lower temperature. Since at a fixed mobile phase composition, density is a driving factor in SFC retention, a method’s level of robustness will depend largely on the extent of the mobile phase compressibility.
In this application note, we will examine three methods spanning widely over the operating space in SFC, and compare the amount of variation that can be expected for each during robustness testing.
The components of the sample mix were prepared at various concentrations containing a mixture of heptane, isopropanol, and methanol as the sample diluent.
LC system: |
ACQUITY UPC2 System |
Detector: |
ACQUITY UPLC PDA Detector |
Column: |
ACQUITY UPC2 Torus 2-PIC Column, 130A, 1.7 μm 3 mm x 100 mm, (p/n 186007602) |
Mobile phase A: |
100% Carbon dioxide |
Mobile phase B: |
100% Methanol |
UV detection: |
λ=220 nm (350-450 nm λ compensated) [40 pts/sec] |
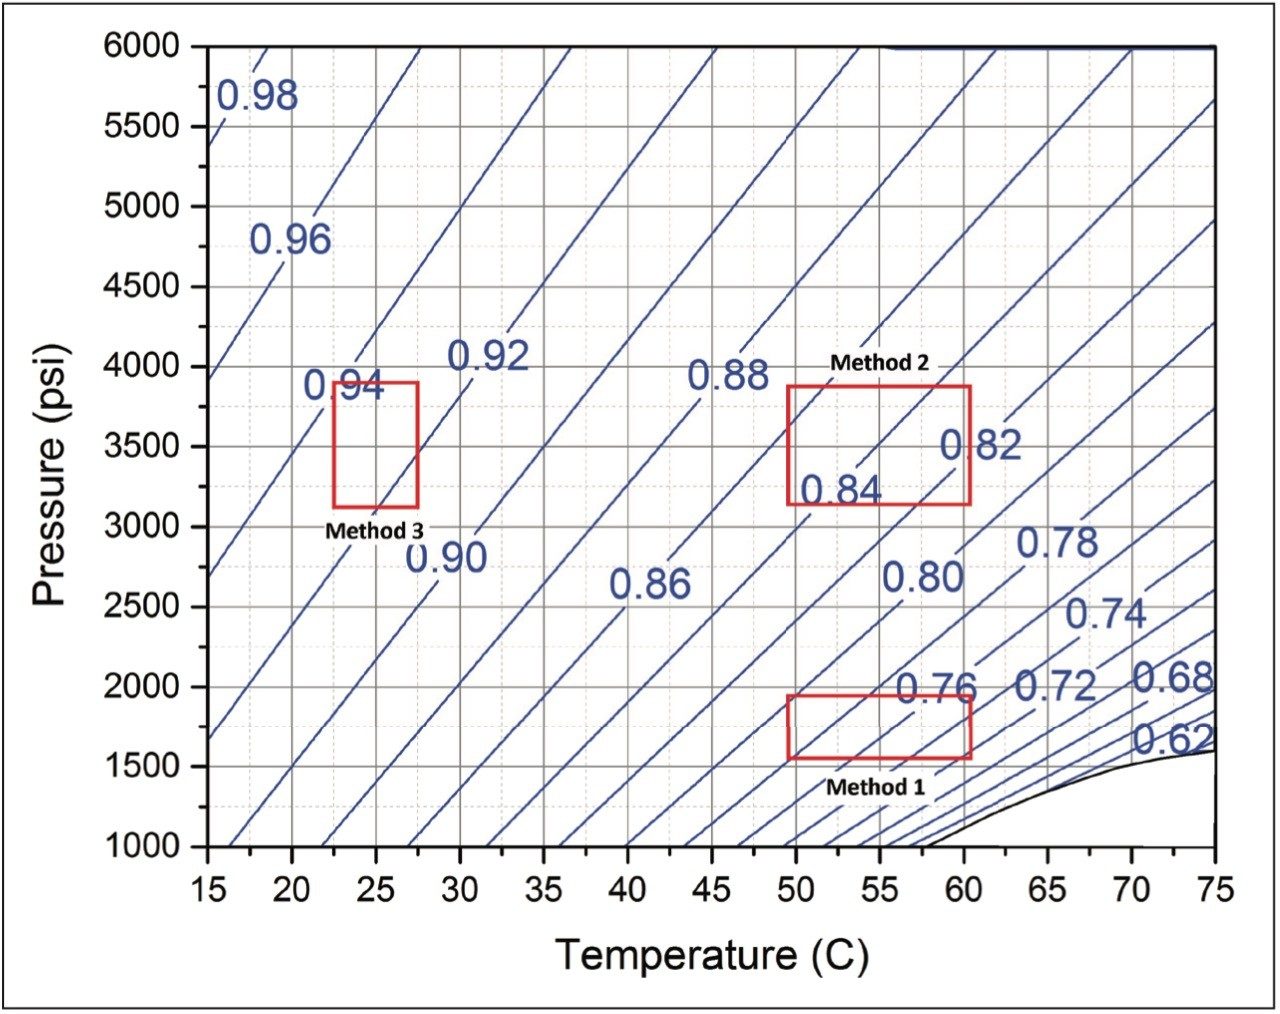
To examine the impact of mobile phase compressibility on method robustness, we varied the parameters of three different methods that span the operating space for SFC separations. For each controlled method, method 1, method 2, and method 3, we varied the flow rate, the co-solvent percent, the column temperature, and the ABPR pressure, as indicated. While the flow rate (1.2 mL/min) and the co-solvent concentration (5%) of the controlled conditions are the same for each method, the pressure and the temperature were adjusted to represent different regions on the SFC operating space. The extent of deliberate variation imposed on each of the controlled methods represents a generous margin of error that could be expected from the operator, the instrument, or both. A graphical view of the method parameters selection and the ranges of pressure and temperature variations are shown on the pressure vs. temperature plane in Figure 1. Note that the blue contour curves shown in Figure 1 are the constant-density plots of 95/5 (mol/mol, %) CO2/methanol mixture. These curves represent densities at equal intervals and are indicators of solvent compressibility at different conditions. For example, the number of curves passing through the method parameter variation window of method 1 (see Figure 1) is the highest, followed by 2 and 3. This means the variation on mobile phase density imparted by method parameter variation will be the highest for method 1, followed by method 2, then method 3. For more information on the usage of this plot consult Reference 1.
Flow rate: |
1.2 mL/min ± 4% |
Co-solvent percent: |
5% Methanol ± 4% |
Column temp.: |
55 °C ± 10% |
Back pressure: |
1,750 psi ± 10% |
Flow rate: |
1.2 mL/min ± 4% |
Co-solvent percent: |
5% Methanol ± 4% |
Column temp.: |
55 °C ± 10% |
Back pressure: |
3,500 psi ± 10% |
Flow rate: |
1.2 mL/min ± 4% |
Co-solvent percent: |
5% Methanol ± 4% |
Column temp.: |
25 °C ± 10% |
Back pressure: |
3,500 psi ± 10% |
At a given mobile phase composition, changes in pressure and temperature have an immediate impact on the density of the mobile phase (see Figure 1), which means we should expect chromatographic variation with variation in these method parameters. Flow rate on the other hand, has an indirect influence on the density of the mobile phase. While a change in flow rate should not alter an analytes retention factor in LC, the resulting pressure with a change in flow rate in SFC modifies the density of the mobile phase and therefore the retention factors of the analytes. Note that a change in percent co-solvent most often has the greatest impact on the analyte retention, compared to variations in any other parameters. Co-solvent not only impacts the solvent strength of the mobile phase, but also affects all the physical properties such as viscosity and density.
Method 1 represents an area in the operating space that has high mobile phase compressibility (see Figure 1) which means we should expect changes in mobile phase density with small changes in pressure and temperature. In Figure 2, we see the chromatographic responses with 4% changes in the flow rate and the co-solvent percent, and with 10% changes in the temperature and the ABPR pressure. The variation introduced into this method resulted in an average of 10.1% difference in retention factors for the analytes. For method 2, by increasing the controlled ABPR pressure from 1,750 psi to 3,500 psi we could improve robustness since the mobile phase density is less affected by changes in pressure and temperature in this region of the operating space (see Figure 1). The results corresponding to this set of experiments are shown in Figure 3. For this method, the average difference in retention factor is reduced to 5.5%.
For method 3, we see even less variation in chromatography since this method represents an area in the operating space with very low compressibility and therefore, very small changes in density with changes in pressure and temperature (see Figure 1). The results for method 3 are shown in Figure 4. Here the average percent difference in retention factors is reduced further to 2.6%. Figure 5 compares the average percent change in retention factors for each of the three methods. The general trend shows incrementally less chromatographic variation (with equal deliberate variation in method parameters) as we adjust the method conditions to regions of the operating space that exhibit less mobile phase compressibility.
720005548, December 2015