• 應用手冊

An Offline Automated Solid-Phase Extraction Method for Measurement of Serum 25-Hydroxyvitamin D for Clinical Research

An Offline Automated Solid-Phase Extraction Method for Measurement of Serum 25-Hydroxyvitamin D for Clinical Research

  • Billy J. Molloy
  • Lisa J. Calton
  • Donald P. Cooper
  • Waters Corporation
Medical blood plasma sample tubes in clinical lab

For research use only. Not for use in diagnostic procedures.

Abstract

LC-MS/MS is now widely used in many research laboratories for 25(OH)D measurement; however, many of these methods require manual sample pre-treatment, usually requiring experienced laboratory staff to successfully implement the methods. This application note describes a routine UPLC-MS/MS procedure for clinical research for measuring 25(OH)D utilizing an offline automated sample pretreatment with sample tracking to process samples from the primary tube to final results.

Benefits

  • Automated sample preparation for high volume 25-hydroxyvitamin D measurements
  • Minimal operator intervention
  • Method demonstrates good agreement with an EQAS scheme

Introduction

The demand for serum 25-hydroxyvitamin D, 25(OH)D, measurements has increased dramatically in recent years. While the role of vitamin D in bone metabolism is well established, comparatively little is known about its role in other diseases, although recent retrospective analysis of clinical trials data suggests possible links between vitamin D deficiency and a variety of diseases. Currently, considerable time, effort and funds are being applied to randomized, prospective clinical trials that aim to better define the link between vitamin D status and a variety of diseases, such as cancers, multiple sclerosis, heart disease and diabetes.1,2 Thus, an analytically accurate and precise measurement procedure having automated sample preparation is required to process the large number of samples from these clinical trials.

Vitamin D is available in two forms: the plant-derived vitamin D2 (ergocalciferol) and vitamin D3 (cholecalciferol), formed upon exposure of the skin to ultraviolet radiation. The accepted indicator of vitamin D status, total 25(OH)D [that is, the sum of 25(OH)D2 and 25(OH)D3] has been a challenge to measure accurately because the antibodies used in some immunoassays do not have 100% co-specificity for both 25(OH)D2 and 25(OH)D3. In fact, some immunoassays may under-report the total 25(OH)D level in samples from subjects receiving vitamin D2 supplementation.3 Therefore, many clinical research laboratories have now adopted LC-MS/MS based methods for measuring total 25(OH)D; allowing independent quantification of 25(OH)D2 and 25(OH)D3.

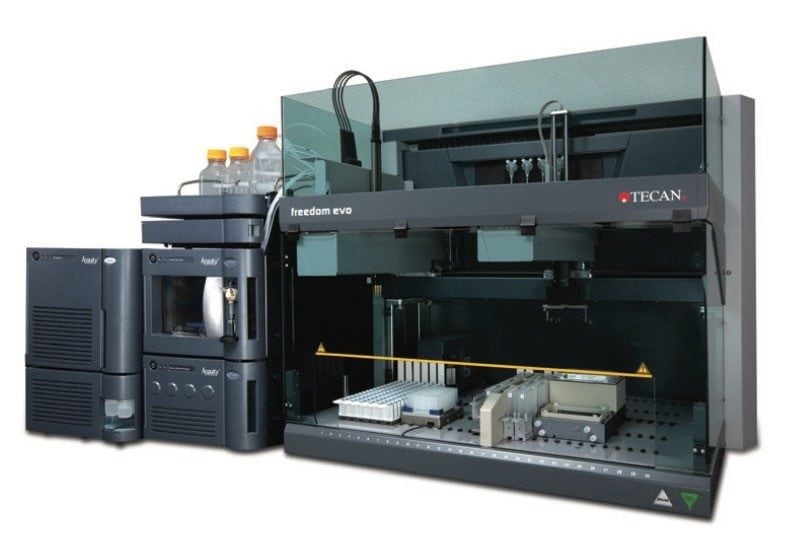
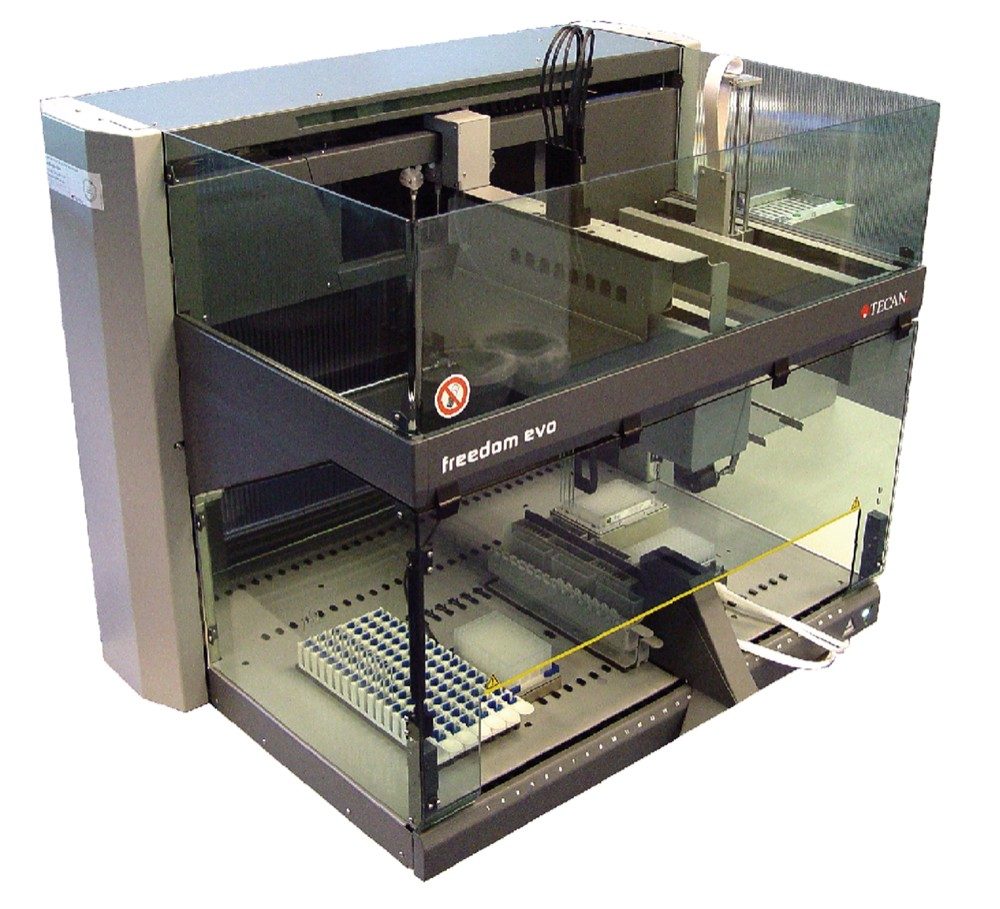
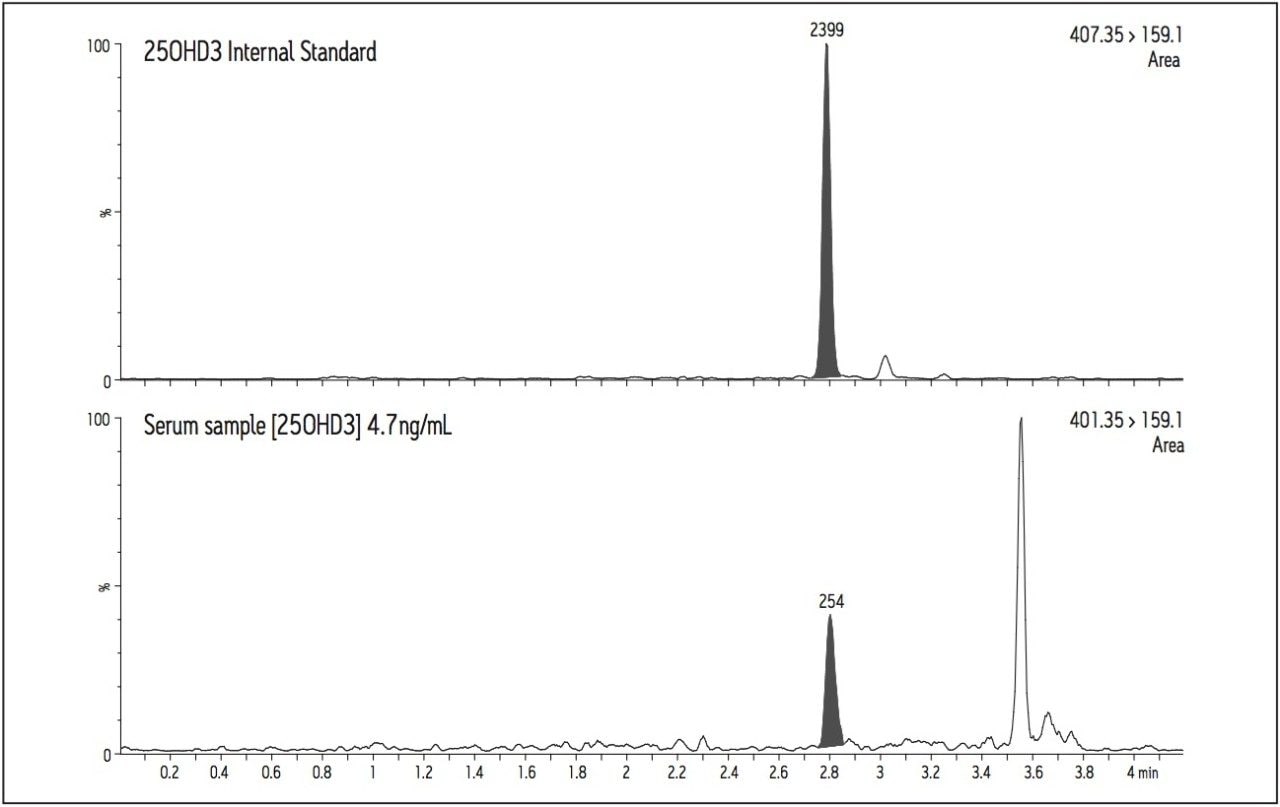
The analysis of 25(OH)D by LC-MS/MS requires sample pre-treatment to release it from the vitamin D binding protein and to minimize matrix effects. However, these steps are time-consuming and sample transfers may be subject to human error. This application note describes a routine UPLC-MS/MS procedure for clinical research for measuring 25(OH)D utilizing an offline automated sample pretreatment with sample tracking to process samples from the primary tube to final results.

Experimental

UPLC conditions

System:

ACQUITY UPLC System

Column:

ACQUITY UPLC BEH Phenyl Column,

2.1 x 50 mm, 1.7 μm

Column temp.:

35 °C

Flow rate:

450 μL/min.

Mobile phase A:

Water with 2 mM ammonium acetate and 0.1% formic acid

Mobile phase B:

Methanol with 2 mM ammonium acetate and 0.1% formic acid

Gradient:

65–85% B over 3 min

MS Conditions

System:

TQ Detector

Ionization mode:

ESI Positive

Capillary voltage:

0.8 kV

Cone voltage:

see Table 1

Desolvation temp.:

400 °C

Desolvation gas:

1000 L/Hr

Source temp.:

120 °C

Acquisition:

MRM analysis (Table 1)

Samples, Calibrators and Quality Controls

Serum 25(OH)D calibrators were obtained from a commercial source (Chromsystems, Germany). Assay precision was determined using high and medium quality controls (QCs) from a second commercial source (UTAK, USA), and a low QC was prepared in house by pooling human serum previously determined to have low levels of 25(OH)D3 and by adding a known concentration of 25(OH)D2. The final concentrations of the low, medium and high QC samples were 7.5, 34.3 and 81.4 ng/mL for 25(OH)D2 and 12.4, 31.2, and 71.3 ng/mL for 25(OH)D3.

Semi-Automated Sample Preparation

Sample Pretreatment:

Serum samples, calibrators and QCs were placed on an Offline Automated Sample Preparation System (OASPS; Waters Corporation, Milford, MA; Figure 1.) and identified by barcode to be tracked throughout the extraction procedure. Sample aliquots (150 μL) were transferred by the OASPS into a 96-well sample collection plate (p/n 186002482) and 20 μL of an internal standard solution (250 ng/mL of d6-25(OH)D3 and d3-25(OH)D2 in 80%MEOH/20%IPA) was added. Sample pretreatment was performed by adding 150 μL of an aqueous solution of 0.2 M ZnSO4 to each well. The plate was vortexed on the OASPS worktable for 1 min, followed by addition of 600 μL of methanol. The plate was again vortexed on the OASPS worktable for 5 minutes. These pretreatment steps ensure disruption of the binding between 25(OH)D and its binding protein, thereby allowing reproducible recovery of 25(OH)D. The plate was then centrifuged offline at 2,000 rpm for 5 minutes and returned to the OASPS worktable.

Waters Offline Automated Sample Preparation System (OASPS).
Figure 1. System configuration of the Waters Offline Automated Sample Preparation System (OASPS).

Solid Phase Extraction:

A 96-well Oasis HLB μElution solid-phase extraction (SPE) plate (p/n 86001828BA) was conditioned with 200 μL methanol followed by 200 μL 60% methanol. The OASPS transferred 600 μL of the sample supernatant to the conditioned Oasis HLB μElution plate. The plate was then washed with 200 μL of 5% methanol, followed by a second wash with 200 μL of 60% methanol. The retained analytes were eluted into an 800 μL 96-well sample collection plate (p/n 186002481) by the OASPS in a two-step elution protocol. The first elution consisted of 80 μL of 95/5 Methanol:IPA and the second elution consisted of 50 μL water. The collection plate was sealed manually; vortexed for 3 minutes on the OASPS worktable, and transferred to the ACQUITY TQD UPLC-MS/MS system. Injections of 20 μL were performed using the load-ahead feature of the ACQUITY Sample Manager. This resulted in an injection-to-injection time of less than five minutes.

The sample preparation time for 96 samples was approximately two hours involving minimal manual intervention, as outlined below in the workflow for a typical laboratory.

Workflow

t=0: Laboratory technician locates and manually loads serum samples, calibrators,
 QCs and reagents onto the OASPS.

t=+30mins: Laboratory technician initiates the OASPS pre-treatment protocol.

t=+1hr15mins: Laboratory technician removes the protein precipitation plate for centrifugation off-line.

t=+1hr20mins: Laboratory technician returns the plate to the OASPS and resumes the automated
 SPE protocol.

t=+2hr15mins: Laboratory technician seals collection plate and transfers to UPLC autosampler.

UPLC-MS/MS Analysis

A Waters ACQUITY TQD system (Waters Corporation, Milford, MA) was used for all analyses. The instrument was operated in positive electrospray ionization mode using MassLynx 4.1 Software with auto data processing by the TargetLynx Application Manager. The compound-dependent cone voltage was optimized to maximize the abundance of the precursor ion entering the source and selected to pass through the first quadrupole to the collision cell. Collision-induced dissociation was facilitated by argon and collision energy to produce characteristic product ions. Using this information a specific Multiple Reaction Monitoring (MRM) experiment was created as shown in Table 1.

Tuning parameters
Table 1. The tuning parameters used when monitoring 25(OH)D2 or 25(OH)D3 and their internal standards.
* denotes optional qualifier ion for added confidence of compound identity
Automated Liquid Handling component of OASPS.
Figure 2. Automated Liquid Handling component of OASPS.

Method comparison

The method was compared using thirty serum samples previously analyzed at the Clinical Biochemistry Department, Bristol Royal Infirmary (BRI) using a hexane liquid/liquid extraction LC-MS/MS assay. Samples were anonymized following advice from the UK National Research Ethics Service.

Results and Discussion

Linearity

The linearity of the assay was determined by the addition of 25(OH)D2 and 25(OH)D3 to horse serum (Sigma-Aldridge, UK) at specific concentrations over the range 2.5–220 ng/mL. The correlation between analyte concentration and response (analyte area/IS area) was linear for both analytes once a day for five days.

The coefficient of determination (r2) for 25(OH)D3 was > 0.998 (Figure 3) and > 0.997 for 25(OH)D2. Calculated concentrations for the calibrators were all within 10% of the assigned values, a deviation of ± 15% of the nominal value was accepted at the limit of quantification for each analyte.

Horse serum calibration curve for 25(OH)D3.
Figure 3. Horse serum calibration curve for 25(OH)D3.

Precision

The intra-assay precision was determined by extracting and quantifying five replicates of each QC level. The coefficients of variation (CV) for 25(OH)D2 and 25(OH)D3 were ≤7.7%. The inter assay precision was determined over five consecutive days analyzing five replicates of all QC samples with CVs <12% for both analytes (Table 2).

Intra- and inter-assay precision
Table 2. Intra- and inter-assay precision at the three levels of QC.

Accuracy

The accuracy of the assay for 25(OH)D3 was determined by the analysis of sixteen external quality control samples from the international Vitamin D External Quality Assessment Scheme (DEQAS; www.deqas.org). The calibration curve generated using the Chromsystems calibrators was used to calculate the DEQAS sample concentrations. All results were within 10.8% deviation of the 25(OH)D3 LC-MS method mean.

Recovery

The recovery of 25(OH)D2 and 25(OH)D3 was > 80% (analyte response to blank spiked horse serum pre-and post-extraction expressed as a percentage) over the analytical range of the assay.

Analytical Sensitivity and Specificity

A chromatogram of a serum sample with a calculated concentration of 4.7 ng/mL for 25(OH)D3 is shown in Figure 4. The quantification transition (m/z 401.35>159.1) enables reproducible peak integration and the quantification of 25(OH)D3 in samples having very low concentrations of this vitamin D metabolite.

Chromatogram of a low level serum sample.
Figure 4. Chromatogram of a low level 25(OH)D3 serum sample.

Ion suppression

Ion suppression was investigated during the development of the chromatographic conditions. The effects of phospholipids, plasticizers and release agents from labware and blood collection devices were all minimized.

Method comparison

Thirty anonymized serum samples from BRI were analyzed and the total 25(OH)D concentrations determined. Regression analysis was calculated using the Passing and Bablok method and agreement was assessed using the Bland-Altman method (Microsoft Office Excel 2003 with Analyse-It version 1.73).5,6 There was little difference between the methods (Waters = BRI + 1.3 ng/mL) when analyzed using the Bland-Altman difference plot. The overall regression line comparing the two methods was described by the equation: Waters = 0.98 (BRI) + 1.47 (r2 = 0.96), as shown in Figure 5.

Scatter plot and Passing and Bablok fit.
Figure 5. Scatter plot and Passing and Bablok fit.

Conclusion

LC-MS/MS is now widely used in many research laboratories for 25(OH)D measurement; however, many of these methods require manual sample pre-treatment, usually requiring experienced laboratory staff to successfully implement the methods.

The assay described in this Application Note for the analysis of 25(OH)D2 or 25(OH)D3 in serum demonstrates excellent linearity (r2>0.997) with good accuracy and precision over five consecutive days of analysis. In addition, the method demonstrates good agreement with a second, independent LC-MS/MS assay.

The offline automated method developed here uses the liquid handling and sample tracking capabilities of the Waters OASPS. The OASPS considerably reduces the need for manual intervention in sample preparation and reduces operator variability to ensure more consistent testing. Furthermore, the use of Oasis μElution plate technology eliminates the need for time-consuming solvent evaporation and reconstitution steps, allowing for the analysis of at least 192 samples per work shift.

The offline automated method for 25(OH) D analysis described here overcomes many of the limitations of current LC-MS/MS methods. In particular, several time-consuming and labor intensive manual sample pre-treatment steps have been eliminated. This will enable a wider range of research laboratories to implement UPLC-MS/MS for 25(OH)D analysis.

References

  1. Gorham ED, et al. Optimal vitamin D status for colorectal cancer prevention: quantitative meta-analysis. Am J Prev Med 2007;32:210–6.
  2. Garland CF, Gorham ED, Mohr SB, Grant WB, Giovannucci EL, Lipkin M, et al. Vitamin D and prevention of breast cancer: pooled analysis. J Steroid BiochemMolBiol 2007;103:708–11.
  3. Standing Committee on the Scientific Evaluation of Dietary reference Intakes Institute of Medicine. DRI Dietary Reference Intakes for calcium phosphorus, magnesium, vitamin D and fluoride. National Academy Press, Washington, DC; 1997.
  4. Hollis B. Editorial: The Determination of Circulating 25- Hydroxyvitamin D: No Easy Task. J ClinEndocrinolMetab, 2004;89(7):3149–51.
  5. Passing H, Bablok W. A new biometrical procedure for testing the equality of measurements from two different analytical methods. Application of linear regression procedures for method comparison studies in clinical chemistry, Part 1. J ClinChemBiochem 1983;21:709–20.
  6. Bland JM, Altman DG. Statistical methods for assessing agreement between two methods of clinical measurement. Lancet 1986;1:307–10.

Acknowledgement

Waters acknowledges Ann Bowron, Principal Clinical Scientist of the Department of Clinical Biochemistry at Bristol Royal Infirmary, UK, for providing clinical research samples and for her valued assistance and advice in the production of this application note.

720003139, March 2014

回到頁首 回到頁首