• 應用手冊

Xevo G2-S QTof and TransOmics: A Multi-Omics System for the Differential LC-MS Analysis of Proteins, Metabolites, and Lipids

Xevo G2-S QTof and TransOmics: A Multi-Omics System for the Differential LC-MS Analysis of Proteins, Metabolites, and Lipids

  • Ian Edwards
  • Jayne Kirk
  • Joanne Williams
  • Waters Corporation

For research use only. Not for use in diagnostic procedures.

Abstract

This study describes a multi-omics solution for the large-scale analysis of MS data from metabolomics and proteomics data sets.

Benefits

  • Simplified workflow, validation, and data interpretation
  • Designed for large-scale metabolomics and proteomics data sets
  • Integrated Omics platform for versatile and comprehensive qualitative and quantitative profiling
  • Statistically validated results across Omics sample sets

Introduction

Recent advances in omics technologies, including LC-MS-based metabolomics, lipidomics, and proteomics instrumentation, enable the quantitative monitoring of the abundance of various biological molecules in a high-throughput manner, thus allowing for determination of their variation between different biological states.

The ultimate aim is to improve the understanding of biological processes, leading to improved disease treatment efficacy, more efficient drug development, or maintaining optimal agricultural growth conditions for crop growth while minimizing infection and other negative effects. In this regard, the results provided from different analytical disciplines are often seen as complementary since they afford orthogonal insights.

The development and application of flexible informatics solutions that are capable of integrating the results from multiple discovery areas is of key importance. This study describes a multi-omics solution for the large-scale analysis of MS data from metabolomics and proteomics data sets. The Waters Omics Research Platform Solutions with TransOmics Informatics, featuring the Xevo G2-S QTof System, was utilized in a study comprised of both technical and biological replicates.

Results and Discussion

A metabolomics experiment was conducted involving the identification of low- and high-dosed samples versus a control/pool sample. According to the experimental design, the samples should be classified into three different groups and the marker ions responsible for the group separation identified. The TransOmics for metabolomics and lipidomics (TOIML) procedure involves the following steps:

1. Importing the raw MSE continuum data set (six technical replicates/group)

2. Peak alignment to correct retention time drift between analytical runs

3. Chromatographic peak normalization to allow comparison across different sample runs

4. Chromatographic peak detection (peak picking)

5. Ion deconvolution to group ions by compound

6. Compound identification against an available custom built database

7. Perform data analysis to find the ions (features) responsible for the separation of the groups into QC (pool),
blank (matrix), and analyte (high dose)

The matrix background comprised System Evaluation Matrix to which Analgesic Standard Mixture A was differentially added, creating a low- (QC) and high-dose (blank) sample. A pool sample (QC) was created by combing equal volumes of the low- and high-dose sample.

The metabolites were separated and analyzed using the ACQUITY UPLC I-Class System coupled with a Xevo G2-S QTof, operated in positive electrospray mode at a mass resolution of >30k FWHM. Data were acquired in LC-MSE mode, an unbiased Tof acquisition method in which the mass spectrometer switches between low and elevated energy on alternate scans. Processing, searching, and quantification were conducted with TOIML using a compound database.

Steps one, two, and three of the TOMIL procedure are detailed in another literature (TransOmics Informatics Powered by Nonlinear Dynamics, 720004344EN). The grouping by means of principal component analysis (PCA) of the detected ions prior to identification, as shown in Figure 1, represents a composite scores and loadings plot. Primary clustering at the technical replicate level and clear separation of the samples were achieved.

Principal component analysis of analyte
Figure 1. Principal component analysis of analyte (Analgesic Standard Mixture A high dose; purple), Blank (System Evaluation Matrix; light blue) and QC (pooled sample; dark blue).

Next, compound identification was conducted using an integrated search tool, leading to the correct identification of the four Analgesic Standard Mixture standards that can be detected in positive ion electrospray mode. An overview of the TOIML compound search results page is shown in Figure 2, highlighting the identification of caffeine based on accurate mass, retention time (optional), and theoretical isotopic pattern distribution.

Compound identification page TOIML
Figure 2. Compound identification page TOIML.

In addition to the previously described PCA, additional multivariate statistical tools are integrated within TOIML, including correlation and trend analysis. An example is shown in Figure 3, representing normalized trend plots for the four spiked standards, illustrating good agreement between the six technical replicates of each of the standards, as well as relative abundances that are in agreement with the experimental design.

Normalized abundance profiles analgesic standards
Figure 3. Normalized abundance profiles analgesic standards.

Moreover, TOIML enables the scientist to link the analysis results with other omics data or provide input into separate statistical software packages such as EZinfo. Results from downstream bioinformatics (i.e., Umetrics software) can be imported back into an analyzed experiment, combining all compound data into a single table to review or share.

For the proteomics experiment, three replicates of two 10-ng E.coli samples differentially spiked with bovine serum albumin (BSA), alcohol dehydrogenase (ADH), enolase, and glycogen phosphorylase B were analyzed. The injected on-column amounts for the spiked protein in the first sample (Mixture 1) were one femtomoles each and 8, 1, 2, and 0.5 femtomoles for the second sample (Mixture 2), respectively. The nominal expected ratios (Mixture 2:Mixture 1) were therefore 8:1, 1:1, 2:1, and 0.5:1. Here, the peptides were separated and analyzed using a nanoACQUITY UPLC System coupled to a Xevo G2-S QTof and operated in LC-MSE acquisition mode. Processing, searching, and quantification were conducted with TransOmics for Proteomics (TOIP) using a species specific database to which sequence information of the spiked proteins was appended.

The TOIP procedure involves the following steps:

1. Importing the raw MSE continuum data set (three technical replicates per sample)

2. Peak alignment to correct retention time drift between analytical runs

3. Chromatographic peak normalization to allow comparison across different sample runs

4. Chromatographic peak detection (peak picking)

5. Protein and peptide identification utilizing integrated database search algorithms

6. Multivariate statistical analysis

7. Absolute and relative quantitation

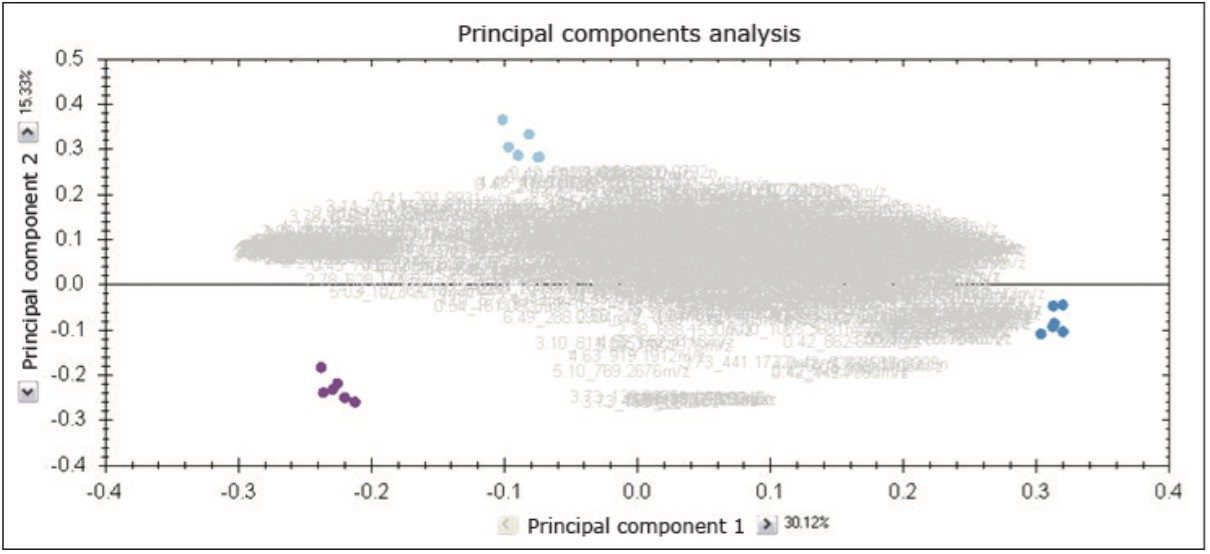
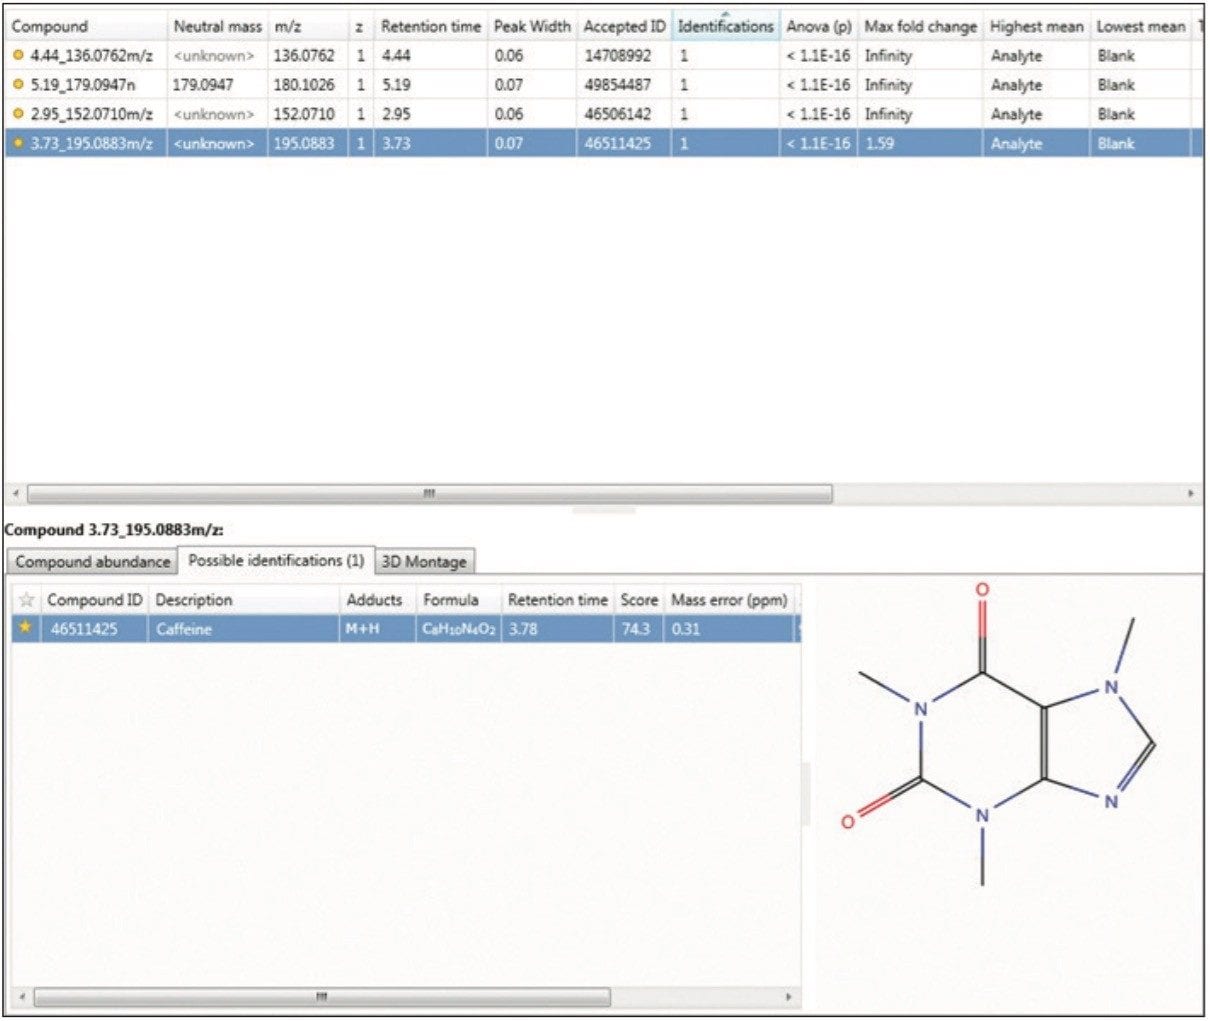
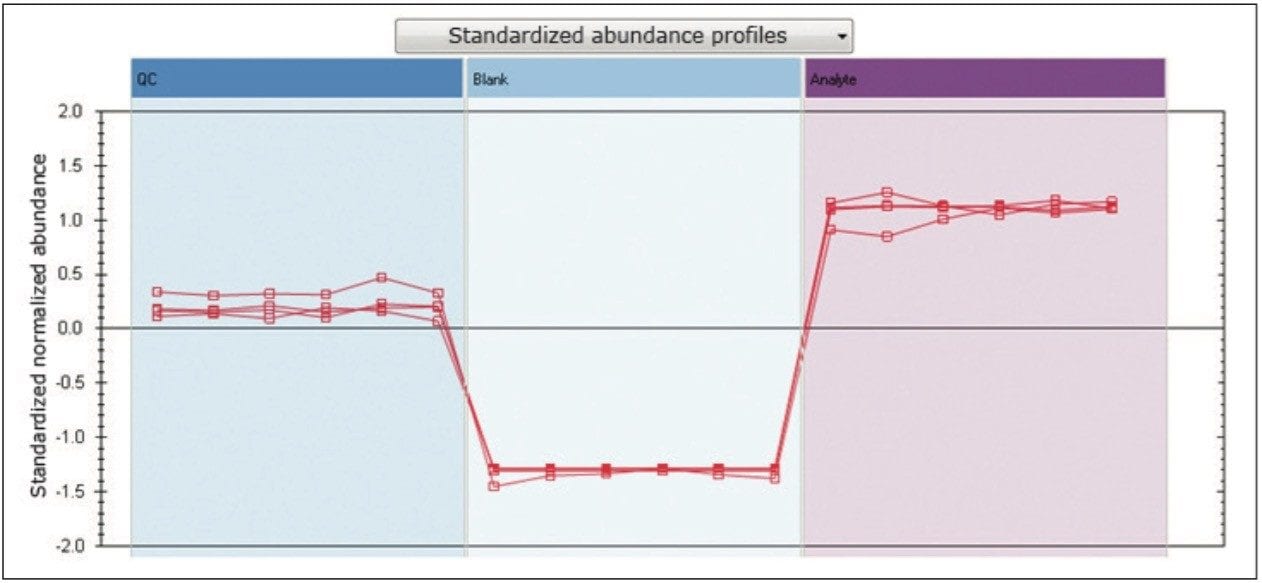
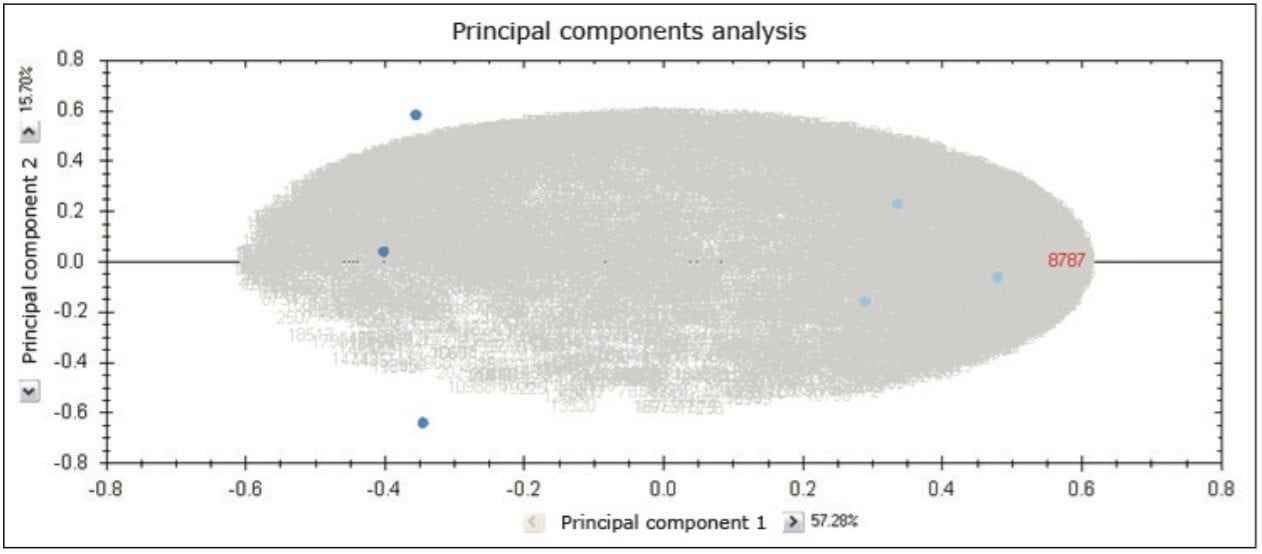
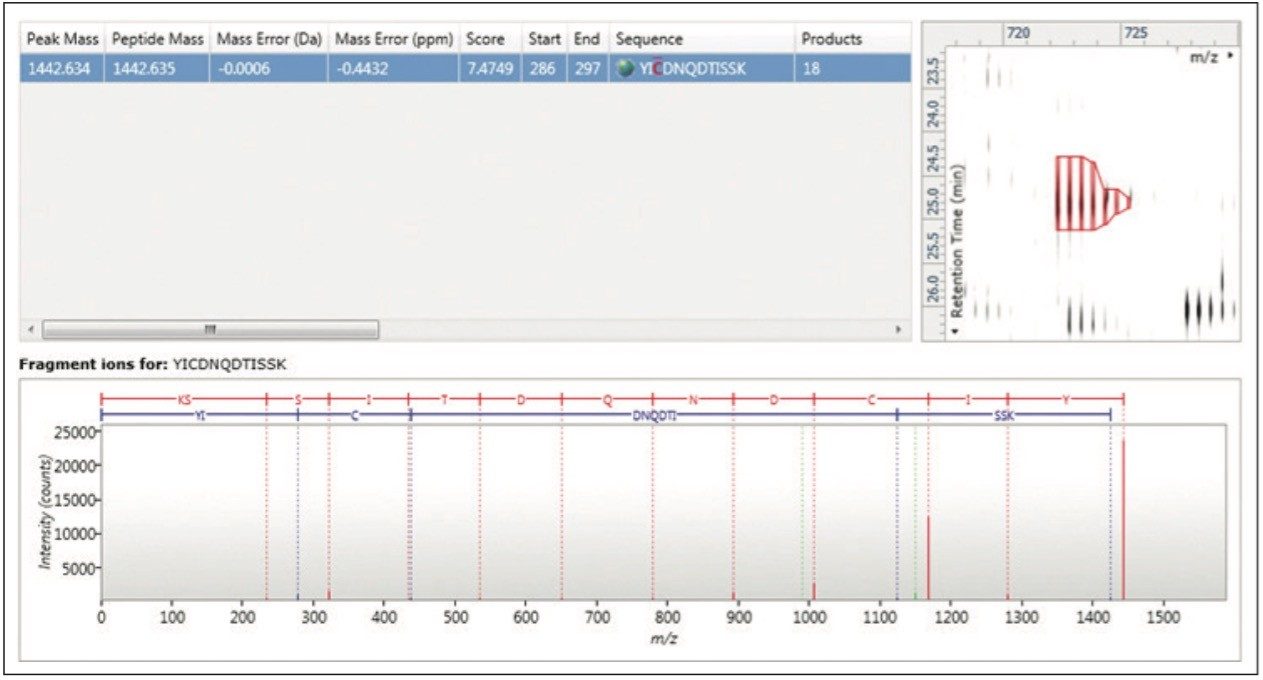
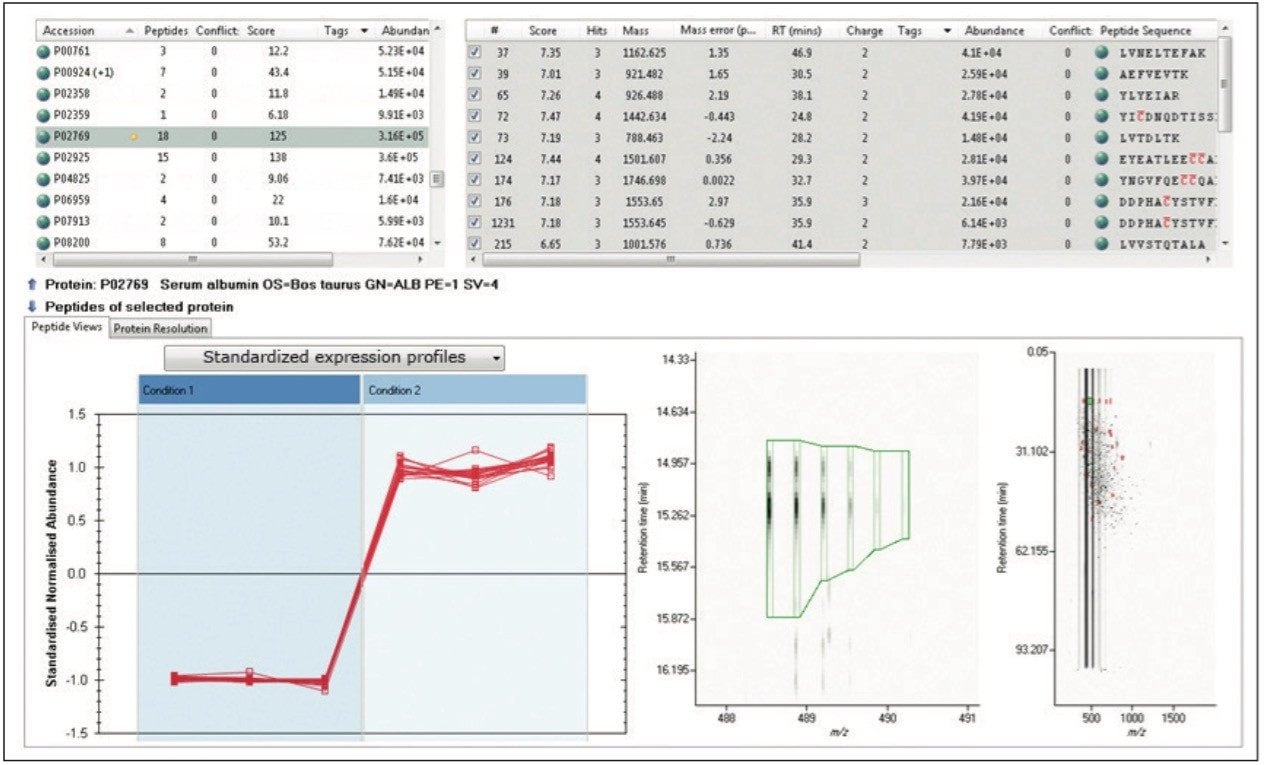
TOIP offers the same multivariate analysis tools as TOIML. Figure 4 illustrates an example of PCA of the detected features, i.e. charge state groups. Primary clustering at the technical replicate level can be readily observed. A qualitative peptide identification result for one of the spiked protein digest is shown in Figure 5, and the normalized expression profiles of all peptides identified to this protein are shown in Figure 6. The latter is demonstrative for the type of quantitation precision that can be obtained by means of label-free MS studies using and LC-MSE- based acquisition strategy.

PCA of Mixture 1 and Mixture 2
Figure 4. PCA of Mixture 1 spiked into E.coli (dark blue) and Mixture 2 spiked into E.coli (light blue) features (charge state groups).

Figure 5 shows the qualitative results overview for an LC-MSE acquisition of one of the analyses of the differentially spiked samples. In this particular instance, the on-column amount of highlighted BSA was 8 fmol and the amount of E.coli digest equal to 10 ng. The results, shown in Figure 6, demonstrate the corresponding relative quantification result.

Qualitative LC-MSE identification for a bovine serum albumin peptide
Figure 5. Qualitative LC-MSE identification for a bovine serum albumin peptide that was differentially spiked into E.coli. Shown clock-wise are the identification associated metrics (score and error), a detail of the contour plot, and the annotated product ion spectrum.
 Quantitative profiling of the peptides identified to bovine serum albumin
Figure 6. Quantitative profiling of the peptides identified to bovine serum albumin.

Conclusion

  • TransOmics Informatics provides an easy-to-use, scalable system for multi-omics studies
  • LC-MSE (LC with Data Independent Acquisition MS) provides a comprehensive qualitative and quantitative data set from a single experiment
  • Complementary information can be rapidly obtained and linked from metabolite, lipid, and protein analysis

720004738, June 2013

回到頁首 回到頁首