• 應用手冊

Enhanced Identification of Trace-Level Peptides from Complex Protein Digests Using the Ionalytics Selectra in LC-MS Experiments

Enhanced Identification of Trace-Level Peptides from Complex Protein Digests Using the Ionalytics Selectra in LC-MS Experiments

  • Karin Venne
  • Eric Binneil
  • David. A. Barnett
  • Pierre Thibault
  • Caprion Pharmaceuticals Inc.
  • Ionalytics Corporation
  • Waters Corporation

Abstract

This application note describes how researchers at Caprion Pharmaceuticals (Montreal, Canada) used the Ionalytics Selectra integrated with a Waters Micromass Q-Tof Mass Spectrometer to help identify these trace level peptides.

Benefits

  • Improved detection limits 
  • Reduced background 
  • Increased selectivity

Introduction

Protein identification using nano-LC-MS/MS provides reliable sequencing information for low femtomole levels of in-gel digests. However, this task is more challenging for subfemtomole peptide levels as precursor detection is often compromised by the presence of chemical noise associated with the ionization of the mobile phase constituents and column bleed. 

The Ionalytics Selectra provides a simple mechanism for reduction of this interfering chemical noise. Using FAIMS (high-field asymmetric waveform ion mobility spectrometry) technology, the Ionalytics Selectra separates gas-phase ions based on changes in mobility that occur as a function of electric field strength. The Ionalytics Selectra operates at ambient conditions and is easily installed between the existing atmospheric pressure ionization source and the inlet aperture of the mass spectrometer without venting of the vacuum system. 

The FAIMS technology uses a high voltage asymmetric waveform applied to a set of electrodes. This waveform is composed of a high voltage component called the dispersion voltage (DV) and an opposite polarity low voltage component. Application of the waveform causes ions introduced between the electrodes to oscillate. Differences in an ion’s mobility under low- and high-field conditions will cause the ion to travel different distances during the two phases of the waveform. Over time, the ion will drift towards one of the two electrodes. The ion drift can be overcome by applying a low DC voltage, called the compensation voltage (CV), to one of the two electrodes. A unique ion-focusing mechanism ensures that the selectivity offered by the CV is accompanied by high analyte transmission efficiency. 

Improvements in sensitivity and S/N using the Ionalytics Selectra are described for tryptic digests of standard proteins and post-nuclear membrane extracts from U937 differentiated macrophages.

Waters Q-Tof Ultima API Mass Spectrometer and the integrated Ionalytics Selectra.

Experimental

Protein Extracts

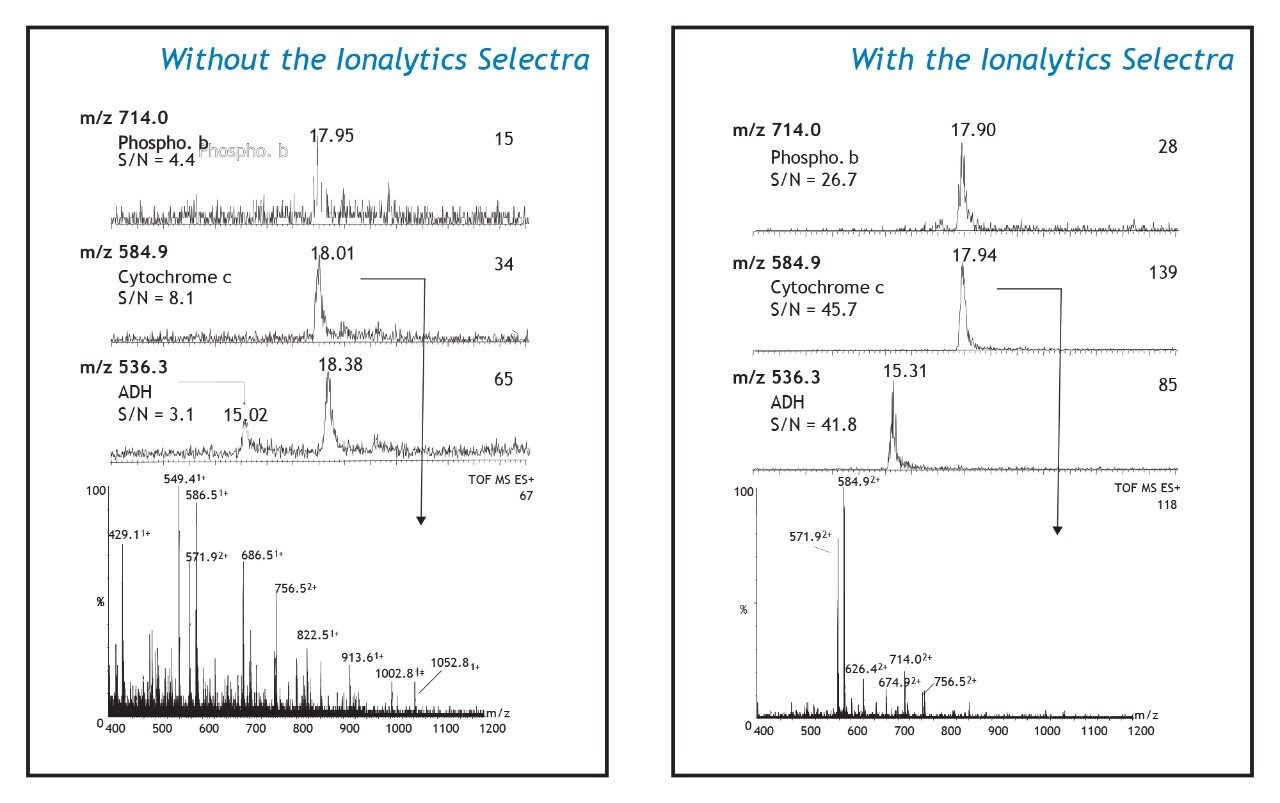
Protein standards phosphorylase b, cytochrome c, alcohol dehydrogenase (ADH), bovine serum albumin (BSA), and lactalbumin were obtained from Sigma Chemicals (St. Louis, MO) and used without further purification. 

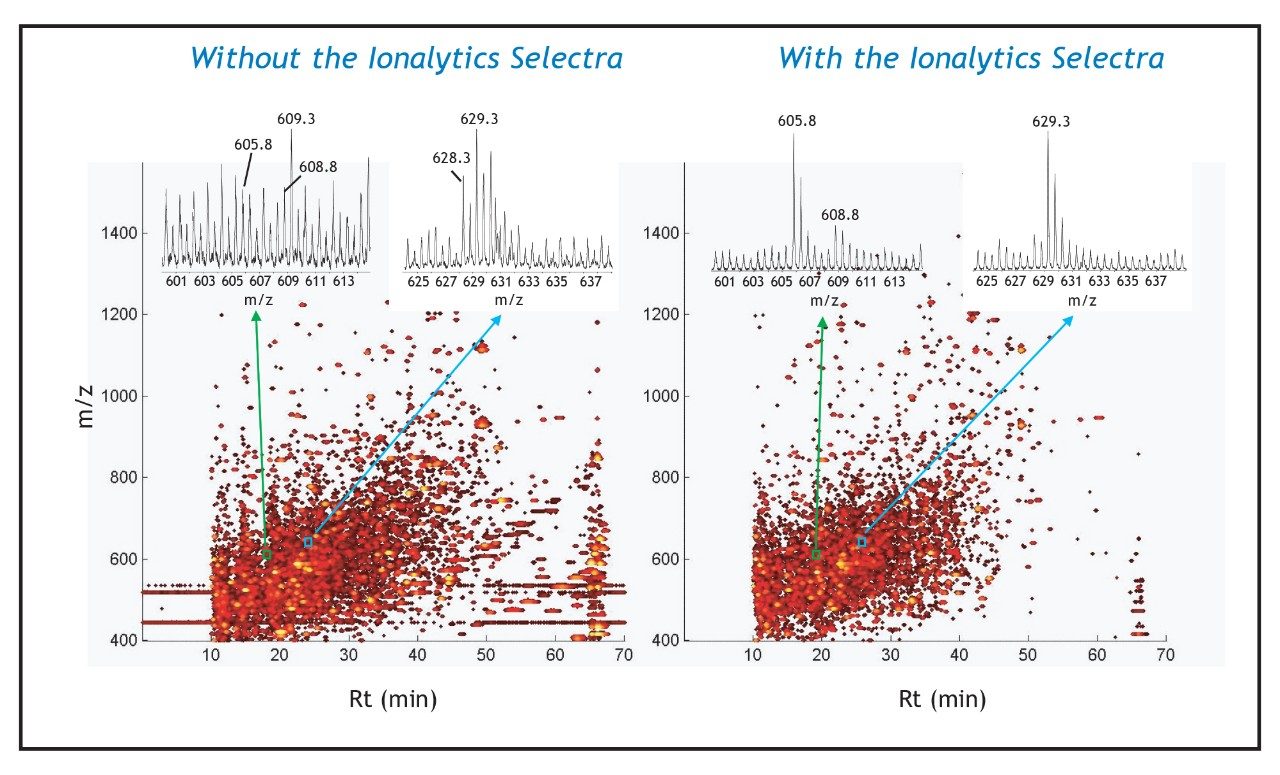
The pro-monocyte cell line U937 (ATCC CRL-1593.2) was grown in 10% fetal calf serum (FCS) supplemented RPMI-1640 with glutamine and penicillin/streptamycin up to a density of 2 million cells/ml. Cells were then used as “monocytes” or differentiated into “macrophages” by exposing them to 25 nM of phorbol ester (PMA) for 48 hours. Cells were harvested, washed, disrupted by cavitation in 200 mM ammonium bicarbonate, and centrifuged (first at 1000 g and then at 100 000 g) to remove nuclei and cell debris. This extraction procedure produced a post-nuclear membrane (PNM) enriched in total membrane proteins. Protein concentrations were obtained using bicinchoninic acid (BCA).

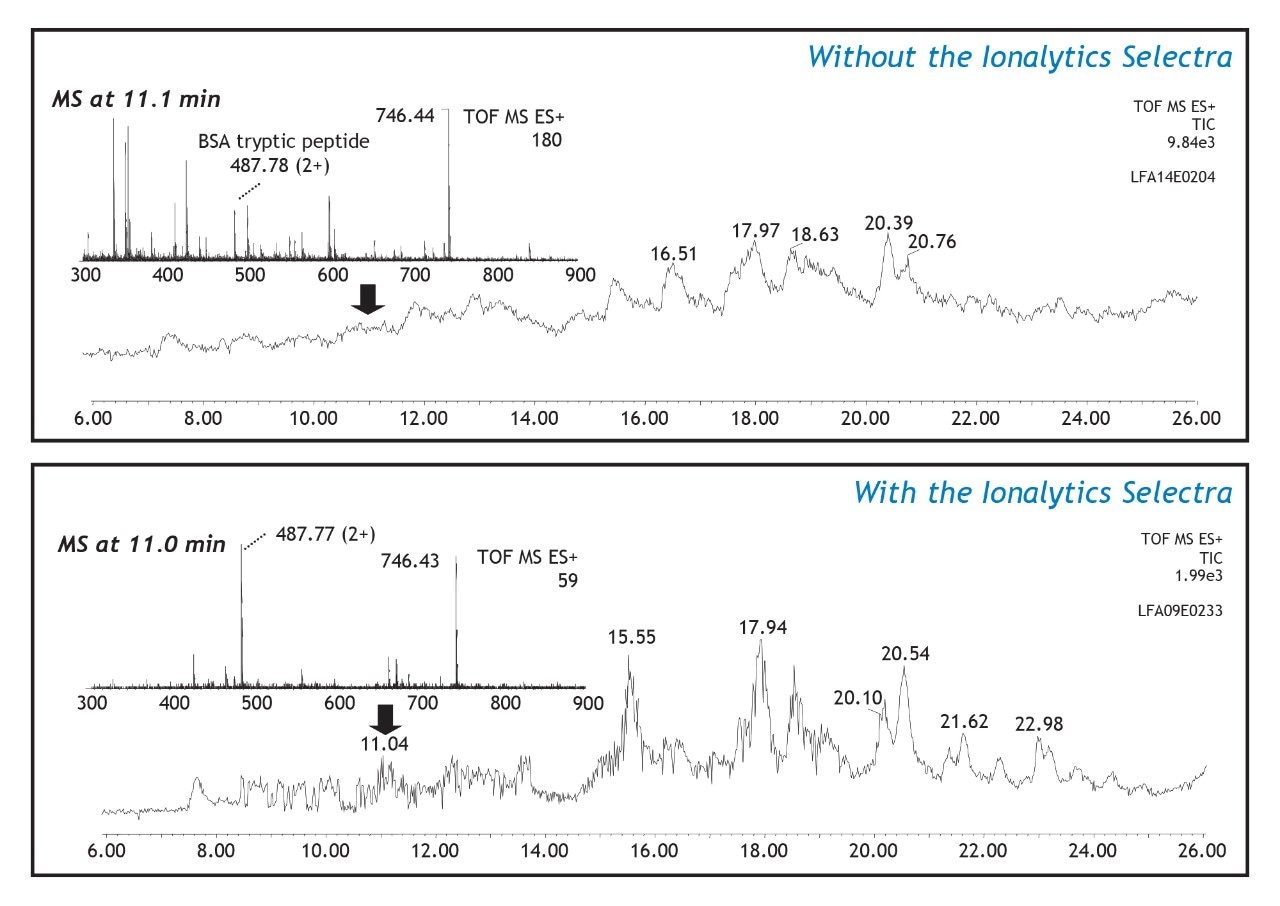
Tryptic digestion of the mixture of standard proteins was performed as follows: each protein was diluted in 100 mM ammonium bicarbonate (pH 8.1) to a concentration of 1 μg/μL. Trypsin was added (enz/prot: 1/25) and the digestion proceeded overnight at 37 °C. The tryptic digests were then pooled and diluted with 0.2% formic acid and 5% acetonitrile to a concentration of 10 fmol/μL.

Protein extracts obtained from U937 cells were prepared in aliquots of 100 μg of PNM and each was treated with DNAse and diluted in 100 mM sodium carbonate (pH 11.0). The sample was centrifuged at 14.000 g and the pellet was resuspended in 100 mM ammonium bicarbonate (pH 8.1) and digested overnight with trypsin (enz/prot: 1/25) at 37 °C. The sample was then reduced with tri (2-carboxyethyl) phosphine (TCEP) following digestion.

Mass Spectrometry

Mass spectrometry analyses were conducted using a Waters/Micromass Q-Tof micro or Q-Tof Ultima (Manchester, UK) equipped with a modular Waters CapLC liquid chromatograph. The LC-MS system consisted of a C18 Symmetry Precolumn (5 mm x 300 μm, Waters) and an analytical column (10 cm x 150 μm i.d., Jupiter 5 μm C18 particles, Torrance, CA). Tryptic digests were injected on the column, and peptide elution was achieved using a linear gradient of 10–60% acetonitrile (0.2% formic acid) in 60 minutes. All MS/MS spectra were obtained using data-dependent experiments with Ar as a collision gas. The Ionalytics Selectra electrodes were installed adjacent to the sampling cone of the mass spectrometer. The installation did not require venting of the instrument. The dispersion voltage was set at -4000 V and a gas mixture of 1/1 nitrogen/helium was used as the desolvation/carrier gas.

Results and Discussion

Two LC-MS separations of a tryptic digest from a mixture of five proteins (20 fmol/inj.) are presented  in Figure 1. The top panel shows a total-ion-chromatogram (m/z 300–1600) collected without the Ionalytics Selectra, while the bottom panel shows the LC run collected with the Ionalytics Selectra installed between the ion source and the mass spectrometer. Each panel includes an extracted mass spectrum taken at a retention time of approximately 11 minutes. The TIC profile obtained for the conventional nano-LC-MS analysis (top) shows a relatively high baseline profile compared with that of the corresponding analysis using the Ionalytics Selectra at a CV of -15.5 V (bottom). The higher ion counts observed in the conventional nano-LC-MS analysis are attributed to singly charged solvent ions, ions associated with column bleed, and other non-specific interferences. In contrast, the mass spectrum extracted from the Ionalytics Selectra analysis shows a reduction of background ions since the majority of these ions are transmitted through the Ionalytics Selectra electrodes under different voltage conditions.

Figure 1. Total ion current (TIC) spectra obtained for LC-MS analyses of a tryptic digest of a mixture of five proteins (20 fmol/inj.). Top panel: conventional nano- LC-MS analysis. Bottom panel: nano-LC-MS analysis with the Ionalytics Selectra implemented (CV = -15.5 V). Inset in both panels are the extracted MS at 11 minutes. Data was acquired on a Q-Tof micro.

Figure 2 shows ion chromatograms, reconstructed from the analysis in Figure 1, for three doubly charged ions: m/z 714.0 (HLQIIYEINQR) from phosphorylase b, m/z 584.9 (TGPNLHGLFGR) from cytochrome c, and m/z 536.3 (EKDIVGAVLK) from ADH. These ions were observed in the conventional nano-LC-MS analysis (left panels) to have S/N values below 10:1. When the Ionalytics Selectra was implemented, these same ions showed S/N values that were 6- to 12-fold higher (right panels). These increases in S/N are the result of both higher ion intensity and lower background signal than obtained from the conventional nano- LC-MS analysis. The extracted mass spectra obtained for the doubly charged peptide ion at m/z 584.9 are presented in the bottom panels. The conventional nanoelectrospray mass spectrum has several peaks that are more intense than m/z 584.9, many of which arise from singly charged ions. The mass spectrum acquired when the Ionalytics Selectra was implemented (right panel) is greatly simplified. The majority of the singly charged background species observed in the conventional nanoelectrospray mass spectrum have been removed. Several doubly charged ions are easily identified, and have higher S/N ratios when compared with the conventional nanoelectrospray mass spectrum.

Figure 2. Ion chromatograms for three doubly charged ions, reconstructed from Figure 1. m/z 714.0 from phosphorylase b (HLQIIYEINQR), m/z 584.9 from cytochrome c (TGPNLHGLFGR), and m/z 536.3 from ADH (EKDIVGAVLK). Panels to the left were collected using conventional nano-LS-MS, and panels to the right included the Ionalytics Selectra (CV = -15.5 V) in the analysis. S/N values are improved when the Ionalytics Selectra is implemented, and the mass spectrum for cytochrome c is greatly simplified.

The Ionalytics Selectra can also be implemented in the analysis of much more complex protein samples, such as that arising from the digest of U937 macrophage cells. The PNM fraction is expected to contain in excess of 5000 proteins at concentrations ranging from 0.01 to 60 nM. The LC-MS analysis of a 500 ng injection of this digest is presented in Figure 3; the conventional nano-LC-MS data is shown in the panel to the left and the nano-LC-MS data collected with the Ionalytics Selectra implemented is presented in the panel to the right. The complexity of this sample is illustrated by the contour profile of m/z vs. retention time vs. intensity, where each dot corresponds to an individual ion. The logarithmic intensity scale shows a progressive increase in abundance for ions as the color transitions from black to bright yellow. The horizontal streaks at m/z 445.1 and 519.1 in the conventional nano-LC-MS analysis correspond to siloxane ion clusters typically observed as chemical noise. The vertical streak at 65 minutes corresponds to non-peptidic singly charged ions associated with column bleed. These peaks are not present in the Ionalytics Selectra analysis (right panel) as their transmission through the electrodes requires different electrical conditions.

Figure 3. Contour profiles of an LC-MS analysis of a digest of U937 macrophage cells. Panels to the left were collected using conventional nano-LS-MS, and panels to the right included the Ionalytics Selectra (CV = -16 V) in the analysis. Ion abundance increases as the color scale changes from black to yellow. Inset are mass spectra collected for the indicated regions from the contour profile. This data was collected using a Q-Tof Ultima.

Inset on each contour profile is a narrow region of the mass spectra for peaks highlighted by the small blue and green boxes. The mass spectra show three doubly charged precursors at m/z 605.8, 608.8, and 629.3 with higher S/N values using the Ionalytics Selectra (right insets) compared with nanoelectrospray (left insets). The enhanced sensitivity offered by the Ionalytics Selectra enabled the acquisition of meaningful MS/MS spectra for these tracelevel peptide ions, as shown in Figure 4. The product ion spectra of the doubly charged ions at m/z 629.3 and 608.8 provided characteristic fragment ions encoding the partial sequence of peptides VMSEFNNNFR and EEPGEDFPAAR corresponding to lysosome-associated membrane glycoprotein 3 (CD63) and Transferrin receptor protein (CD71), respectively. It is noteworthy that CD71 is expressed at levels less than 50, 000 copies/ cell, and that immunofluorescence microscopy yielded very faint staining for this protein. It was unambiguously identified in the present experiment. The doubly charged precursor ion at m/z 605.8 was not successfully identified through a Mascot database search, while BLAST supported the partial sequence assignment VC*QPEGER (modified cysteine residue shown by an asterisk) corresponding to a protein of unknown function.

Figure 4. Tandem mass spectra of the trace-level peptide ions identified in Figure 3 collected when the Ionalytics Selectra was implemented in the analysis (CV = -16 V).

Conclusion

The separation capability of the Ionalytics Selectra provides enhanced detection of high attomole to low femtomole amounts of peptides when compared with conventional nanoelectrospray mass spectrometry. This is achieved by higher transmission of targeted ions and by reduction of the chemical noise associated with transient signal arising from the electrospray process and/or column bleed during LC-MS experiments.

720000843, May 2004

回到頁首 回到頁首