Peak Shape Changes for a Previously Used Column

Peak Shape Changes for a Previously Used Column

Peak Shape Changes for a Previously Used Column

Peak Shape Changes for a Previously Used Column

As discussed in this series, changes in peak shape are a common problem in HPLC analyses. Ideally, peaks should be symmetrical, with a Gaussian shape [D. R. Stoll, LC-GC N. Am. 39 (2021), pp. 353–362]. The symmetry of a peak may be quantified by calculating the USP tailing factor (T), as illustrated in Figure 1. A tailing factor of 1 indicates perfect symmetry, while values less than 1 are referred to as fronting and values greater than 1 as tailing. Many methods require that the tailing factors for all peaks must be within a specified range. Tailing factors that deviate significantly from 1 may decrease the resolution of peaks that elute close together, making integration more difficult [D. R. Stoll, LC-GC N. Am. 39 (2021), pp. 353–362].

Calculation of the USP tailing factor from the full peak width measured at 5% of the peak height (W0.05) and the width of the front segment of the peak at 5% of the peak height (f).
Figure 1. Calculation of the USP tailing factor from the full peak width measured at 5% of the peak height (W0.05) and the width of the front segment of the peak at 5% of the peak height (f).

When setting up to run an established method on a previously used column, a suitability test should be carried out to check whether the column is in good condition. This test should assess the ability of the column and system to produce acceptable pressure, retention times, peak areas, peak widths, and peak symmetry. A significant change in any of these responses from the results previously obtained on the column could indicate a problem with it. An example is shown in Figure 2, which employed Waters reversed-phase QC reference material (p/n: 186006363). This reference material, which contains seven compounds, was analyzed using a gradient method. Initially (Figure 2A), the USP tailing factors ranged from 0.90 to 1.27, in an acceptable range. After the column was removed from the system then later reconnected, the same test method was carried out, producing the chromatogram shown in Figure 2B. While the retention times, peak areas and column pressure were similar to the initial results, the USP tailing factors for all seven peaks were higher, ranging from 1.32 to 1.65.

Chromatograms comparing the initial separation of the Reversed-Phase QC Reference Material (A), the separation after removing then reconnecting the column (B) and the results after reseating the connections (C).
Figure 2. Chromatograms comparing the initial separation of the Reversed-Phase QC Reference Material (A), the separation after removing then reconnecting the column (B), and the results after reseating the connections (C).

USP Tailing Factor

Peak

A

B

C

1

0.9

1.32

0.91

2

1.27

1.61

1.27

3

1.2

1.65

1.2

4

1.1

1.46

1.09

5

1.1

1.47

1.11

6

1.11

1.44

1.09

7

1.08

1.47

1.08

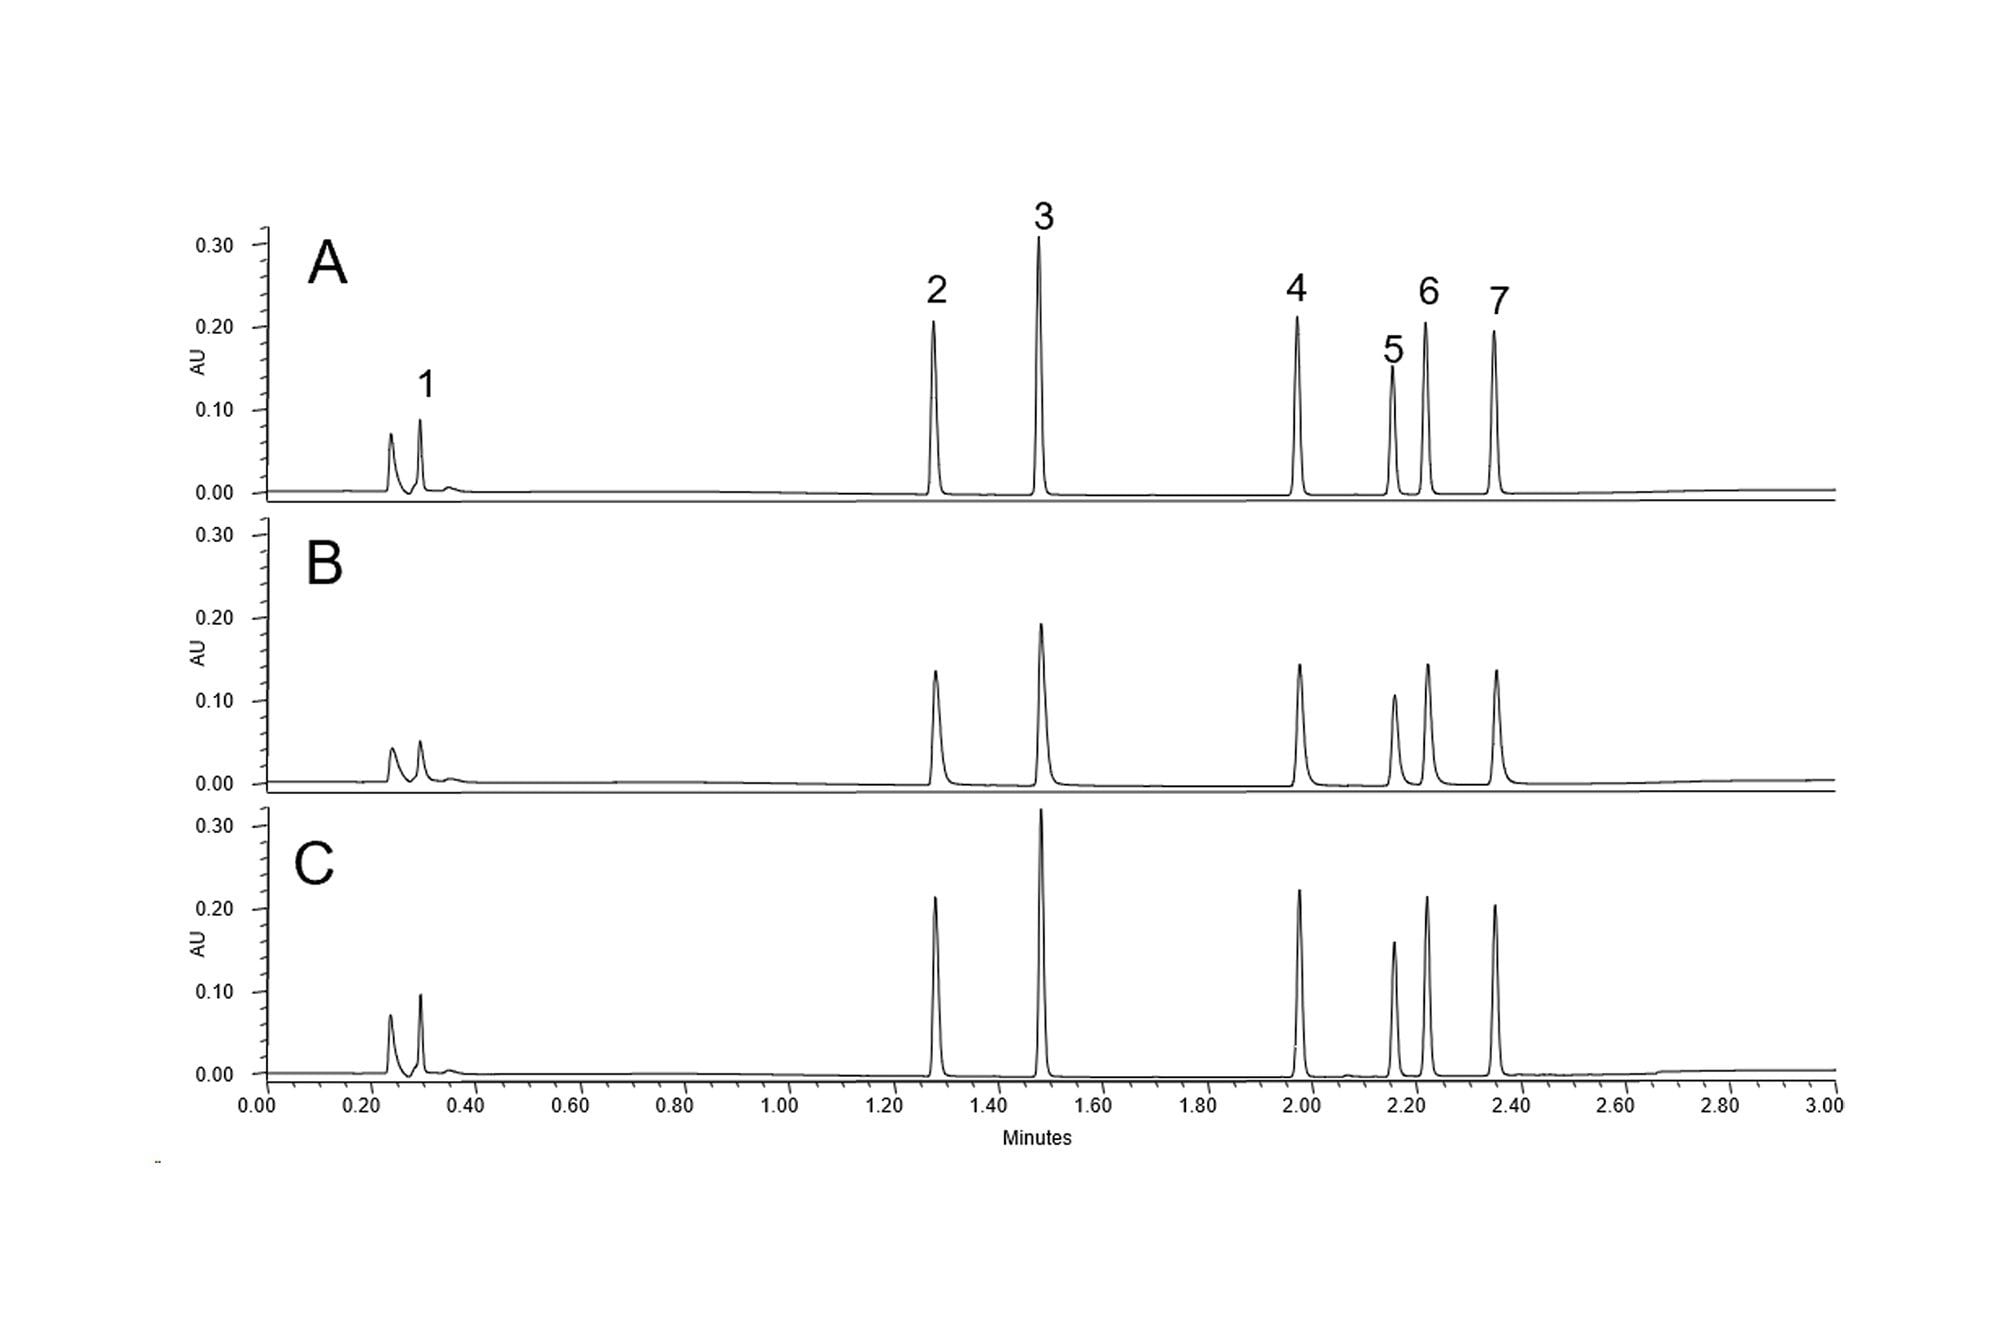
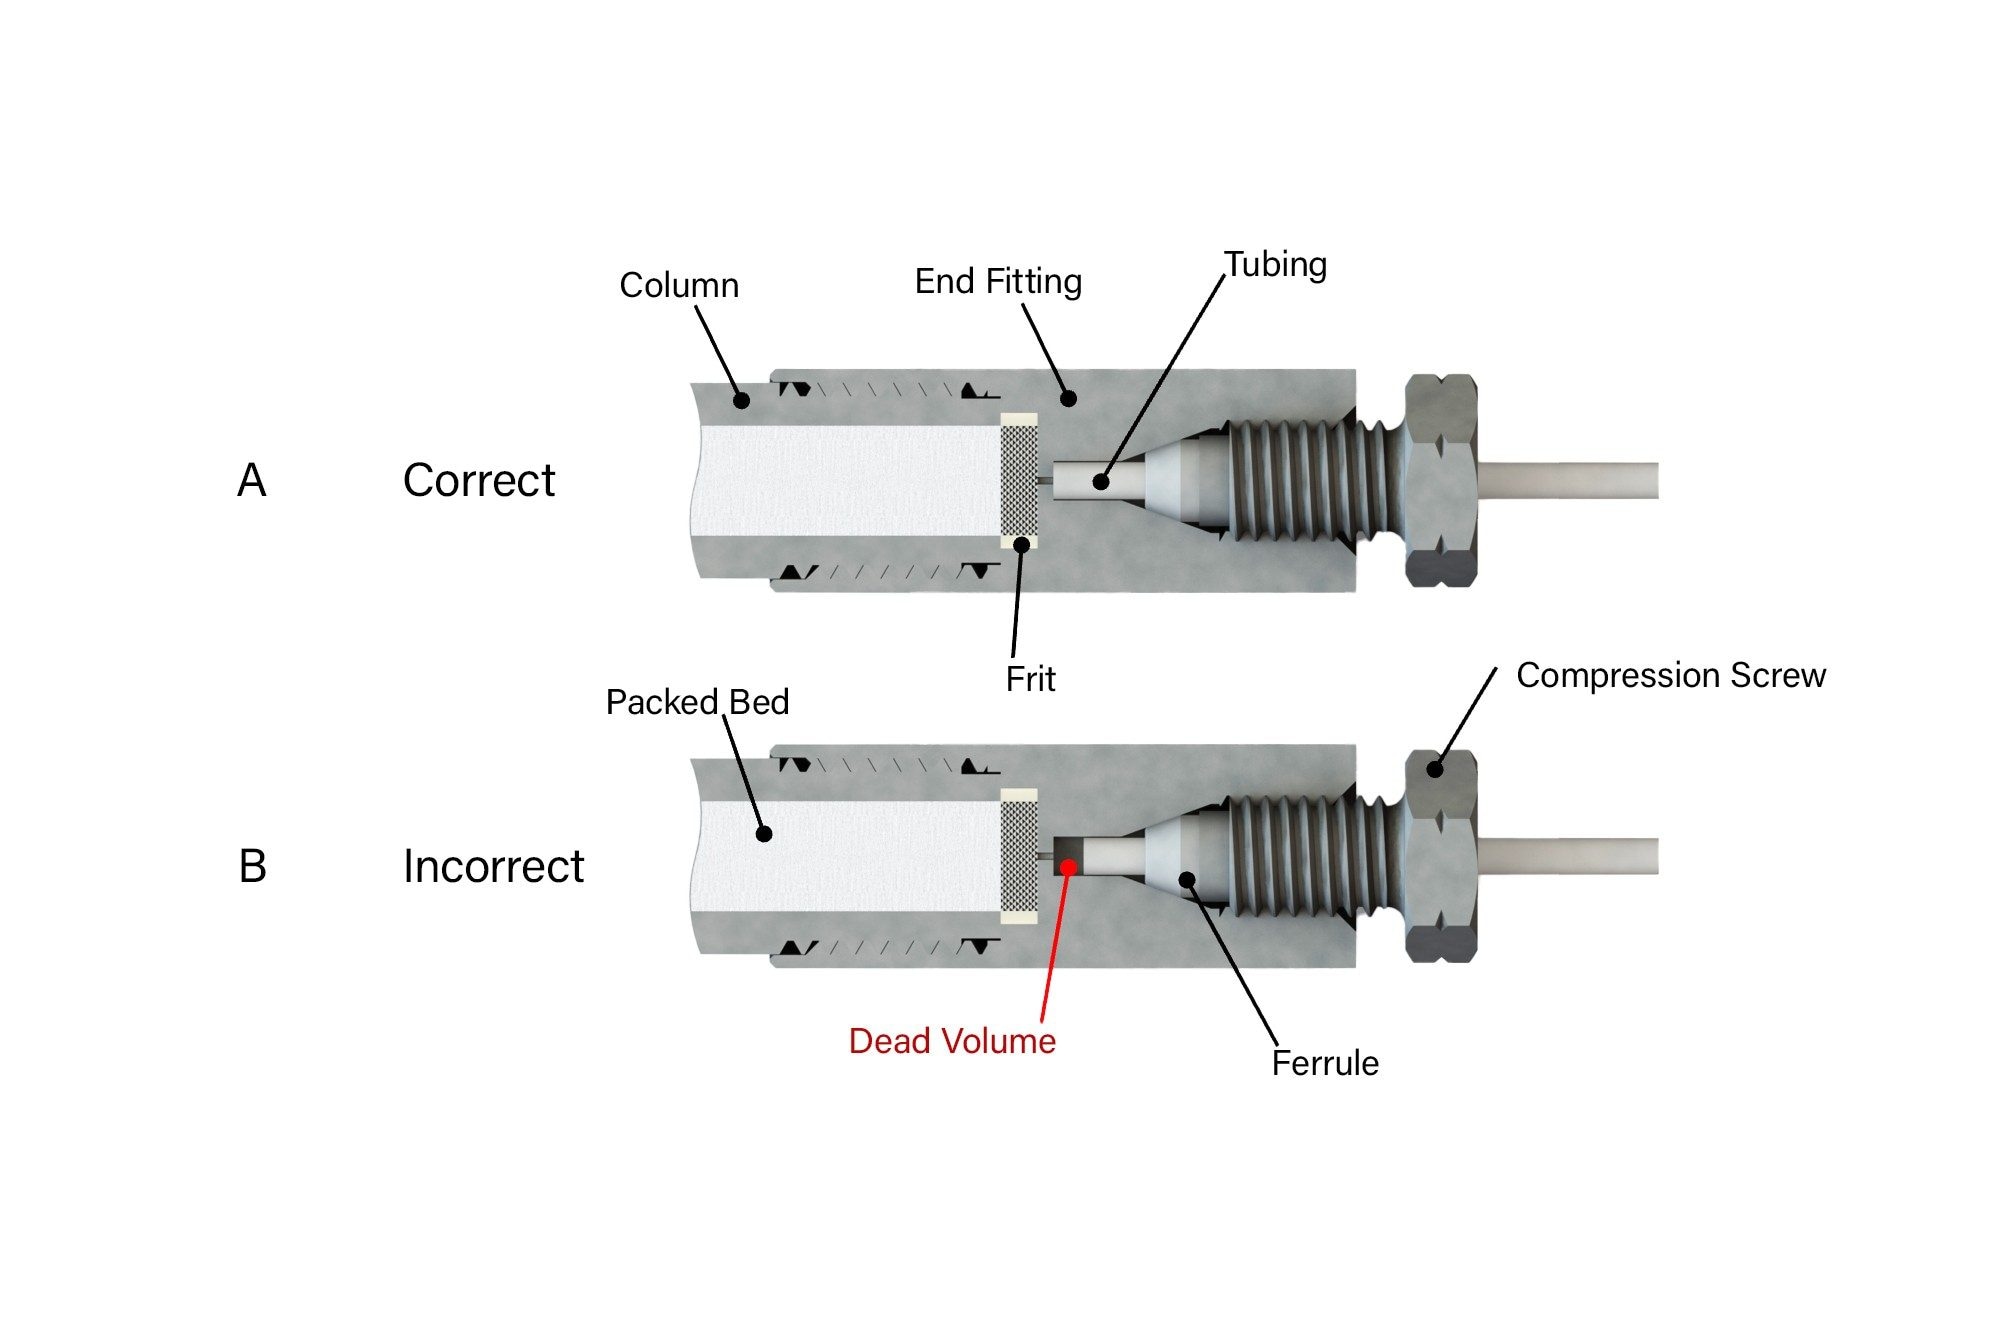
As discussed in part 1, there are several possible causes of changes in peak symmetry, including issues with the HPLC system, the mobile phase, the sample, and the column [J. W. Dolan and L. R. Snyder, Troubleshooting LC Systems, Springer Science+Business Media, New York, 1989, pp. 385–420]. As previously discussed, a good starting point for troubleshooting is to carefully analyze the chromatograms to observe whether the change in peak shape is seen for all the peaks, or only some of them. When all the peaks in a chromatogram show similar peak shape changes, as in Figure 2B, possible causes include the presence of a void in the column, accumulation of sample matrix constituents in the column or a poor connection of the column to the HPLC system. Because the problem hadn’t been seen when using the column previously, it is unlikely that the column had a void or an accumulation of sample matrix. That leaves a poor connection to the HPLC system as the most probable cause. The column connections were reseated, and the suitability test method was carried out again. As shown in Figure 2C, the USP tailing factors were restored to the initial values. This confirms that the problem was caused by an improper column connection, causing a gap between the column and the tubing connecting it to the system (see Figure 3). Even a small gap is enough to cause peak shape distortion. For demonstrations of how to connect columns with different types of end fittings to several HPLC systems, see the series of videos at this URL: How to Connect HPLC Columns to Waters LC Systems

Schematic cross sections illustrating the connection of tubing to an HPLC column: (A) a correct connection, (B) an incorrect connection with a gap creating dead volume.
Figure 3. Schematic cross sections illustrating the connection of tubing to an HPLC column: (A) a correct connection, (B) an incorrect connection with a gap creating dead volume.

Related

業界頂尖HPLC管柱,以創新充填材料與技術為後盾。讓方法開發或純化製備發揮最好的作用,支援您的實驗室展現完美效能。

使用以BEH技術設計的XBridge HPLC/UHPLC管柱可以發揮優異的穩定度和使用壽命,即使用於高pH值/低pH值、高溫和其他嚴峻的操作條件,依然毫不遜色。

CORTECS實心核顆粒管柱可以使用7種管柱充填材料,分1.6和2.7 µm兩種規格,能將LC分離的解析度與峰容量發揮到極致。

XSelect HPLC和UHPLC管柱用於鹼性化合物能發揮一流的選擇性並呈現最佳峰形。深入認識我們的CSH和高強度矽膠管柱。

高純度矽膠Symmetry HPLC管柱能發揮可預測的分析效能,也能保障批次間再現性。

SunFire HPLC分析級和製備級管柱都能發揮優異的高上樣量效能。認識SunFire矽膠、C8和C18管柱。

使用Atlantis Premier管柱增加極性分析物在更廣pH範圍內的滯留性,而且能避免分析物與表面產生不良交互作用。
回到頁首 回到頁首