Lipid Characterization of the NIST SRM 1950 Standard using Data-Dependent Analysis (DDA) with the Xevo™ MRT Mass Spectrometer
Lee A. Gethings, Nyasha Munjoma, Richard Lock
Waters Corporation, Wilmslow, United Kingdom
Published on November 27, 2025
Abstract
Lipidomics is a branch of metabolomics that focuses on the comprehensive analysis of lipids, molecules that play essential roles in cell structure, energy storage, and signaling. Unlike proteins and nucleic acids, lipids have a high diversity of structure and function, making their study challenging. By mapping the lipidome, the complete lipid profile of a cell, tissue, or organism, insights into physiological processes can be achieved, including disease mechanisms and metabolic regulation.
Benefits
- High mass resolution, sensitivity, and mass accuracy of the Xevo MRT Mass Spectrometer combined with a data-dependent analysis (DDA) strategy allows for in-depth profiling of the plasma lipidome.
- DDA provides high lipid coverage with highly informative fragmentation data. When combined with the excellent mass accuracy for MS and MS/MS (typically 1 ppm RMS or less), it results in highly confident identifications highly confident identifications when database searched.
- Low-level lipids can be readily identified due to the high signal-to-noise (s/n) performance of the MS.
- Efficient data processing workflow utilizing third-party tools (i.e., MS-Dial) is demonstrated using generic mzML files, which are generated at the point of acquisition from the DATA Convert Application.
Introduction
Mass spectrometry (MS) is a routine analytical tool used to gain greater insights into the lipidome by studying lipid extracts derived from various sources. MS platforms are required to have excellent sensitivity, resolution, and mass accuracy; the Xevo MRT Mass Spectrometer exhibits these attributes, allowing for the detection of low-level components while providing consistent mass resolution (up to 100,000 FWHM) across the entire mass range, independent of acquisition speed. These features, combined with the sub 1 ppm mass accuracy for highly confident compound identification, result in a flexible and highly attractive MS platform for OMICS-based analyses. DDA is a well-established data acquisition method and has the advantage of providing specificity and high-quality MS/MS spectra. The Xevo MRT Mass Spectrometer can acquire DDA data at scan rates of up to 100 Hz MS/MS. This application note presents a DDA workflow using the Xevo MRT Mass Spectrometer for the lipidomic analysis of the NIST SRM 1950 plasma sample and processed through third-party informatics.
Experimental
Sample Preparation for LC-MS
Lipids were extracted from the human plasma standard, NIST SRM 1950 (Sigma-Aldrich, Poole, UK). Extraction was conducted using the Bligh dyer method.1 Extracts were resuspended with methanol and injected as technical replicates (n=3). Injection volumes consisted of 1 and 2 µL for positive (ESI+) and negative (ESI-) ion, respectively.
LC-MS Data Acquisition
LC-MS data were collected using an ACQUITY™ Premier UPLC™ System coupled to a Xevo MRT Mass Spectrometer. The reversed-phase (RP) chromatographic separation consisted of a 12-min method (injection to injection) using an ACQUITY Premier CSH™ C18, 1.7 µm, 2.1 x 100 mm analytical Column (p/n: 186009461). The LC solvents comprised of mobile phase A (600:390:10; ACN:water:ammonium formate (10 mM) (v/v), 0.1% formic acid) and mobile phase B (900:90:10; IPA:ACN:Ammonium formate (10 mM) (v/v), 0.1% formic acid). A 10 min gradient (12-min turnaround) was implemented, starting with a solvent composition of 50% mobile phase B. Over 7-min mobile phase B was ramped to 80% before reaching 99% at 10 minutes. The solvent composition was held at 99% (mobile phase B) for 1.0 minute and re-equilibrated to initial conditions by 2 minutes, making it ready for the subsequent injection. Samples were injected as technical triplicates for both ionization modes.
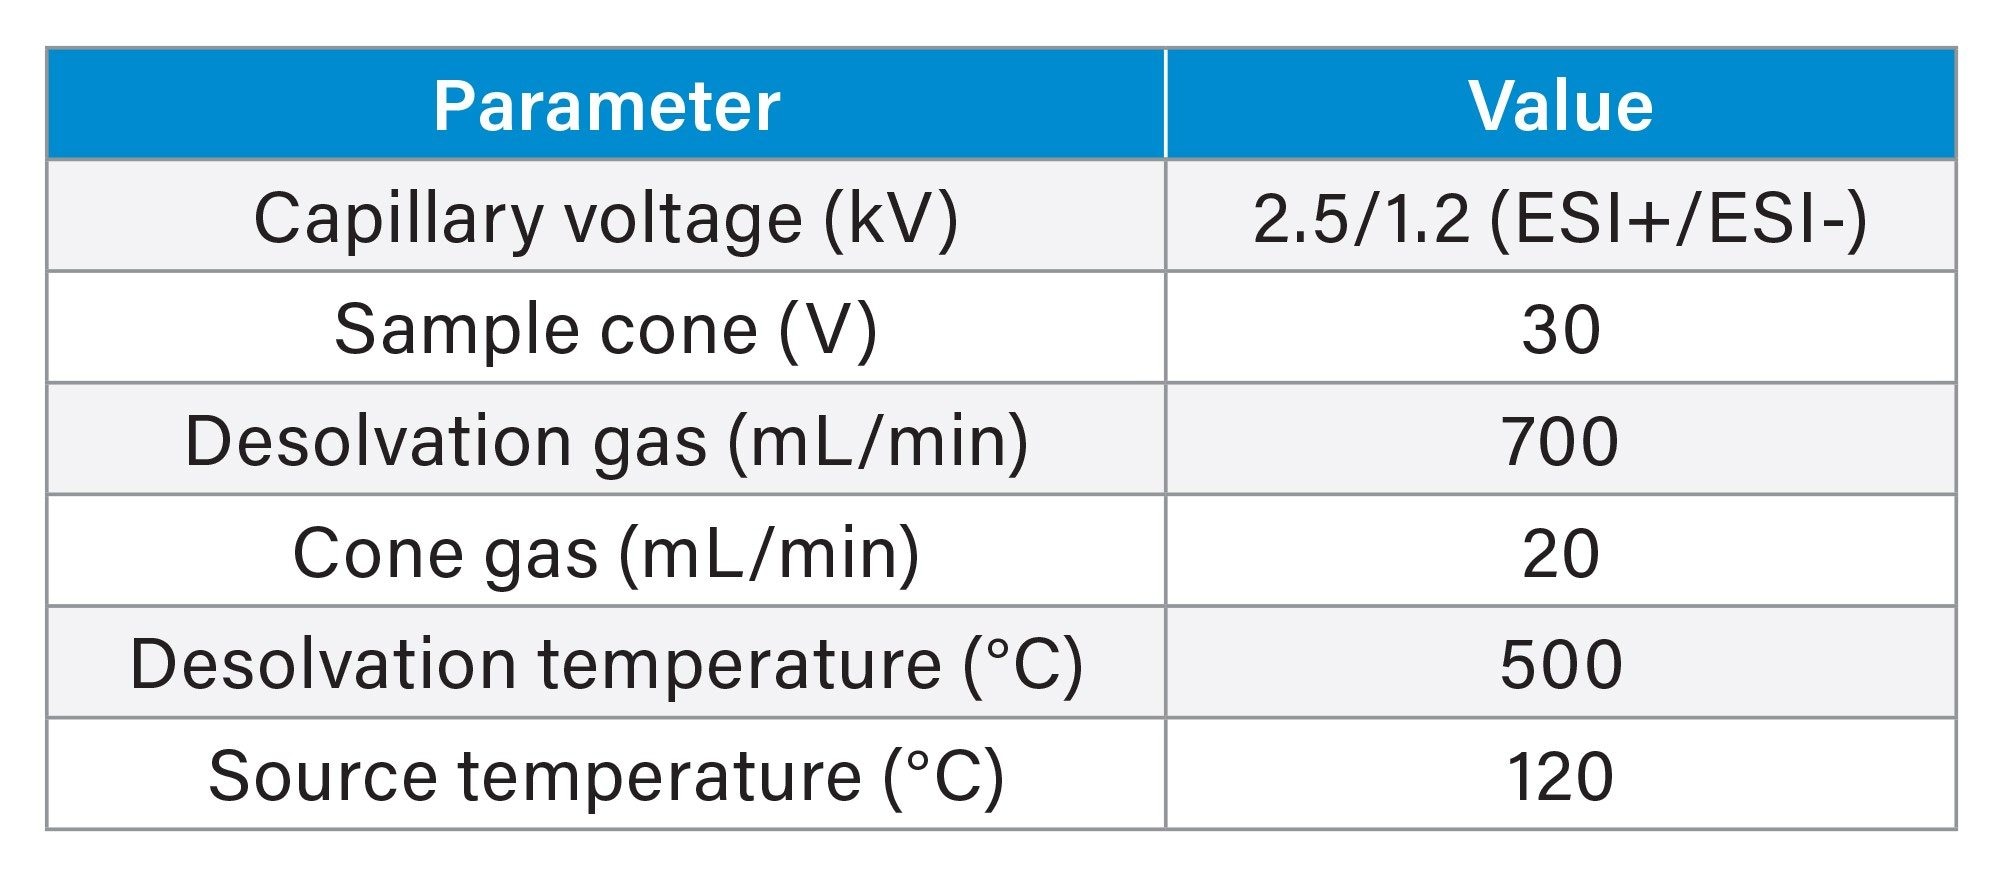
The Xevo MRT Mass Spectrometer was configured with the source settings as outlined in Table 1. MS data were collected using DDA in both positive and negative ion modes. DDA methods consisted of scan rates of 10 Hz (MS) and 20 Hz (MS/MS). A top 30 (ESI+) and top 20 (ESI-) setting were applied with a dynamic exclude of 5 ppm and a 2 second retention time tolerance. The quadrupole isolation window was set to 1 Da for all acquisitions.
Data Processing
The acquired data were processed using MS-DIAL.2 Data were peak picked and identifications provided by searching against the reference lipid database within MS-DIAL. Identifications were based on being referenced-matched and further curated using a score threshold of greater than 1.8.
Results and Discussion
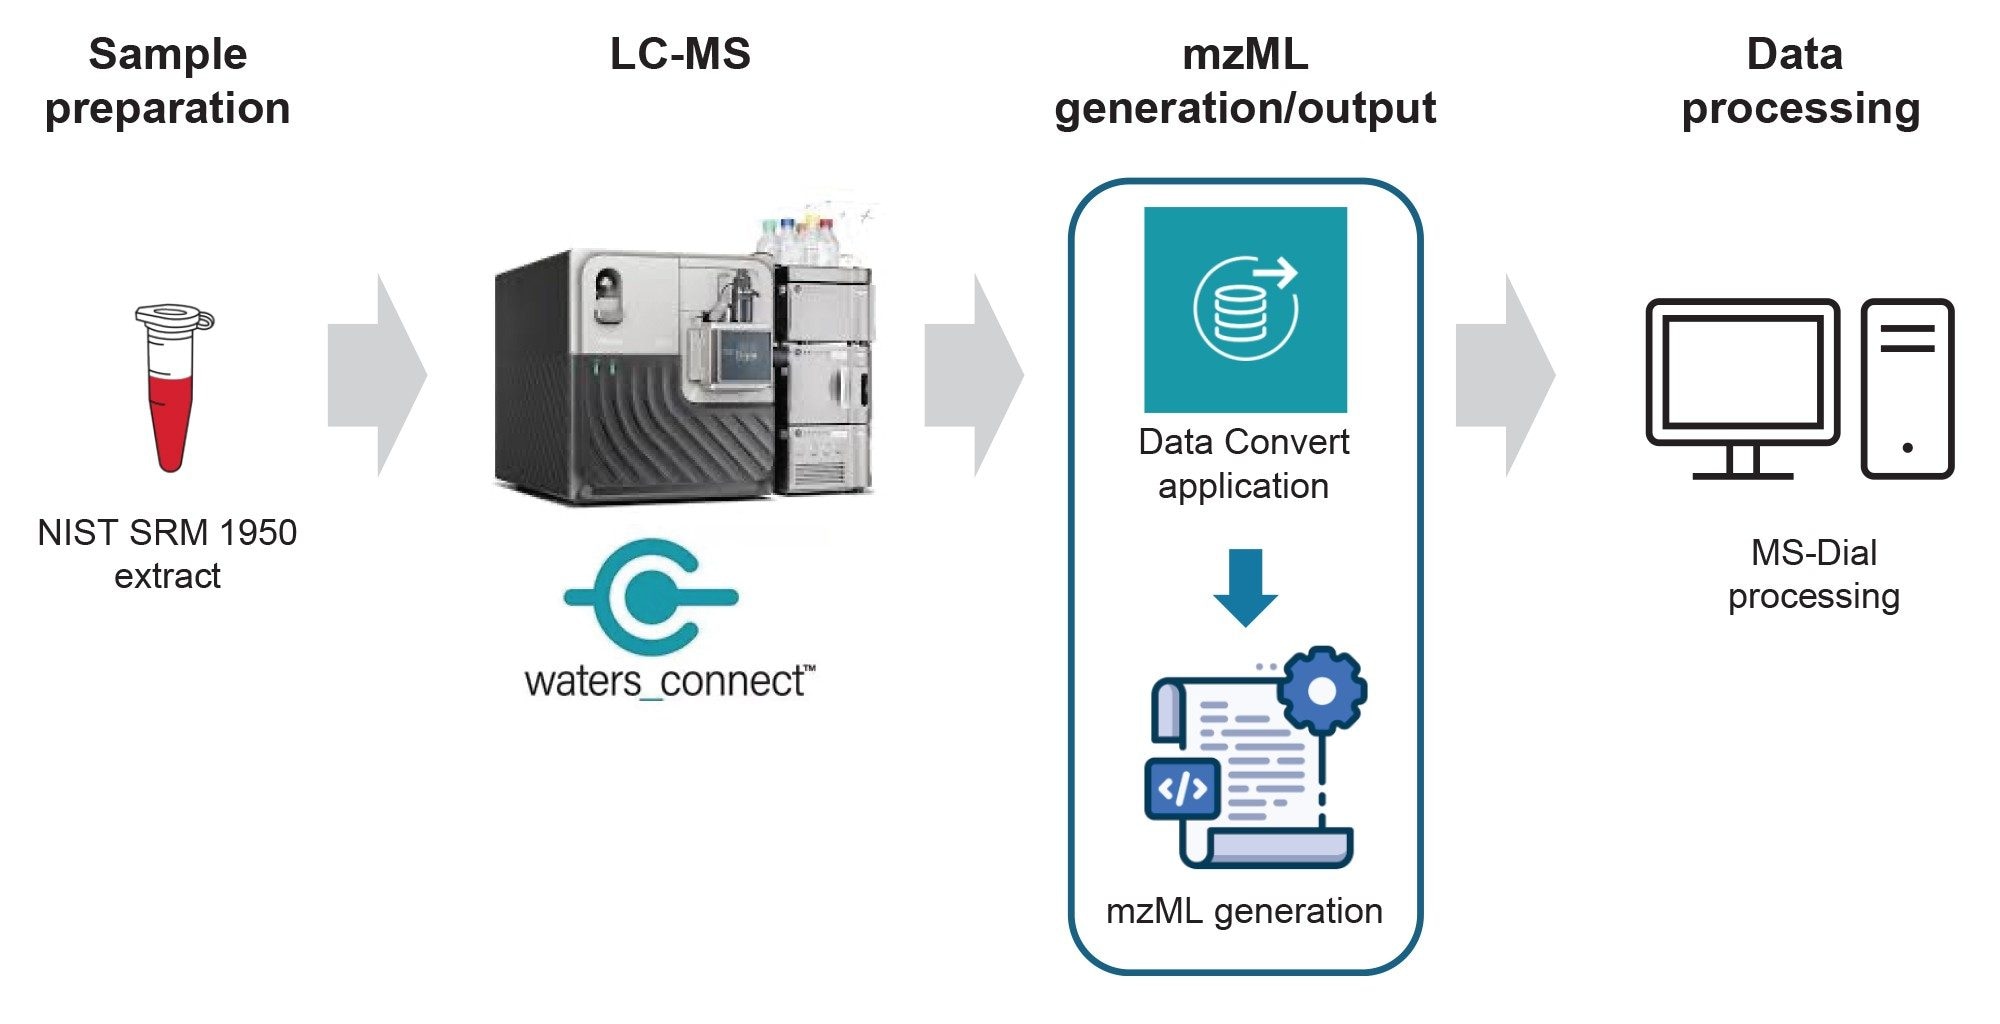
Lipid extracts were prepared as detailed in the experimental section from the NIST SRM 1950 sample (Figure 1). The LC-MS data were acquired using DDA and operated with the waters_connect™ Software Platform. The subsequent data were then generated as mzML files for additional data processing with the third-party software, MS-DIAL. The output of the mzML files was provided via the Data Convert Application automatically during data acquisition, thereby reducing processing time further downstream of the analysis.
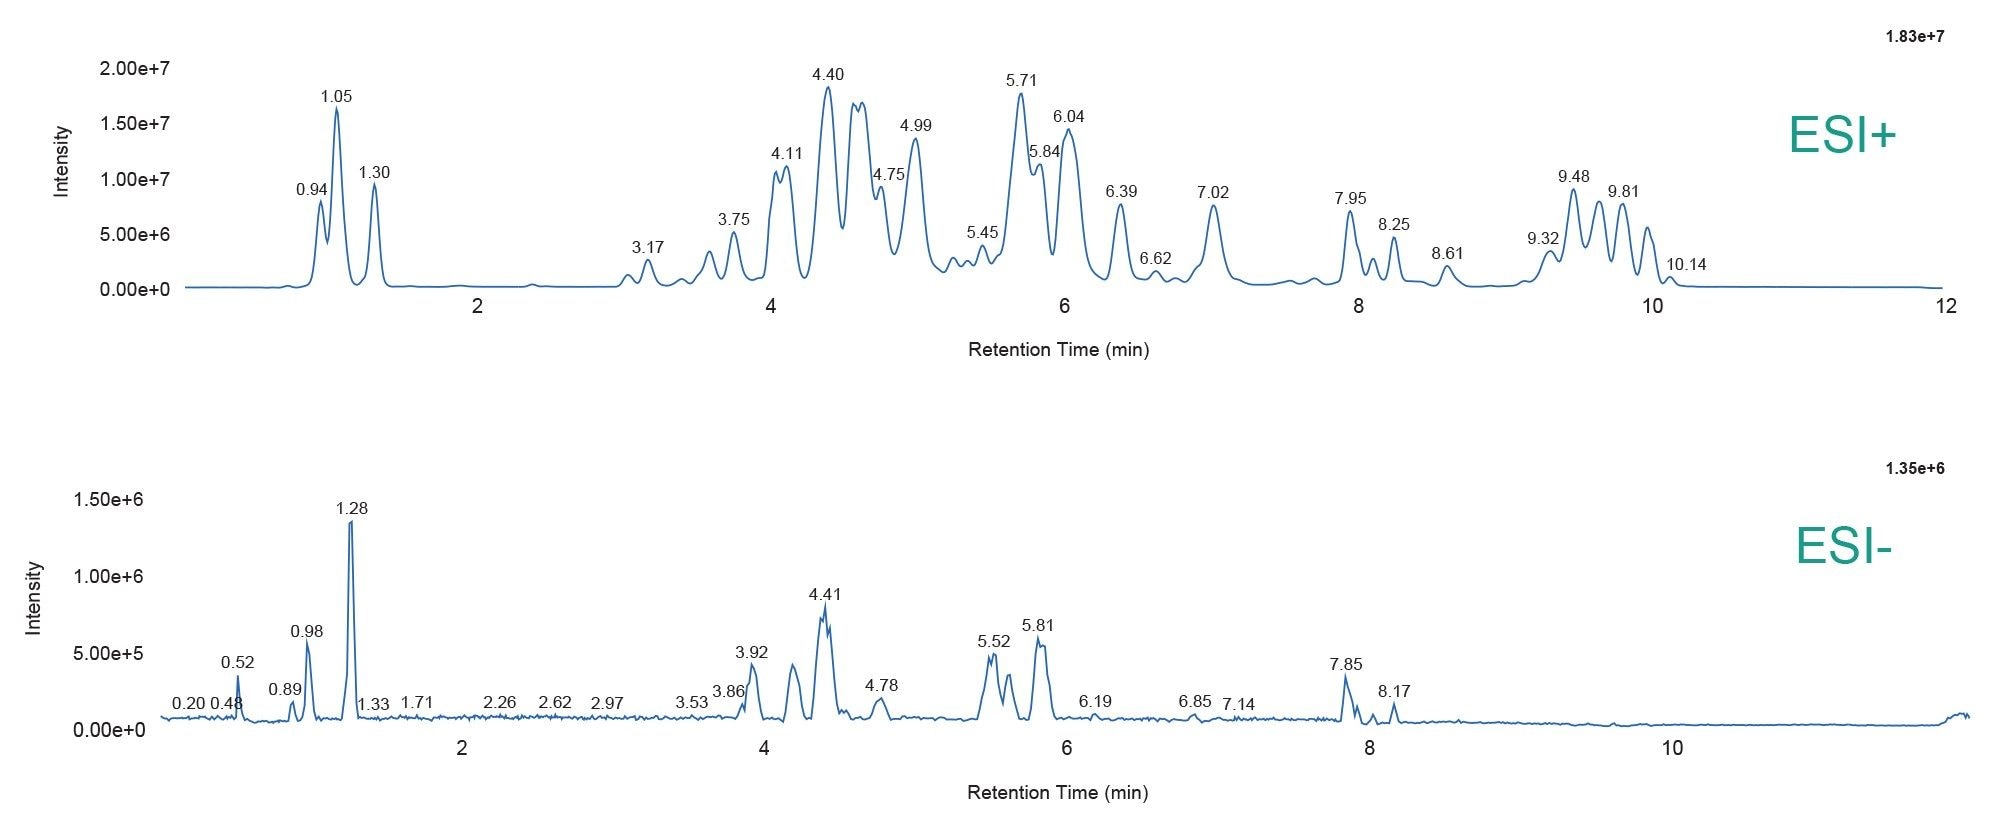
Example chromatograms for positive and negative ESI are provided in Figure 2. The data shows excellent signal response based on the 1 and 2 µL injected on-column for positive and negative ESI, respectively.
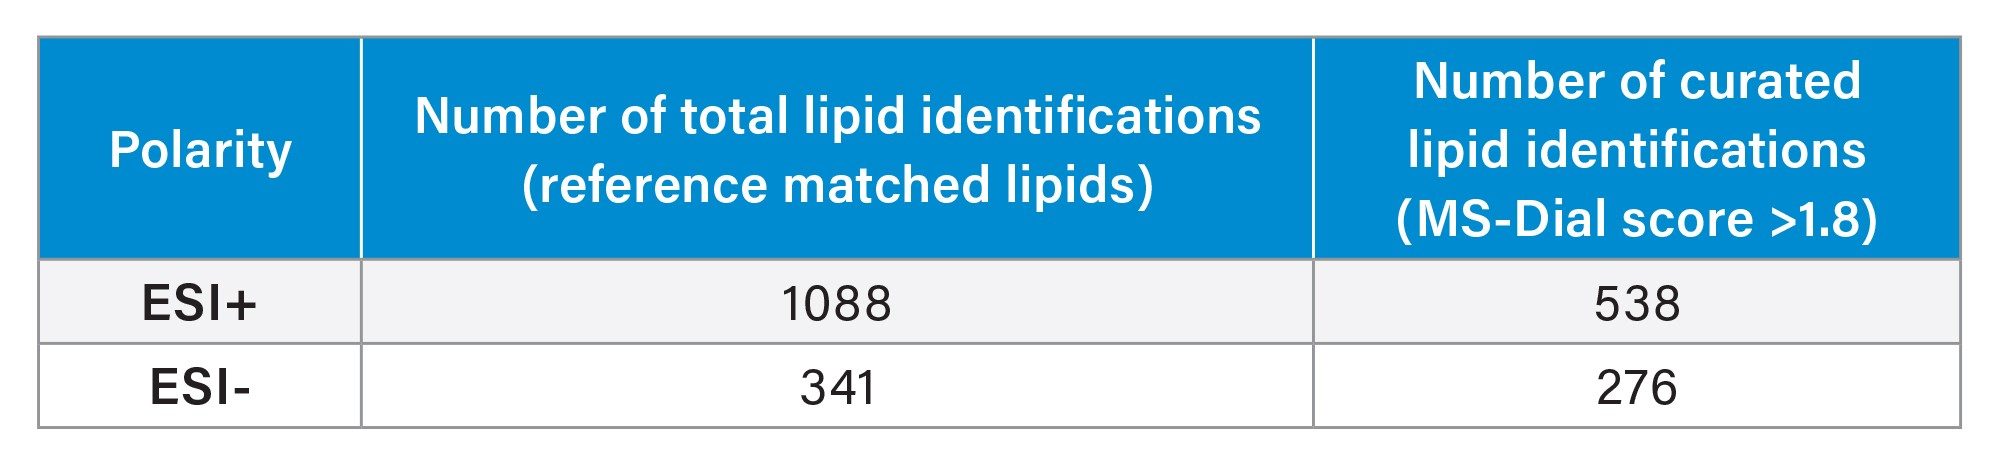
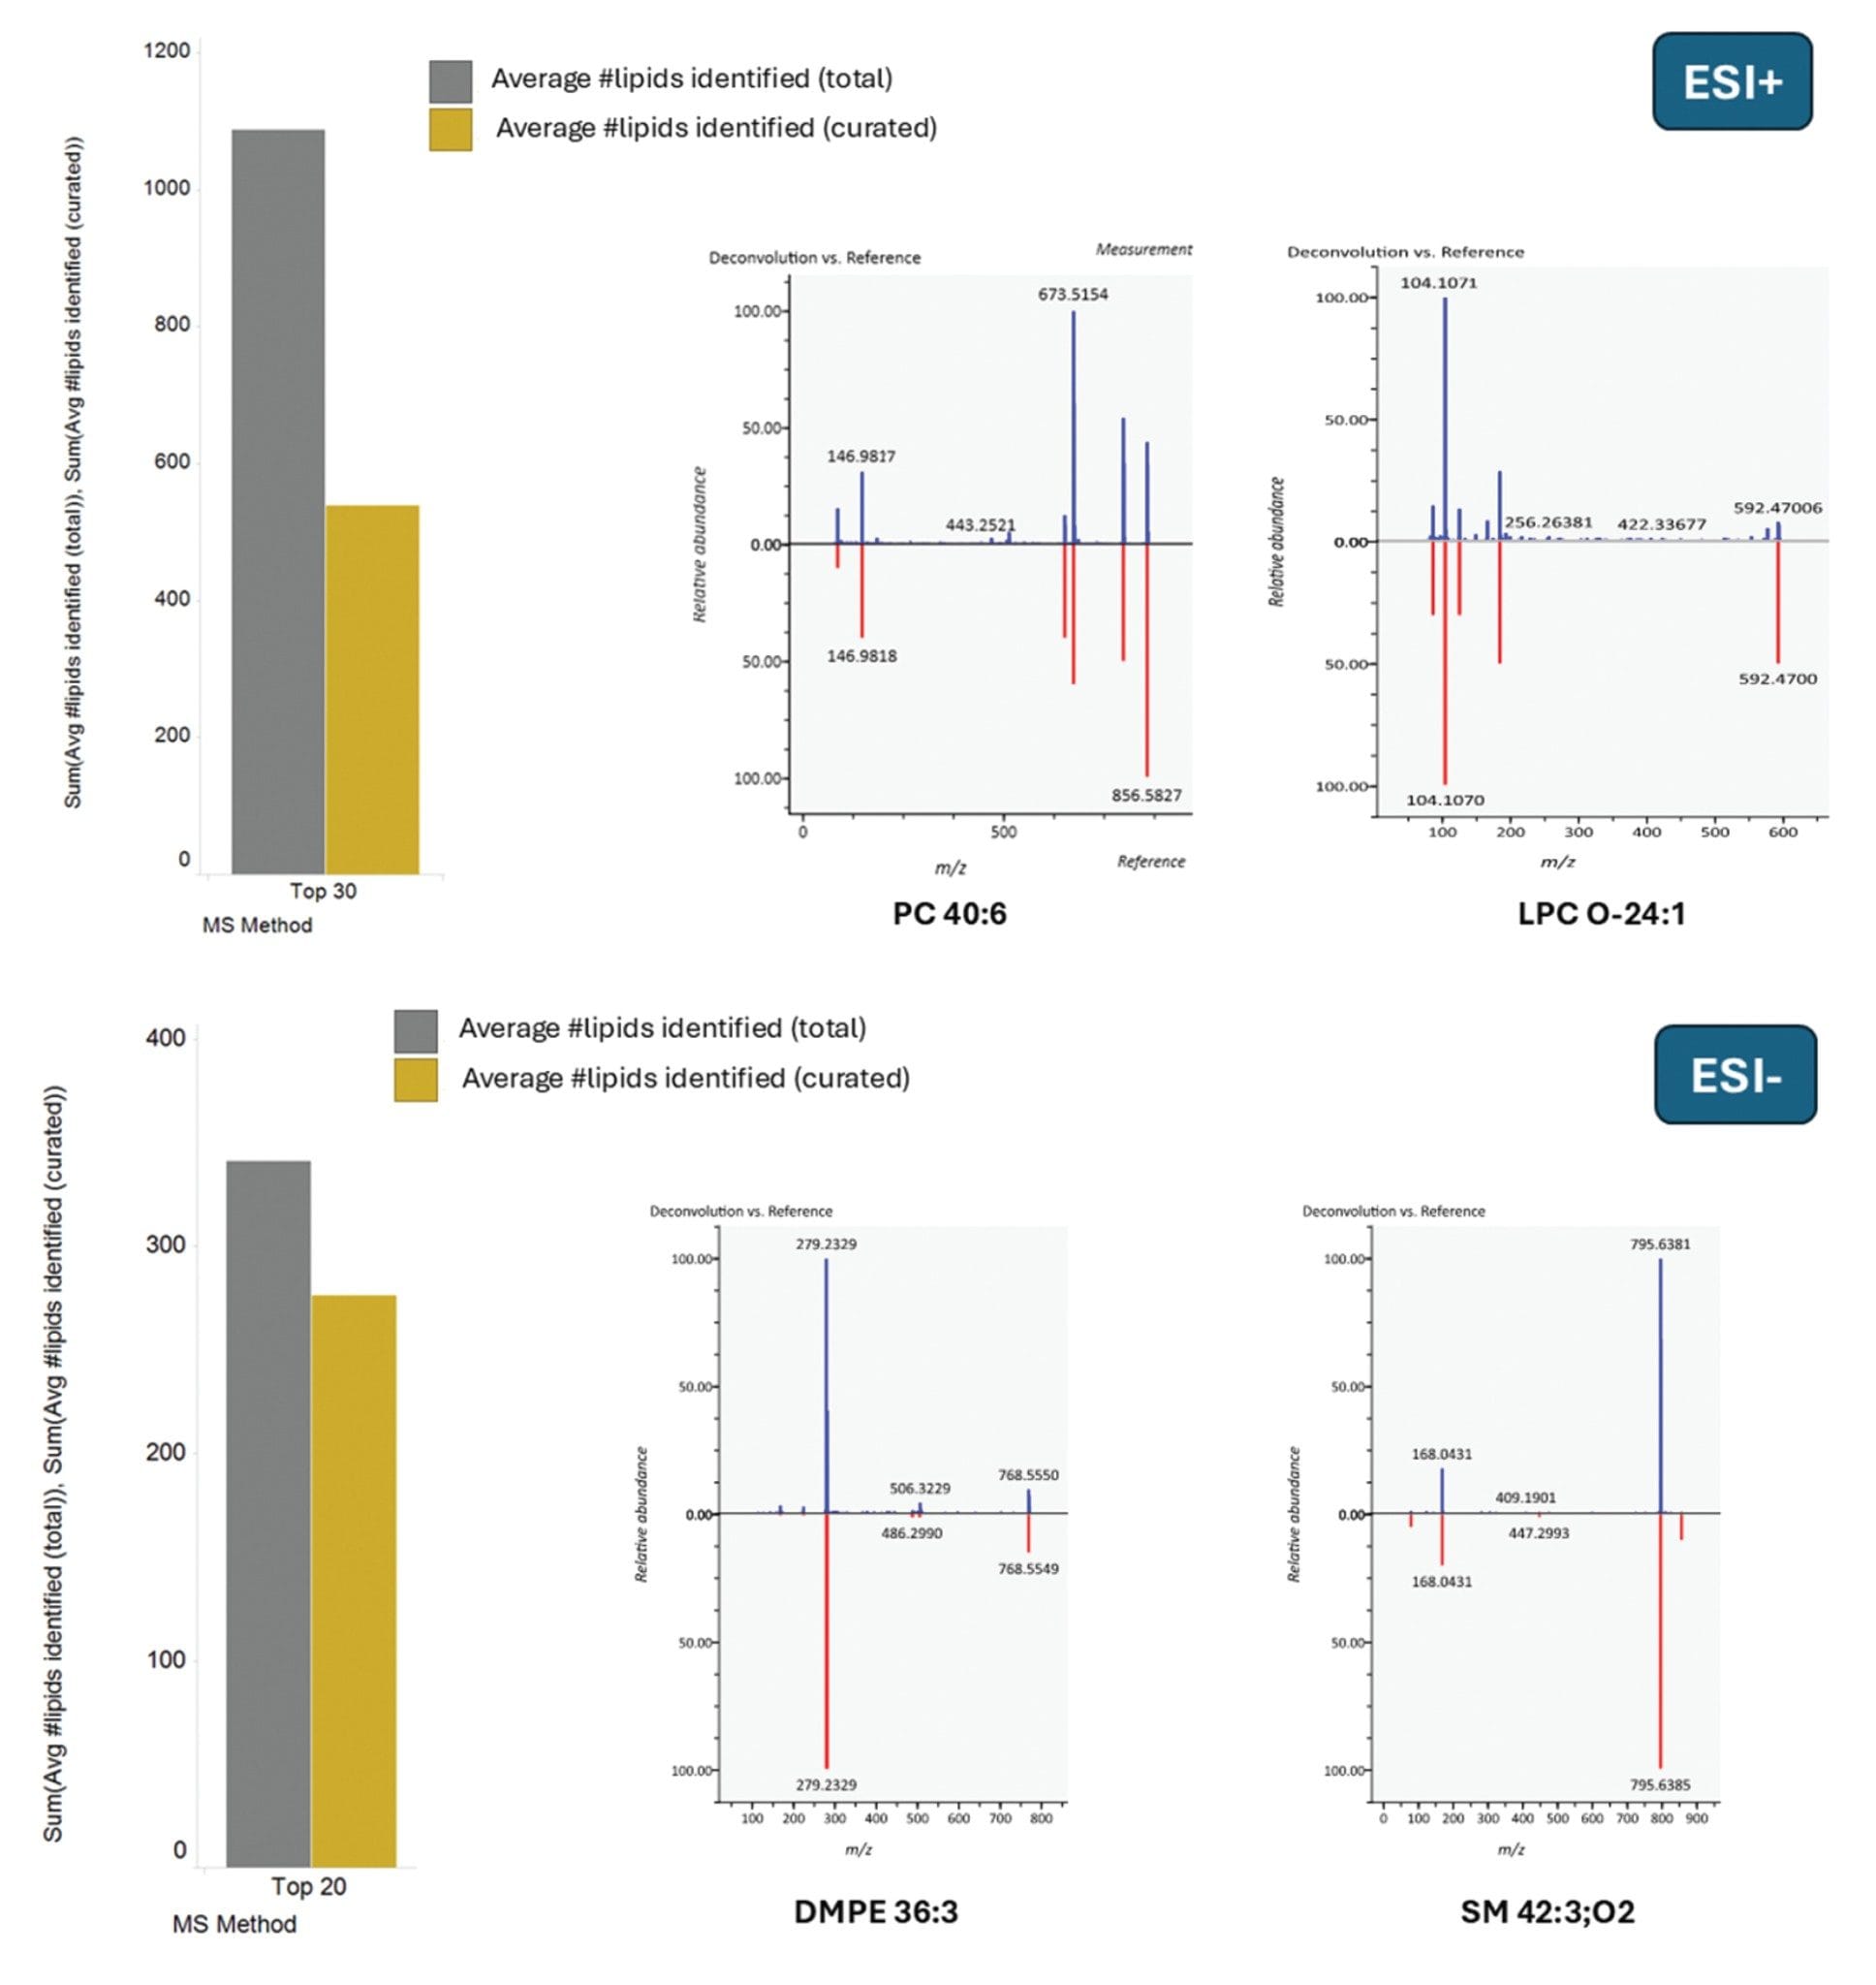
Resulting mzML files were processed and searched for compound identifications using MS-Dial. The resulting MS/MS spectra were clean and provided a high level of fragment ion coverage, aiding with confident identification, which was further reinforced with the high mass accuracy provided for MS and MS/MS. Mass errors of 1 ppm or less were typically provided for the fragment ions in the MS/MS spectra of Figure 3. A summary of the number of lipids identified based on the Top 30 (ESI+) and Top 20 (ESI-) DDA methods are also provided in Figure 3. The total number (reference matched) lipids were 1088 and 341 for ESI+ and ESI-, respectively. Curation of the data using an identification score of >1.8 (based on MS-Dial processing, identifications with scores <1.8 require further investigation to ensure no false positives are generated) resulted in 538 (ESI+) and 276 (ESI-) lipids. The MS/MS spectra highlight excellent coverage and sub 1 ppm mass accuracy for the fragment ions (Table 2).
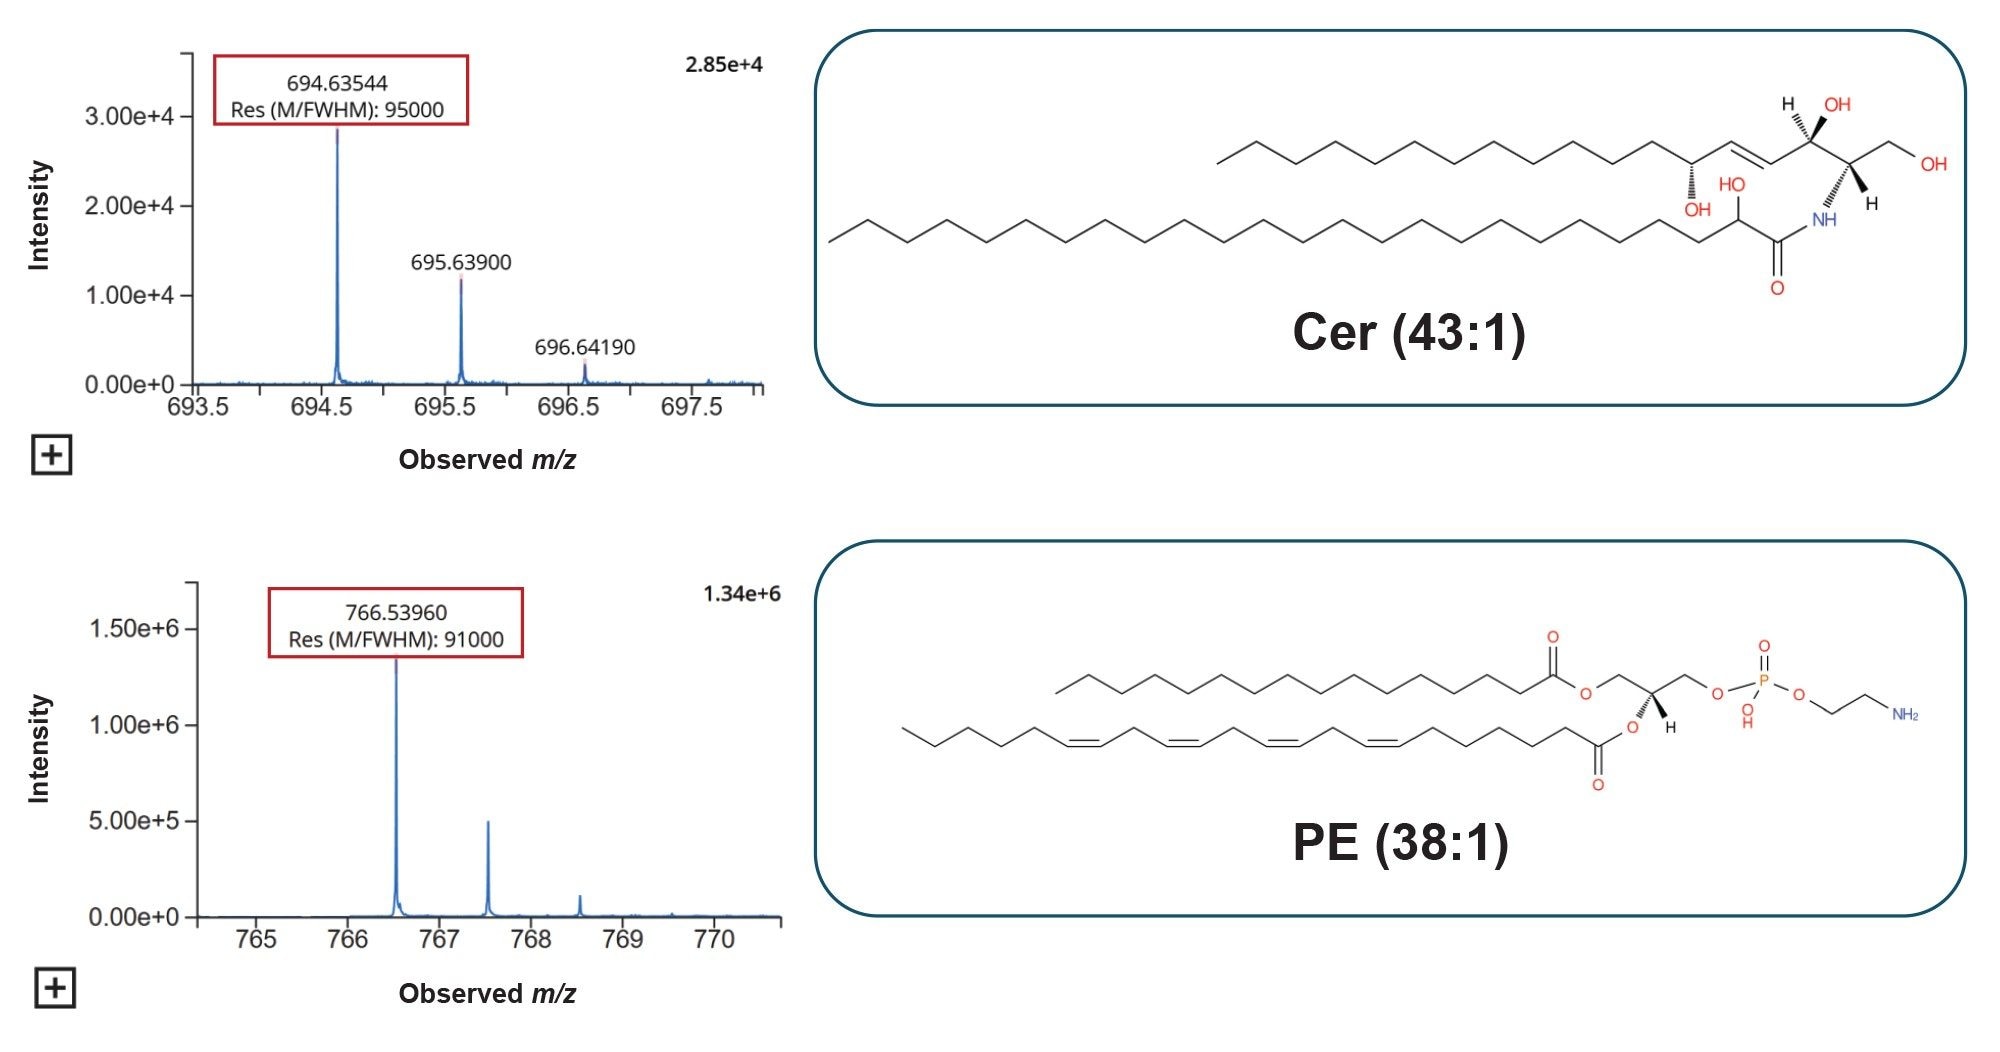
Interrogation of the raw data highlights the high quality achieved with the Xevo MRT Mass Spectrometer and signifies how this translates into comprehensive profiling of the plasma lipidome while also providing highly confident identifications. As described, the Xevo MRT Mass Spectromer is capable of providing a mass resolution of up to 100,000 FWHM. Figure 4 provides examples of lipids with their associated mass resolution. Additionally, the lipids Cer (43:1) and PE (38:4) also indicate high mass accuracy of the precursors, providing mass errors of 0.15 and 0.52 ppm, respectively.
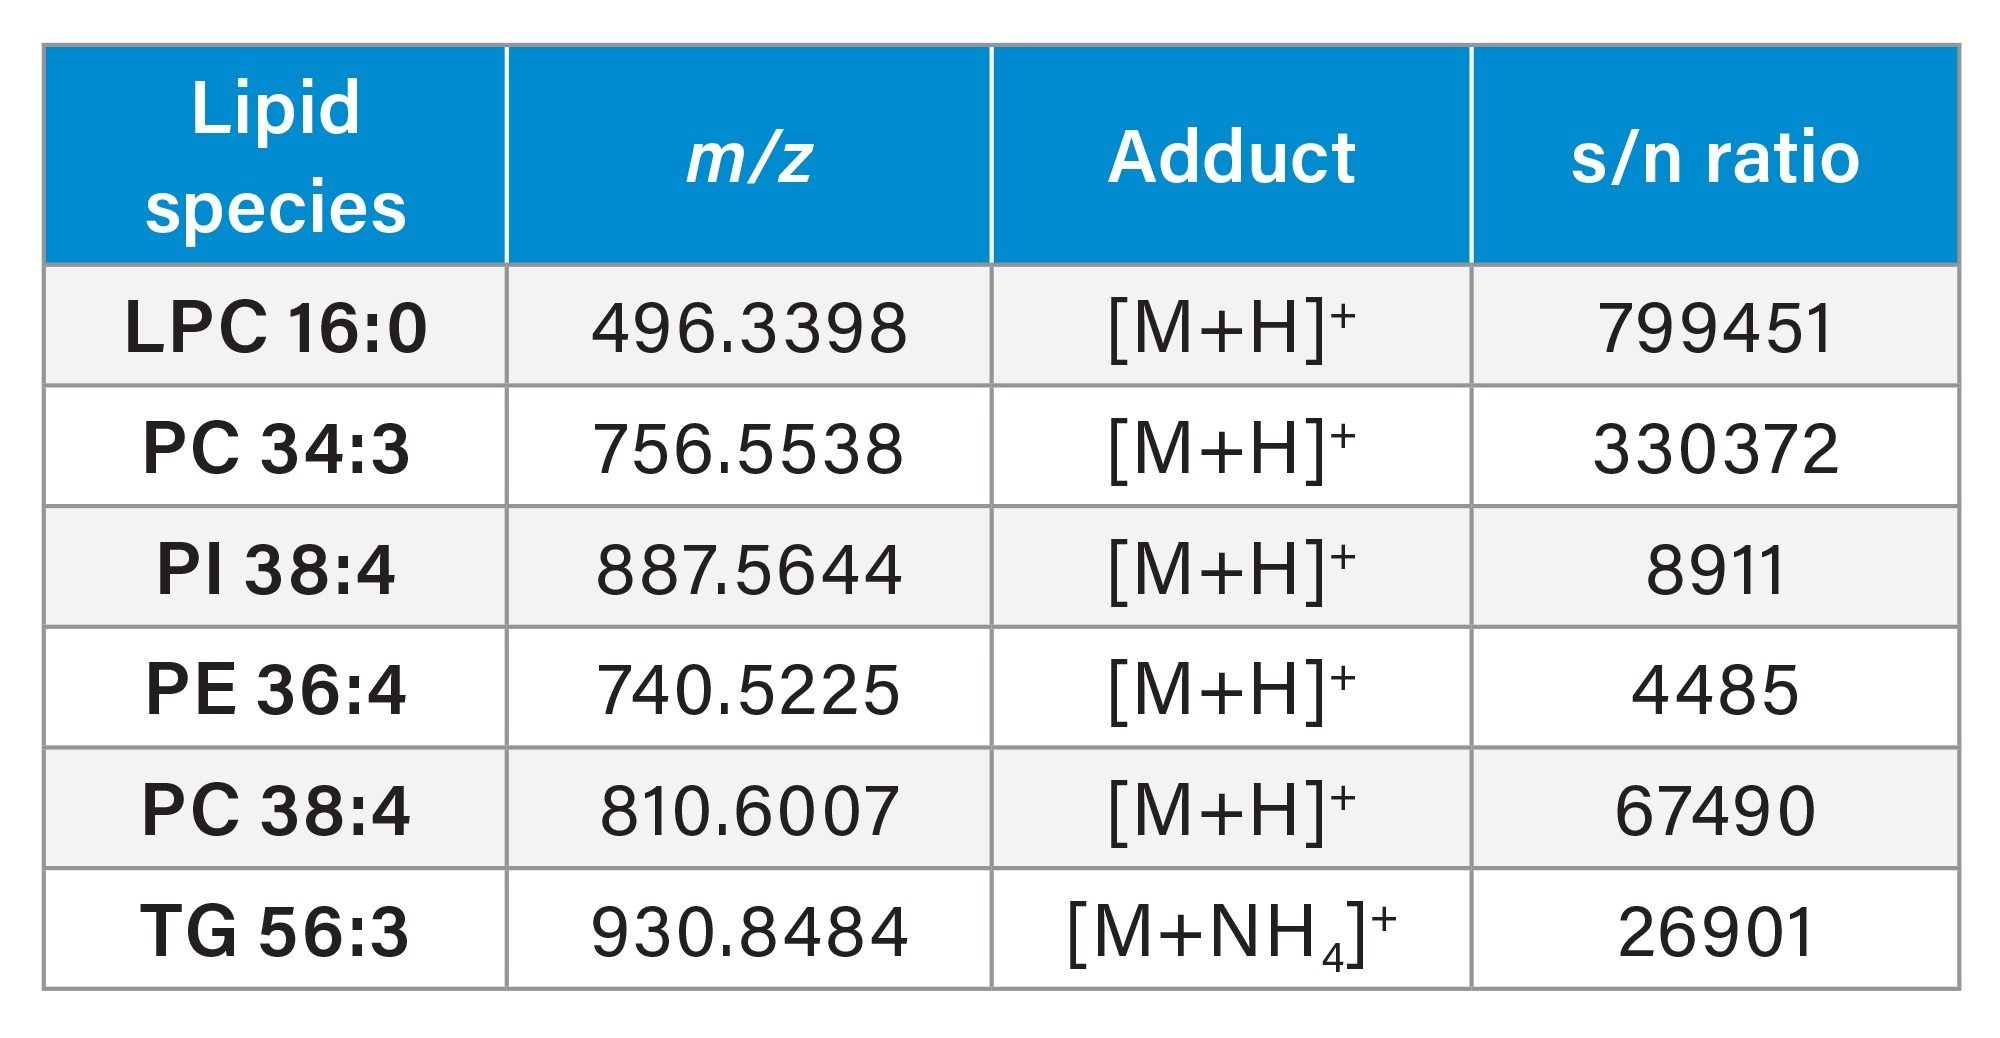
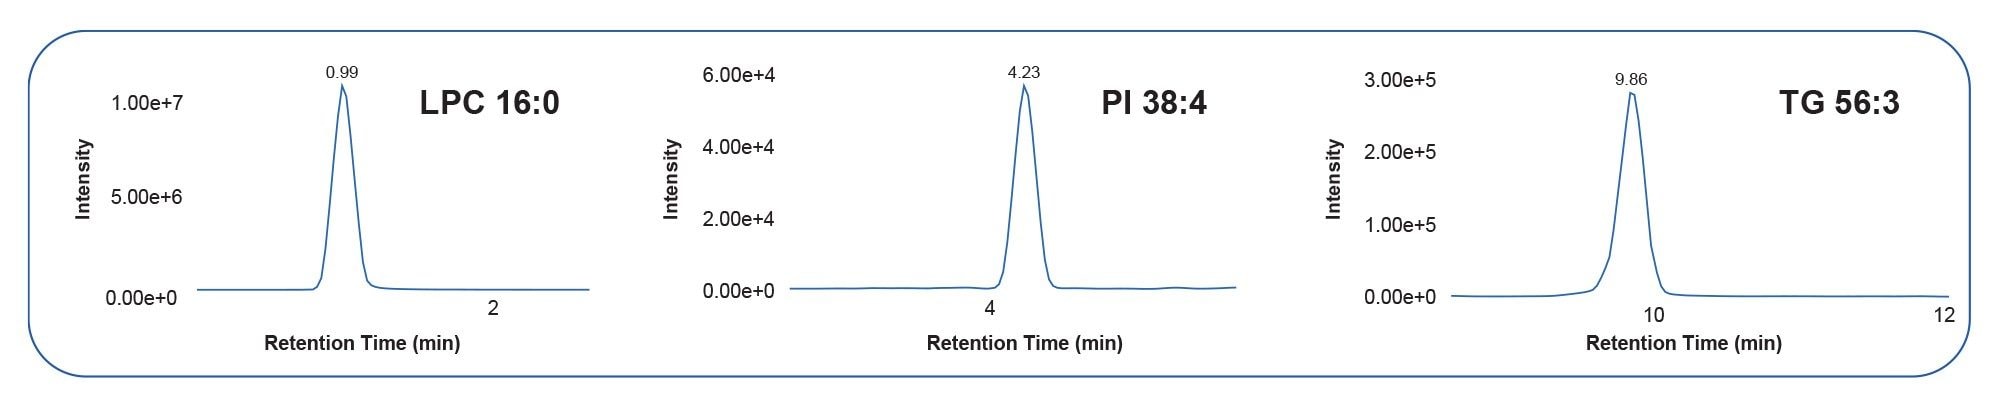
The signal to noise (s/n) ratio resulting from the DDA acquisitions allowed for clear differentiation from the background signal and therefore provided greater accuracy and detection of lipids at lower levels (Table 3). Example extracted ion chromatograms (XICs) are provided in Figure 5 to illustrate the s/n detailed in Table 3.
Conclusion
- The DDA analysis of the NIST SRM 1950 standard using the Xevo MRT Mass Spectrometer demonstrates ease of use and an integrated analytical workflow which provides comprehensive profiling of the lipidome with highly confident identifications. Briefly, a total of 1088 and 341 lipids for ESI+ and ESI- respectively, were identified using the MS-DIAL workflow.
- The high sensitivity provided by the Xevo MRT Mass Spectrometer, combined with sub 1 ppm mass accuracy, enables researchers to identify low-level species with high confidence. The identification of lipids from MS data can be challenging, with many lipid species not having suitable authentic standards to measure against. Hence, having the capability to measure lipids with such accuracy and precision is imperative for ensuring identification confidence.5
- Using the Data Convert Application provides a seamless workflow for integrating with third-party informatics.
References
- Bligh, E.G., Dyer, W.J. A rapid method of total lipid extraction and purification. Canadian journal of biochemistry and physiology., 1959, 37 (8), 91–17.
- Tsugawa et al. A lipidome atlas in MS-Dial 4. Nat Biotechnol., 2020, 38, 1159–63.
- Li et al. Sphingolipids and physical function in the Atherosclerosis Risk in Communities (ARIC) study. Sci Rep., 2021, 11, 1169.
- Afshinnia et al. Plasma lipidomic profiling identifies a novel complex lipid signature associated with ischemic stroke in chronic kidney disease. J. Transl Sci., 2020, 6 (6), 419.
- Kirwan et al. Quality assurance and quality control reporting in untargeted metabolic phenotyping: mQACC recommendations for analytical quality management. Metabolomics., 2022, 18, 70.
Featured Products
720009164, November 2025