LC-MS Optimization of a 10-Minute Released Glycan Method Using BioAccord™ HRMS
Yun W Alelyunasa, Michael Dalyb, Michael Topkab, Julie Wushenskya, Rui Chena, Mark Wronab
a Immerse™ Lab, Newark, DE, United States
b Waters Corporation, United States
Published on January 27, 2026
Abstract
A 10 minute chromatographic method and its optimization for the released glycan analysis using hydrophilic interaction liquid chromatography (HILIC) and BioAccord LC-MS System detection are described. This work was carried out to produce a fully optimized, fast mass spectrometry (MS)-only released glycan method suitable for routine (daily) monitoring of glycan profiles in bioreactor samples. LC gradient and MS source parameters were investigated to yield optimal and rapid detection, especially for mannose and sialic acid species. Optimization revealed that the desolvation temperature had the highest effect on signal intensity, cone voltage was mostly responsible for in-source decomposition, and the influence of capillary voltage had negligible effects.
Benefits
- Rapid 10 minute method for the released glycan analysis, with >80% analysis time reduction as compared to the traditional 55-minute method
- Optimized LC gradient conditions
- Optimized MS conditions
- Fast monitoring method based on RFMS labeled glycans
Introduction
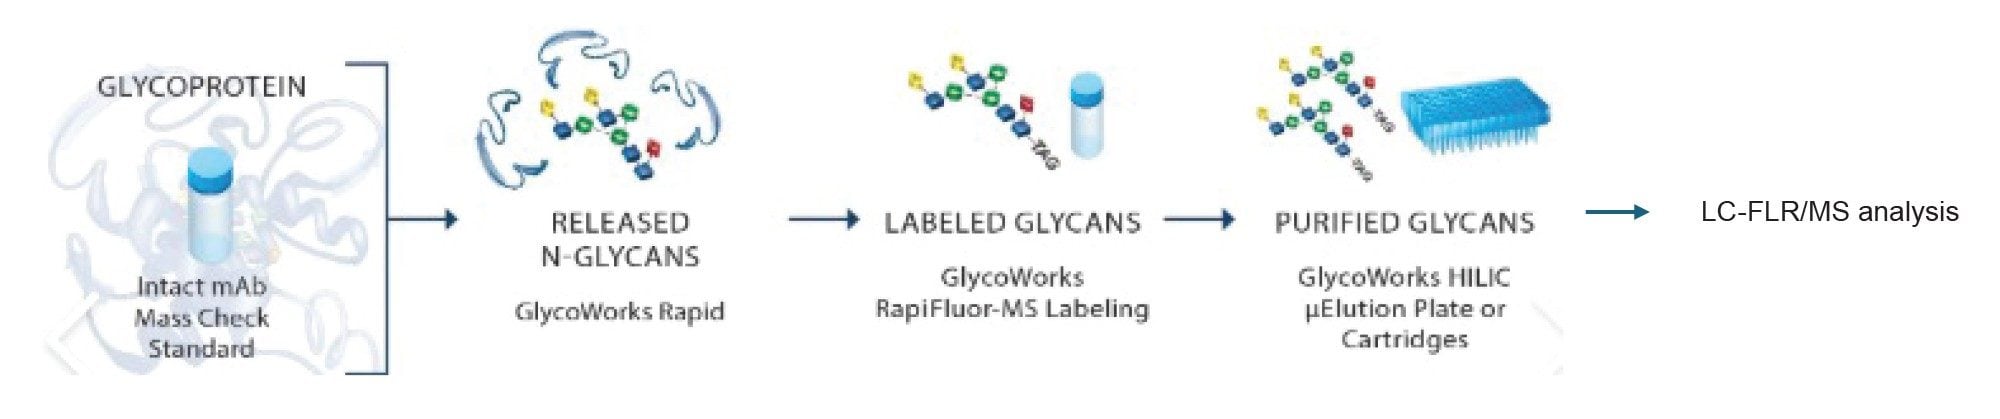
Glycosylation refers to the enzymatic attachment of sugar molecules (glycans) to proteins as a post-translational modification (PTM) during recombinant monoclonal antibody (mAb) production. Glycosylation affects the structure, stability, and biological activity of the antibody. It is one of the critical quality attributes (CQAs) in the manufacturing process. Released glycan analysis based on GlycoWorks™ Sample Preparation Kits has been the gold standard method in which glycans are enzymatically cleaved from the antibody, labeled with a RapiFluor-MS™ (RFMS) Reagent, and analyzed by HILIC with fluorescence or MS detection (Figure 1).1,2 A 55-minute chromatographic separation coupled with fluorescence detection has been widely used.3 It provides excellent baseline separation of glycans and is recommended for detailed analysis and characterization. For daily (or more frequent) sampling of parallel bioreactors, especially in development, long analytical run times are undesirable. In this case, moving to an MS-only method may be appropriate to rapidly identify changes, especially the presence of undesirable glycans, such as mannose species. Several MS-based methods with shortened run times have been published to enable faster turnaround.4 This application note describes a 10 minute chromatographic method developed on the BioAccord LC-MS Platform and specifically optimized and tuned for observing critical glycan species while maintaining fast overall run times. Methods have been thoroughly optimized and are detailed in the following sections.
Experimental
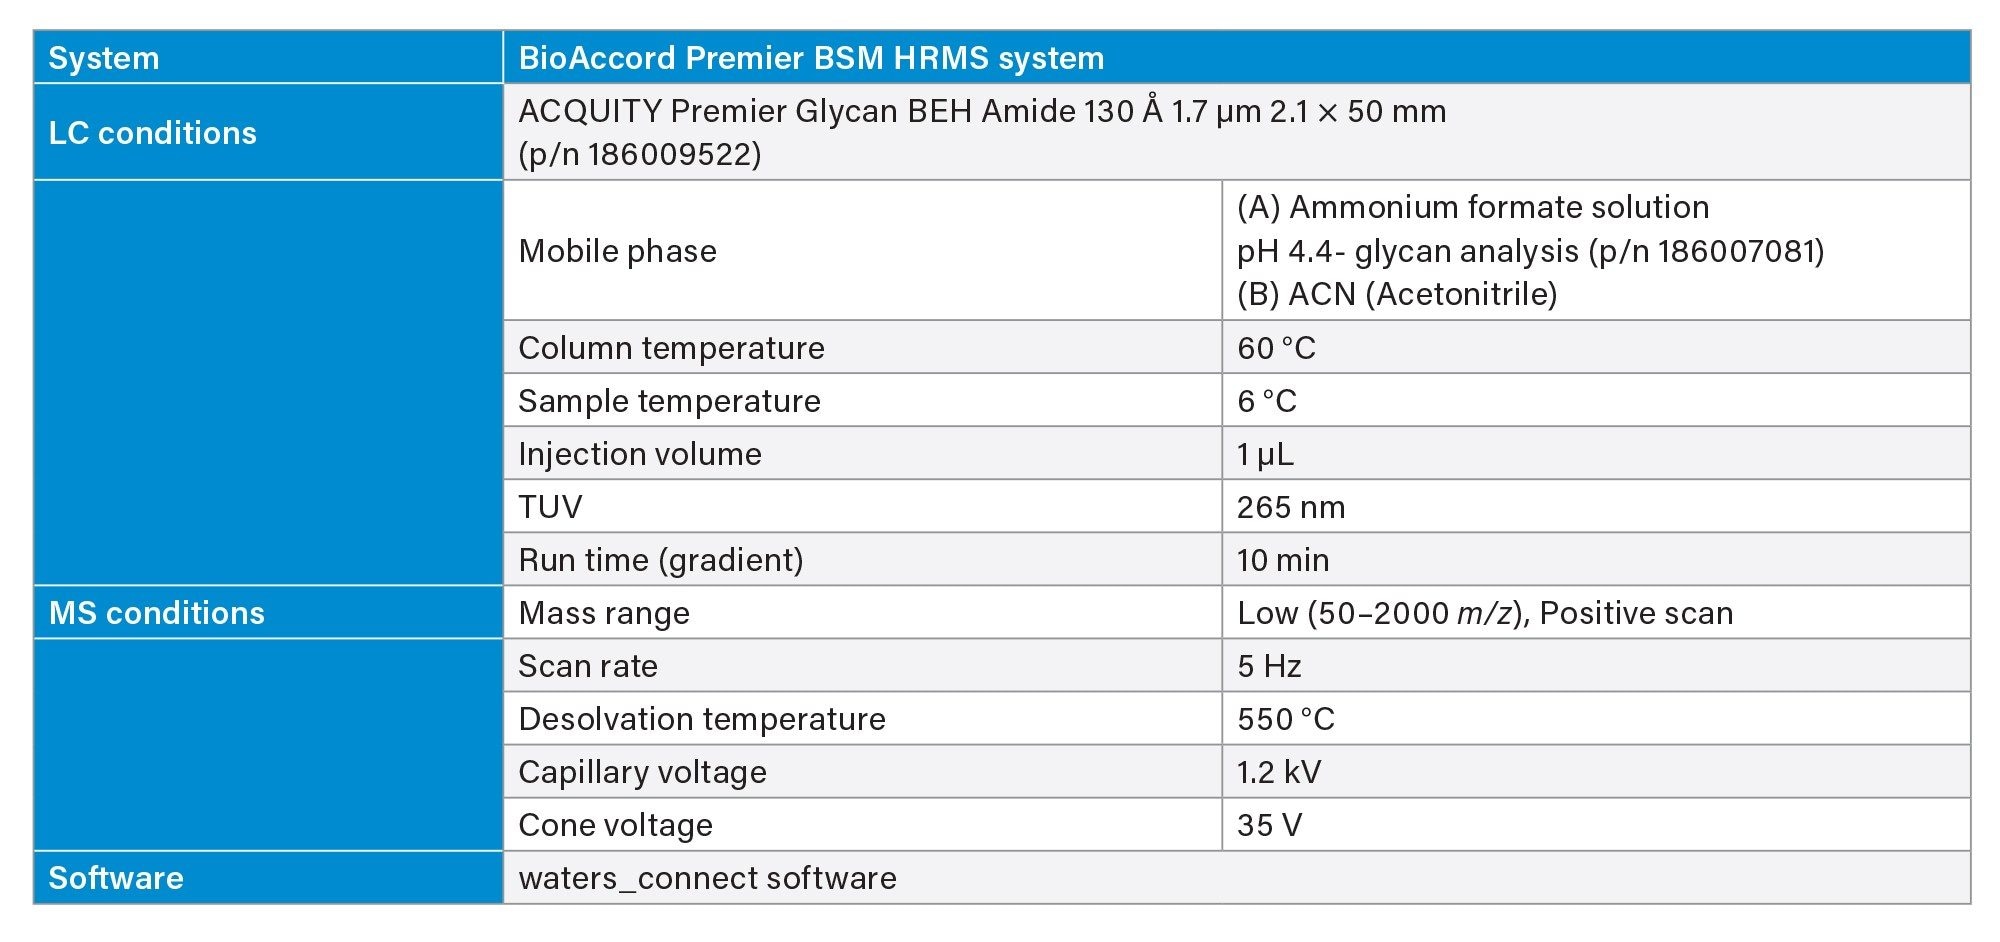
LC-MS Method Conditions
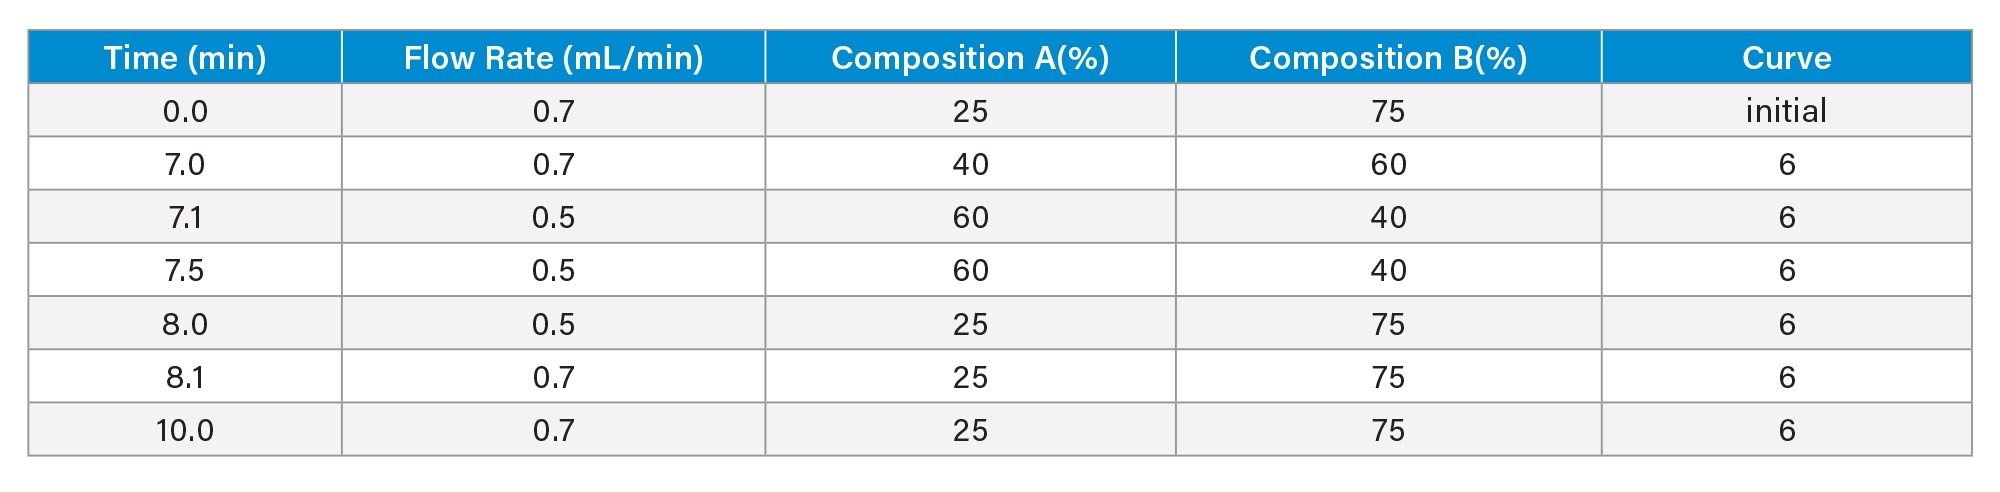
Gradient Table
Results and Discussion
I. Description of the Rapid 10 Minute Method for Released Glycan Analysis
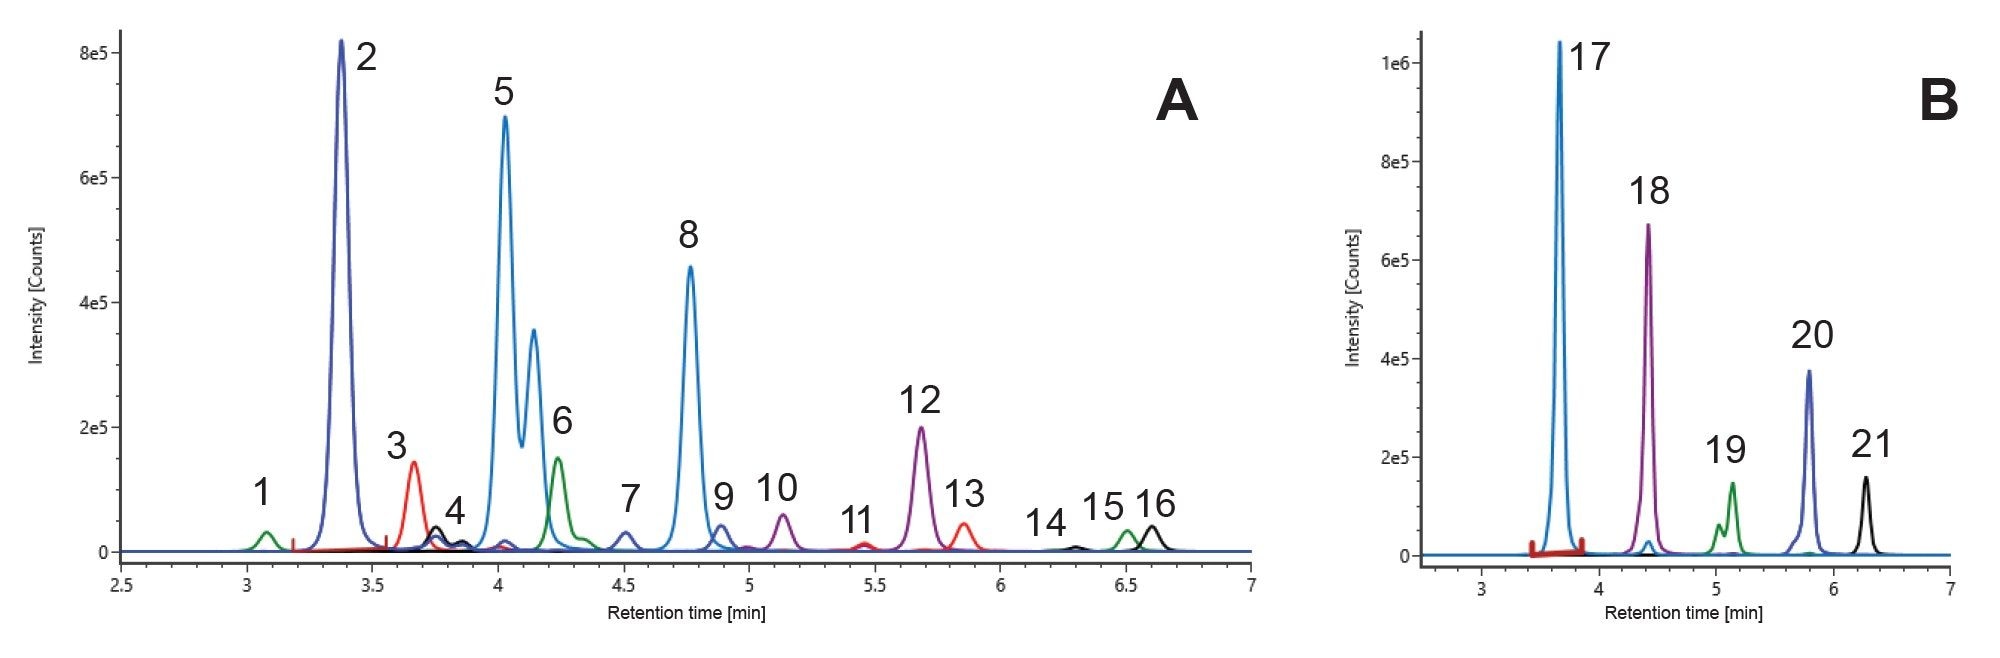
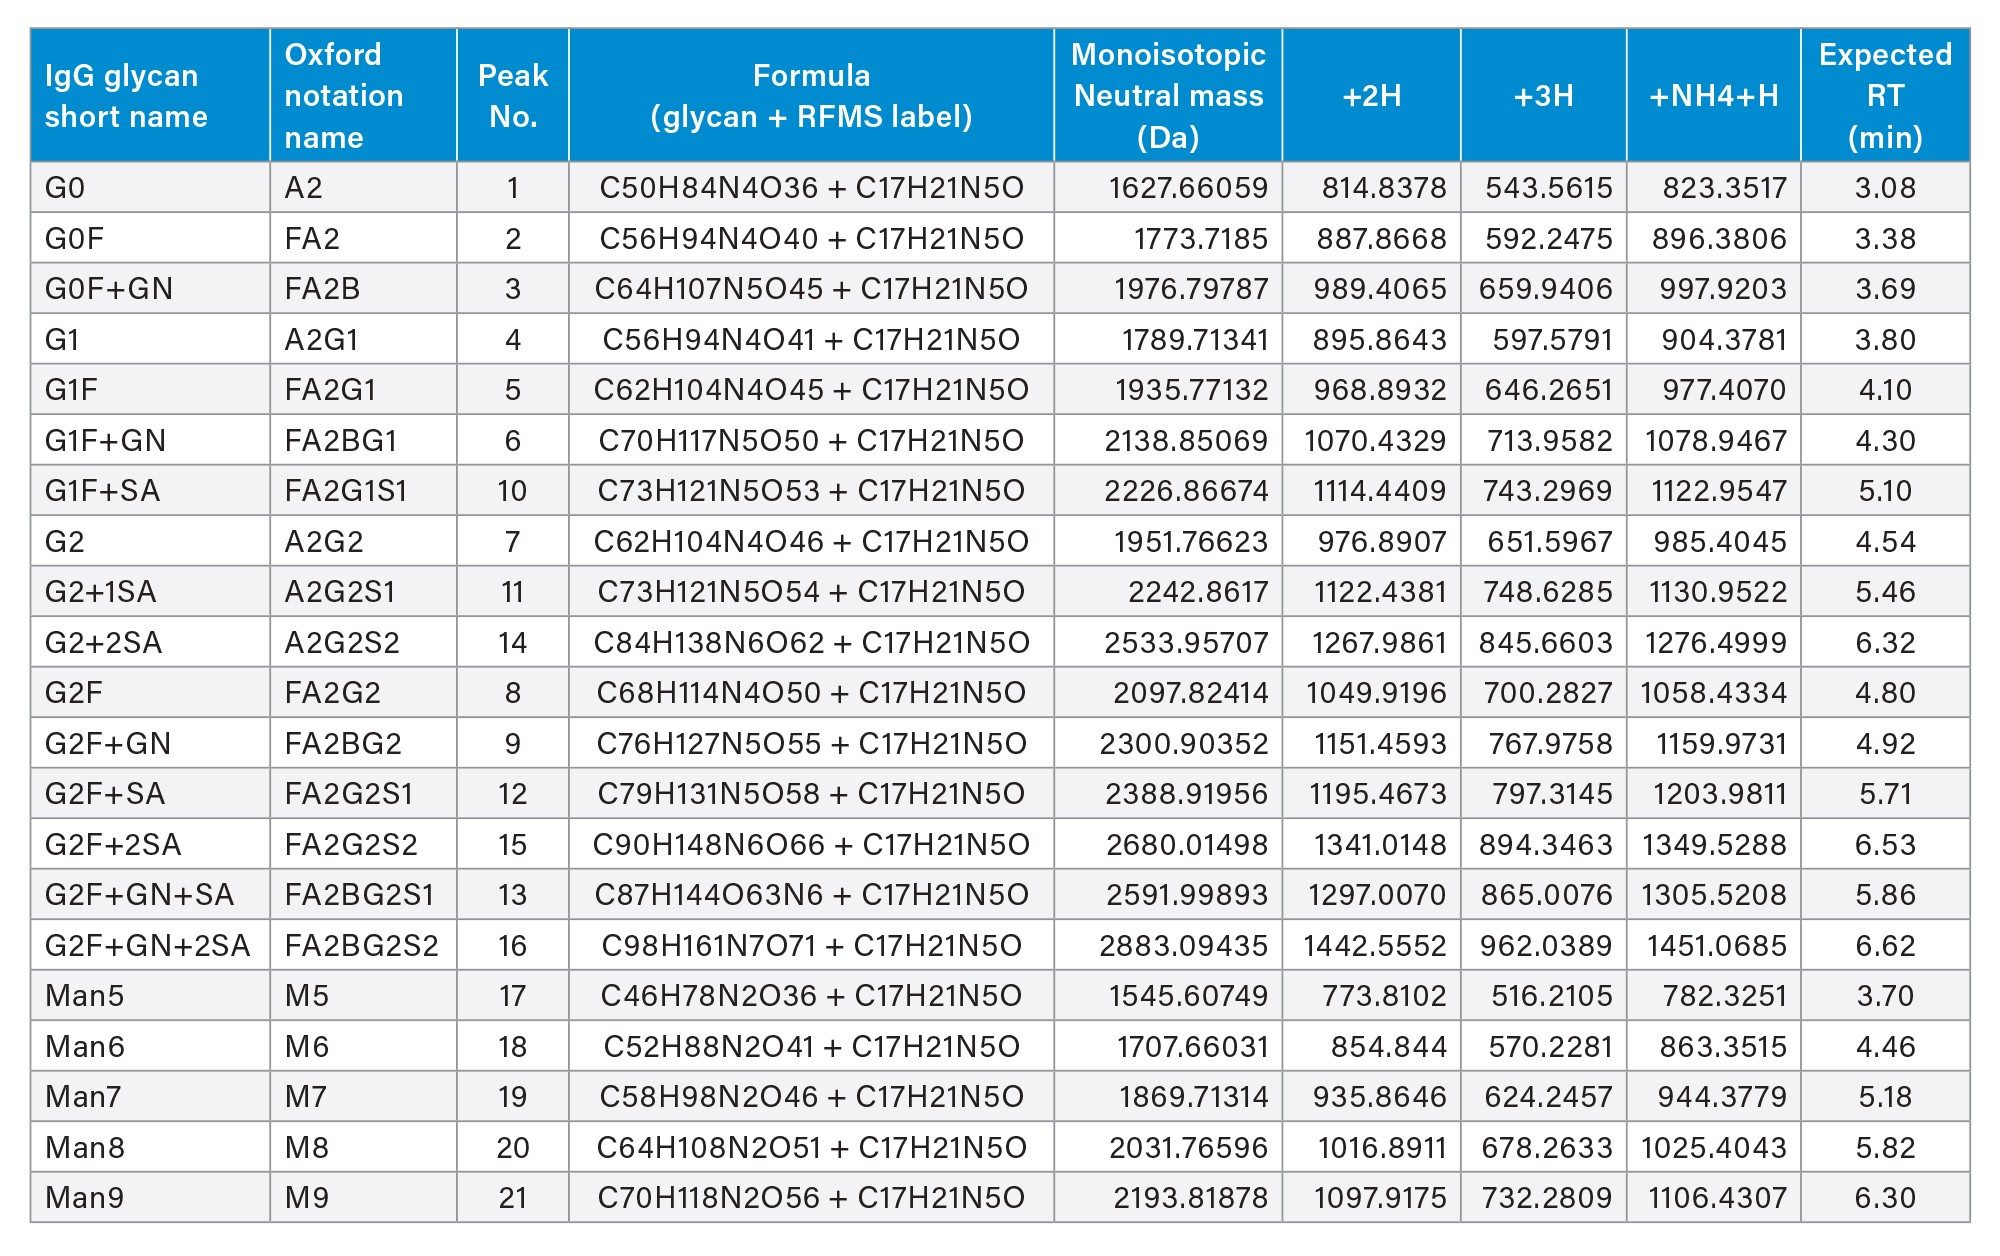
The chromatographic separation method is described for the analysis of released glycan using the BioAccord HRMS System. Glycan identification was based on accurate mass and retention time matching, providing confident putative assignments suitable for routine monitoring. The method is intended for high-throughput released glycan profiling and routine monitoring rather than detailed isomeric or structural elucidation. The extracted ion chromatogram of glycan and high-mannose standard solutions are shown in Figure 2. For isomeric glycans G1 (peak no. 4) and G1F (peak no. 5), the results are reported as merged peaks. Figure 2 shows that the majority of glycans are detected as a combination of doubly charged species, [M+2H]2+ and/or [M+NH4+H]2+. A UNIFI™ Application library was created for these glycan standards, including retention time, neutral mass, observed charge states, and structural information. Library and methods for use with the system are available upon request. A tabulation of the library entries of these standards is summarized in Table 1. Details of LC method development and source optimization are described in the following sections.
II. Optimization of LC Gradient Separation
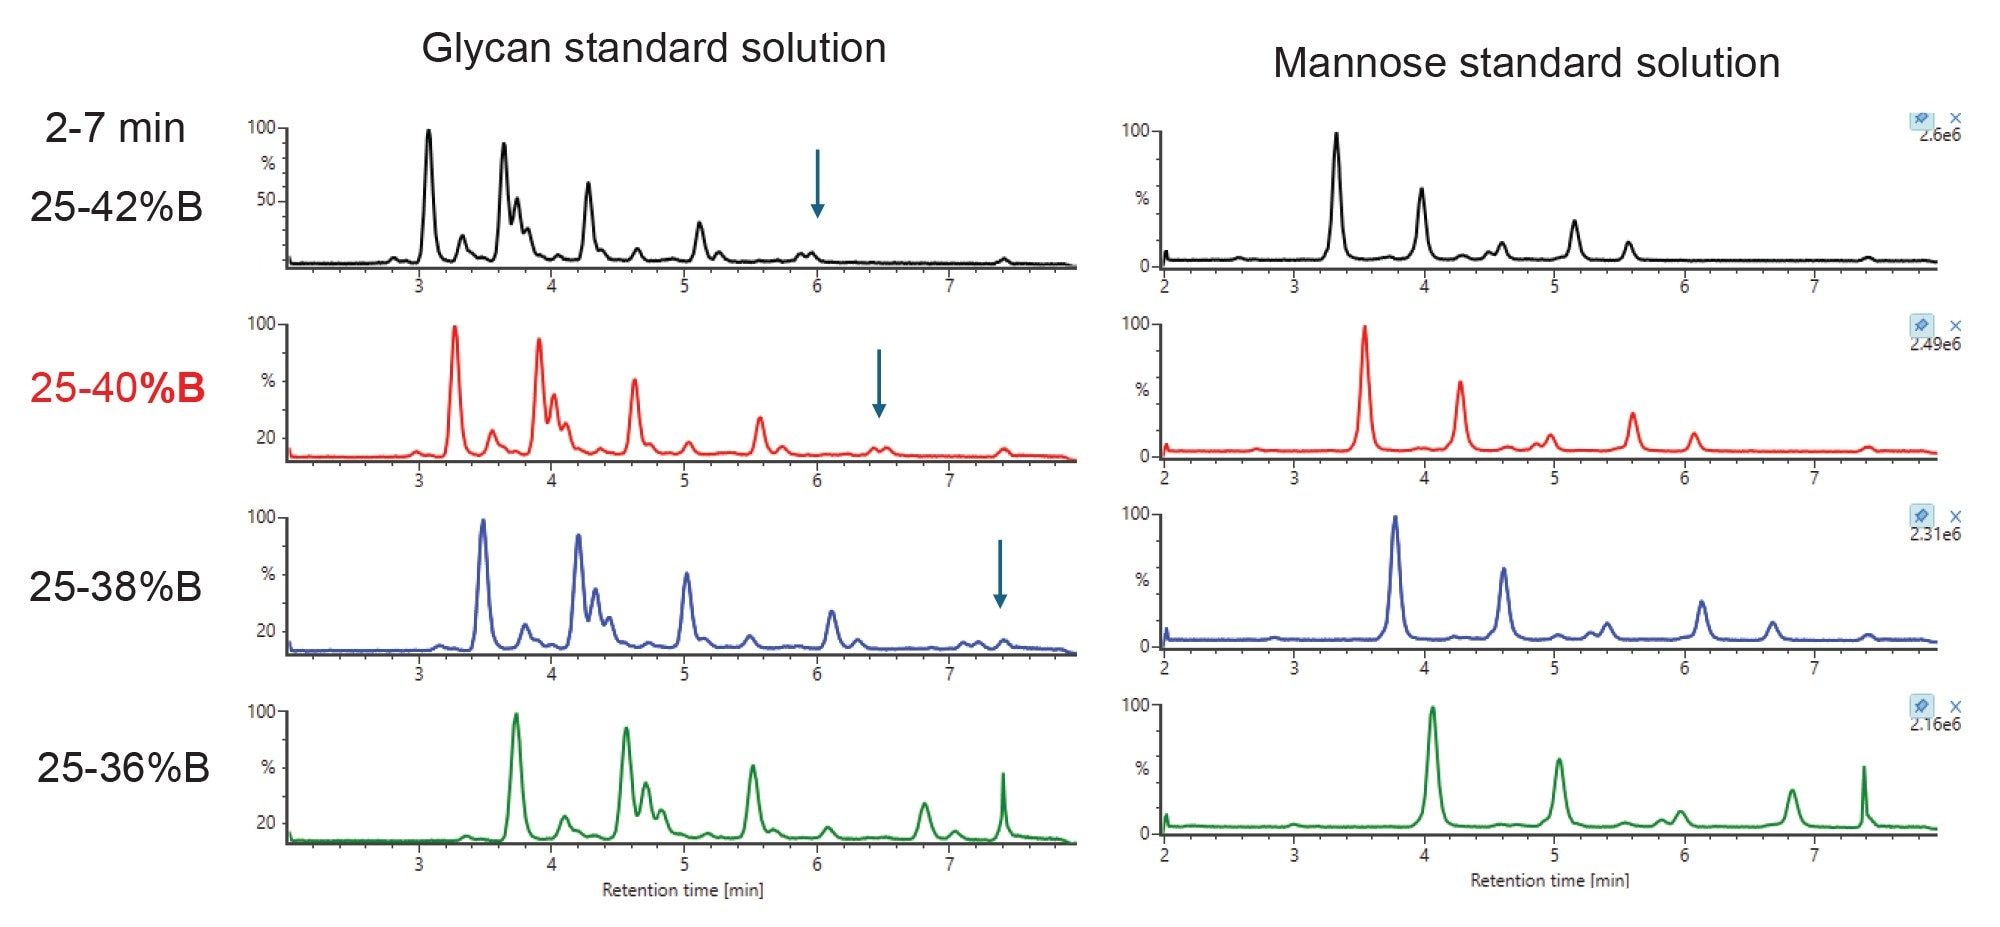
The method uses a Premier Glycan BEH Amide 130 Å 1.7 µm 2.1 x 50 mm HILIC Column. Earlier work (not shown) showed a starting gradient of 25%B was optimal. Various end gradient conditions from 42%B (faster) to 36%B (slower) were evaluated for overall quality of separation, peak shape, and glycan retention. Using initial gradient conditions of 25-42% B between 0-7 minutes, glycans eluted between 2-6 minutes. The gradient was then systematically optimized as shown in Figure 3 to ensure the last eluting glycan (marked with arrow) has proper retention. The gradient of 25-40% B between 0 and 7 minutes was selected, providing enhanced peak resolution for reliable glycan identification.
III. Optimization of MS Source Conditions
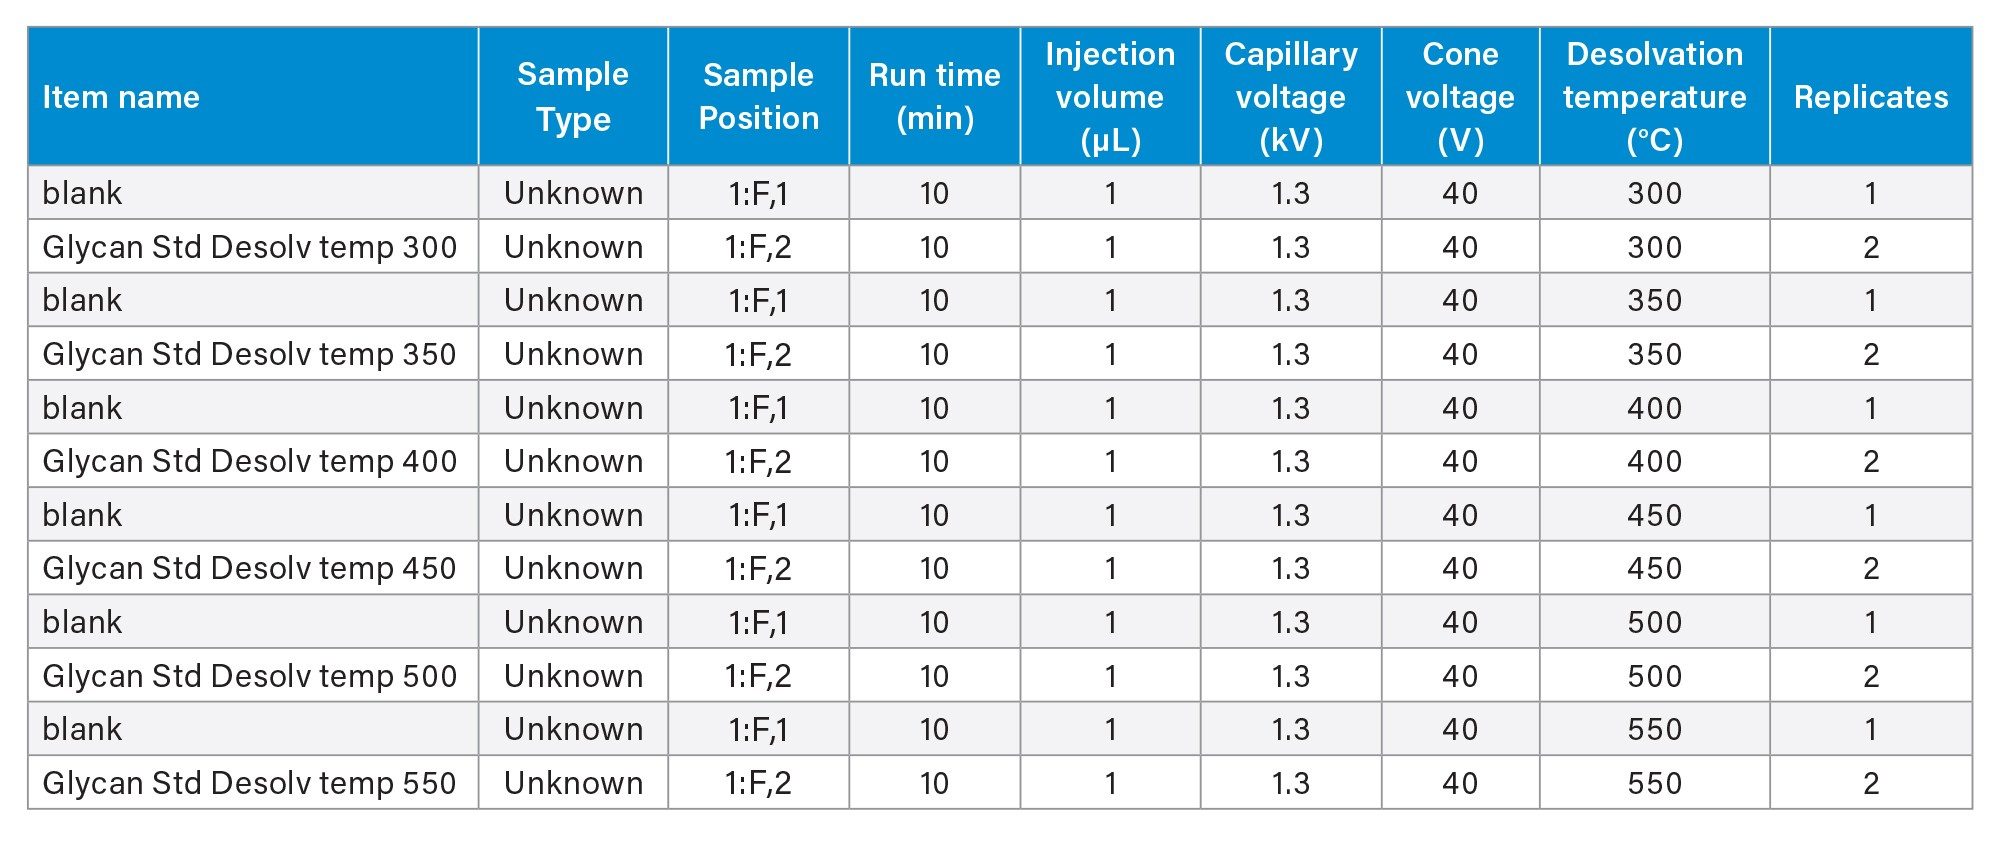
MS source conditions— desolvation temperature, cone voltage, and capillary voltage— are optimized using the glycan and mannose released glycan standard solutions. These parameters were tested using a full factorial design, varying one parameter at a time. The range of these source parameters tested are summarized in Table 2. Data were acquired in the UNIFI Application for the samples and conditions as shown in Table 3. Three source parameters are entered as promotable parameters. This allows efficient evaluation of multiple parameters without the need to create a new acquisition method for each condition.

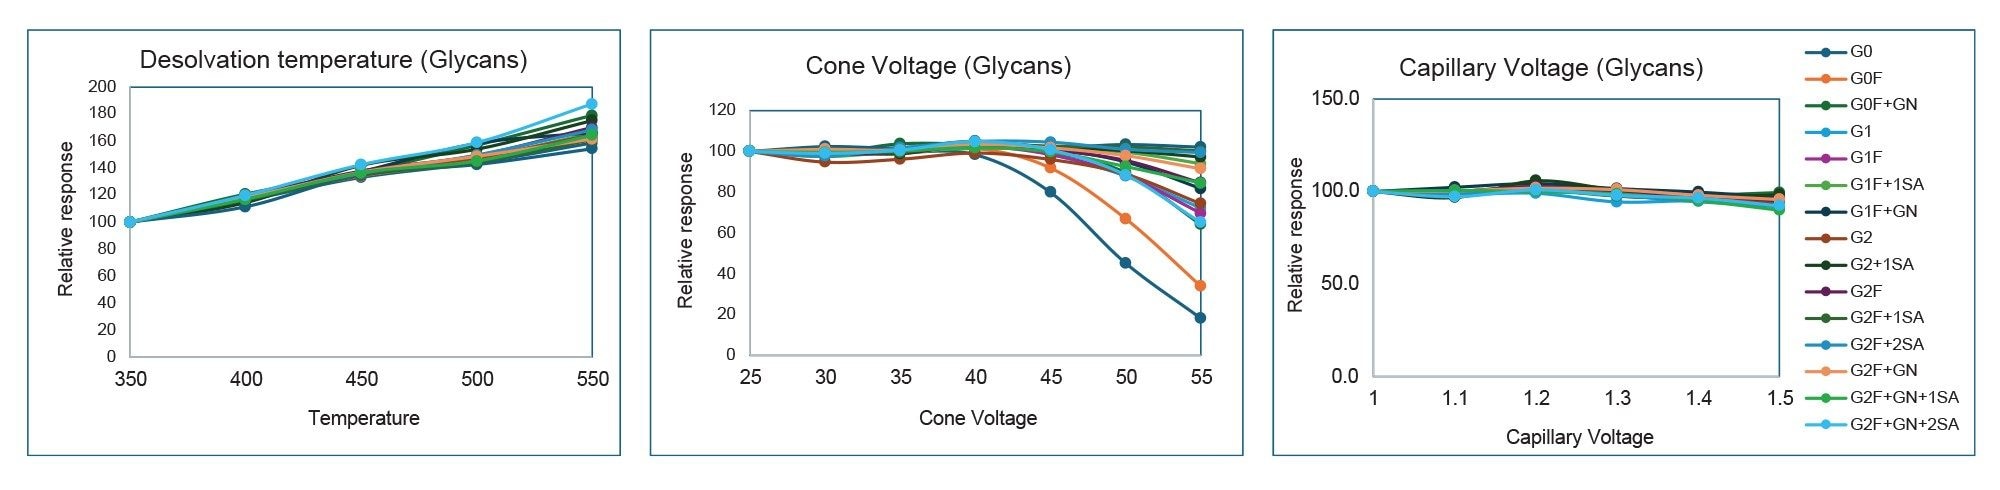
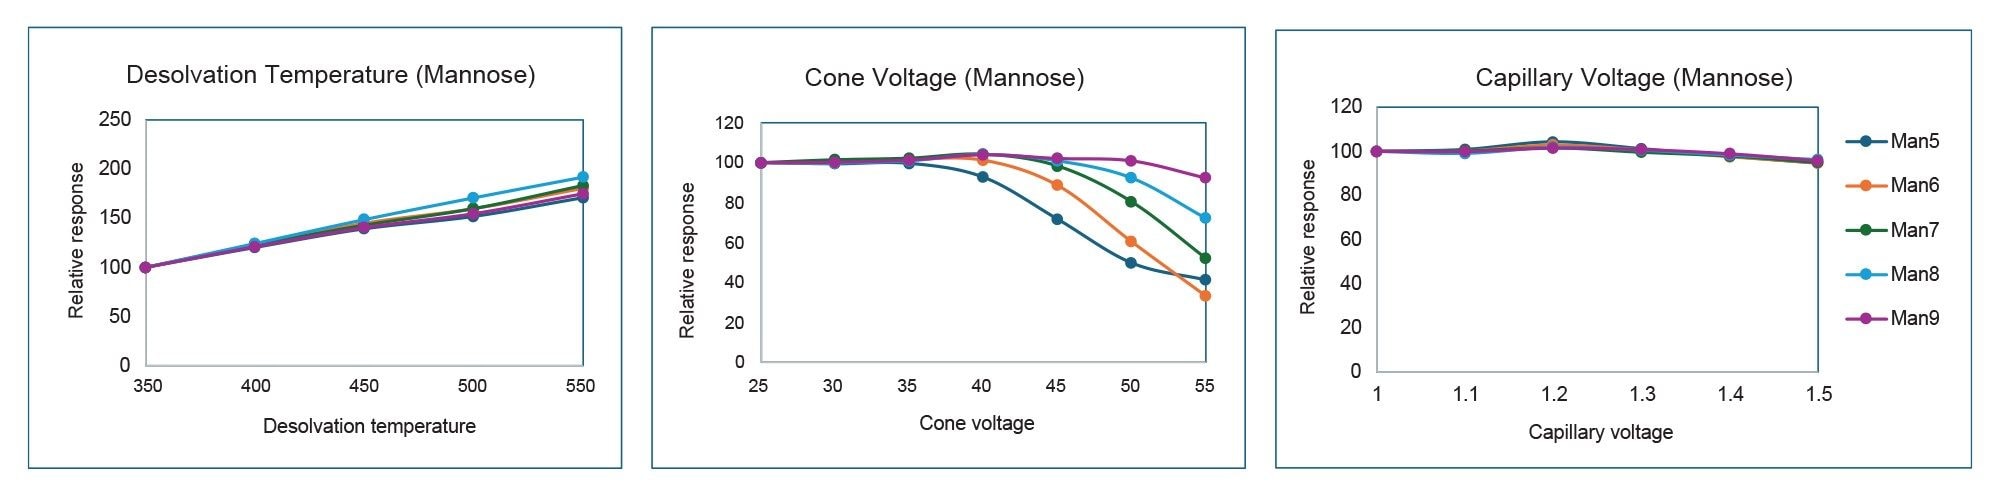
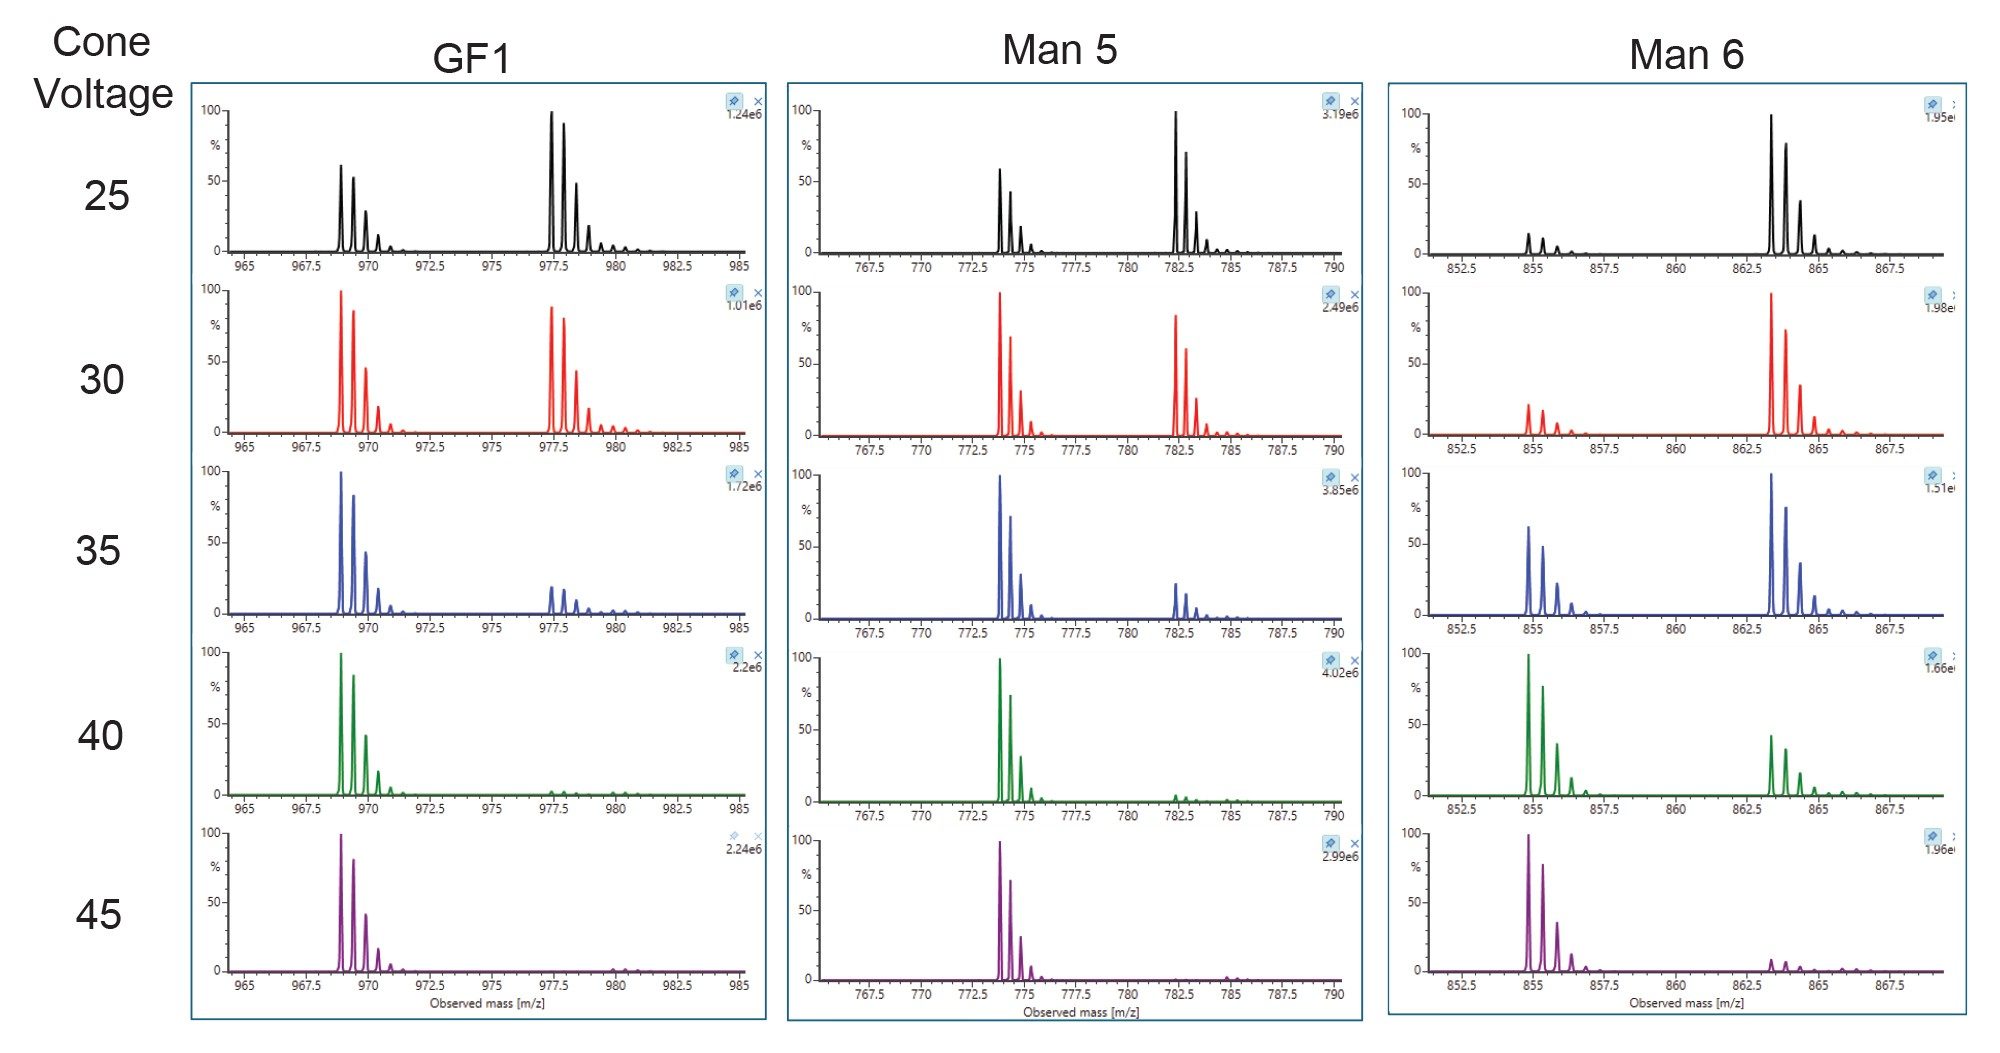
Results of the optimization are summarized and overlaid in Figure 4 for glycan standard and Figure 5 for mannose standard solution, where normalized values are plotted against each of the source parameters. The data show that desolvation temperature has the greatest effect on MS response; increasing temperature from 350 °C to 550 °C resulted in greater than 150% signal enhancement. Cone voltage resulted in in-source fragmentation and differing adduct cluster formation. As cone voltage increases, there is compound-dependent signal loss consistent with increased in-source fragmentation. Simple glycans such as Man 5 and G0 showed the biggest drop in signal. More complex glycans such as G2F+2SA and Man 9 are typically more resistant to fragmentation at higher cone voltages. In addition, increasing cone voltage led to compound-dependent ratio changes between +NH4+H and +2H adducts. An example of three glycans are shown in Figure 6. Lastly, the data showed that capillary voltage has much less effect on the observed response. Increasing capillary voltage only resulted in a slight decrease in responses. Overall, desolvation temperature of 550 °C, cone voltage of 35 V, and capillary voltage of 1.2 kV were selected as the optimized parameter for this assay.
Conclusion
A 10 minute rapid released glycan analysis is described, with highlights of the method summarized as follows:
- The 10 minute run time represents an 80% reduction in analysis time compared to the traditional 55 minute run time.
- LC chromatographic separation was optimized to maximize separation while maintaining a total analysis time of under 10 minutes.
- Careful optimization yielded significant signal enhancement for the BioAccord System compared with previously reported methods.
References
- Rapid Preparation of Released N‑Glycans for HILIC Analysis Using a Labeling Reagent that Facilitates Sensitive Fluorescence and ESI-MS Detection. M. Lauber et al. Anal. Chem. 2015, 87, 5401−5409. DOI: 10.1021/acs.analchem.5b00758.
- GlycoWorks® N-Glycan Automated Sample Prep, One-Lab library. https://onelab.andrewalliance.com/library/glycoworks-n-glycan-sample-prep-NG0vlwjW.
- Robustness of RapiFluor-MS N-Glycan Sample Preparations and Glycan BEH Amide HILIC Chromatographic Separations. Waters application note. 720005370, 2015.
- Automated High-Throughput N-Glycan Labelling and LC-MS Analysis for Protein A Purified Monoclonal Antibodies. Waters application note. 720007854, 2023.
Featured Products
720009203, January 2026