HILIC-MS/MS Analysis of Free Inositol Stereoisomers in Foods
Jinchuan Yang, Stephanie Harden, Paul Rainville
Waters Corporation, United States
Published on January 14, 2026
Abstract
Inositol is an essential nutrient for babies and for individuals with inositol deficiency caused by certain medical conditions. Maintaining a balanced profile of inositol isomers in the human body is critical for supporting key biological processes and may help reduce the risk of certain health disorders. As a result, accurate and reliable analysis of inositol stereoisomers in foods is increasingly important for applications in food quality control, nutritional research, and clinical studies.
Previously, a hydrophilic liquid chromatography–mass spectrometry (HILIC-MS) method was developed to analyze inositol stereoisomers in dietary supplements. The aim of this study was to extend the applicability of this method to more complex food matrices, such as milk, grains, and infant formulas. Alterations to the original method included the incorporation of a protein precipitation step into the sample preparation process and the replacement of the single quadrupole ACQUITY™ QDa™ II Mass Detector with the Xevo™ TQ-S cronos triple quadrupole Mass Spectrometer (MS/MS) to minimize matrix interferences.
This approach enabled accurate and reliable quantification of myo-inositol and D-chiro-inositol in complex food samples. The overall spiking recoveries in food samples ranged from 89% to 118% for myo-inositol and from 96% to 109% for D-chiro-inositol. This HILIC-MS/MS method was successfully applied to food samples and demonstrated outstanding analytical performance in terms of accuracy, precision, sensitivity, linearity, specificity, and ruggedness, making it suitable for routine analysis of free inositol stereoisomers in a range of foods.
Benefits
- A highly specific and reliable HILIC-MS/MS method for the separation and quantification of free inositol stereoisomers in dairy and plant-based milks, grains, and infant formulas
- The ACQUITY BEH™ Amide Column offered efficient separation of inositol stereoisomers and demonstrated ruggedness across different column batches
- The Xevo TQ-S cronos Mass Spectrometer delivered accurate and reliable quantification of free inositol stereoisomers in complex food matrices
Introduction
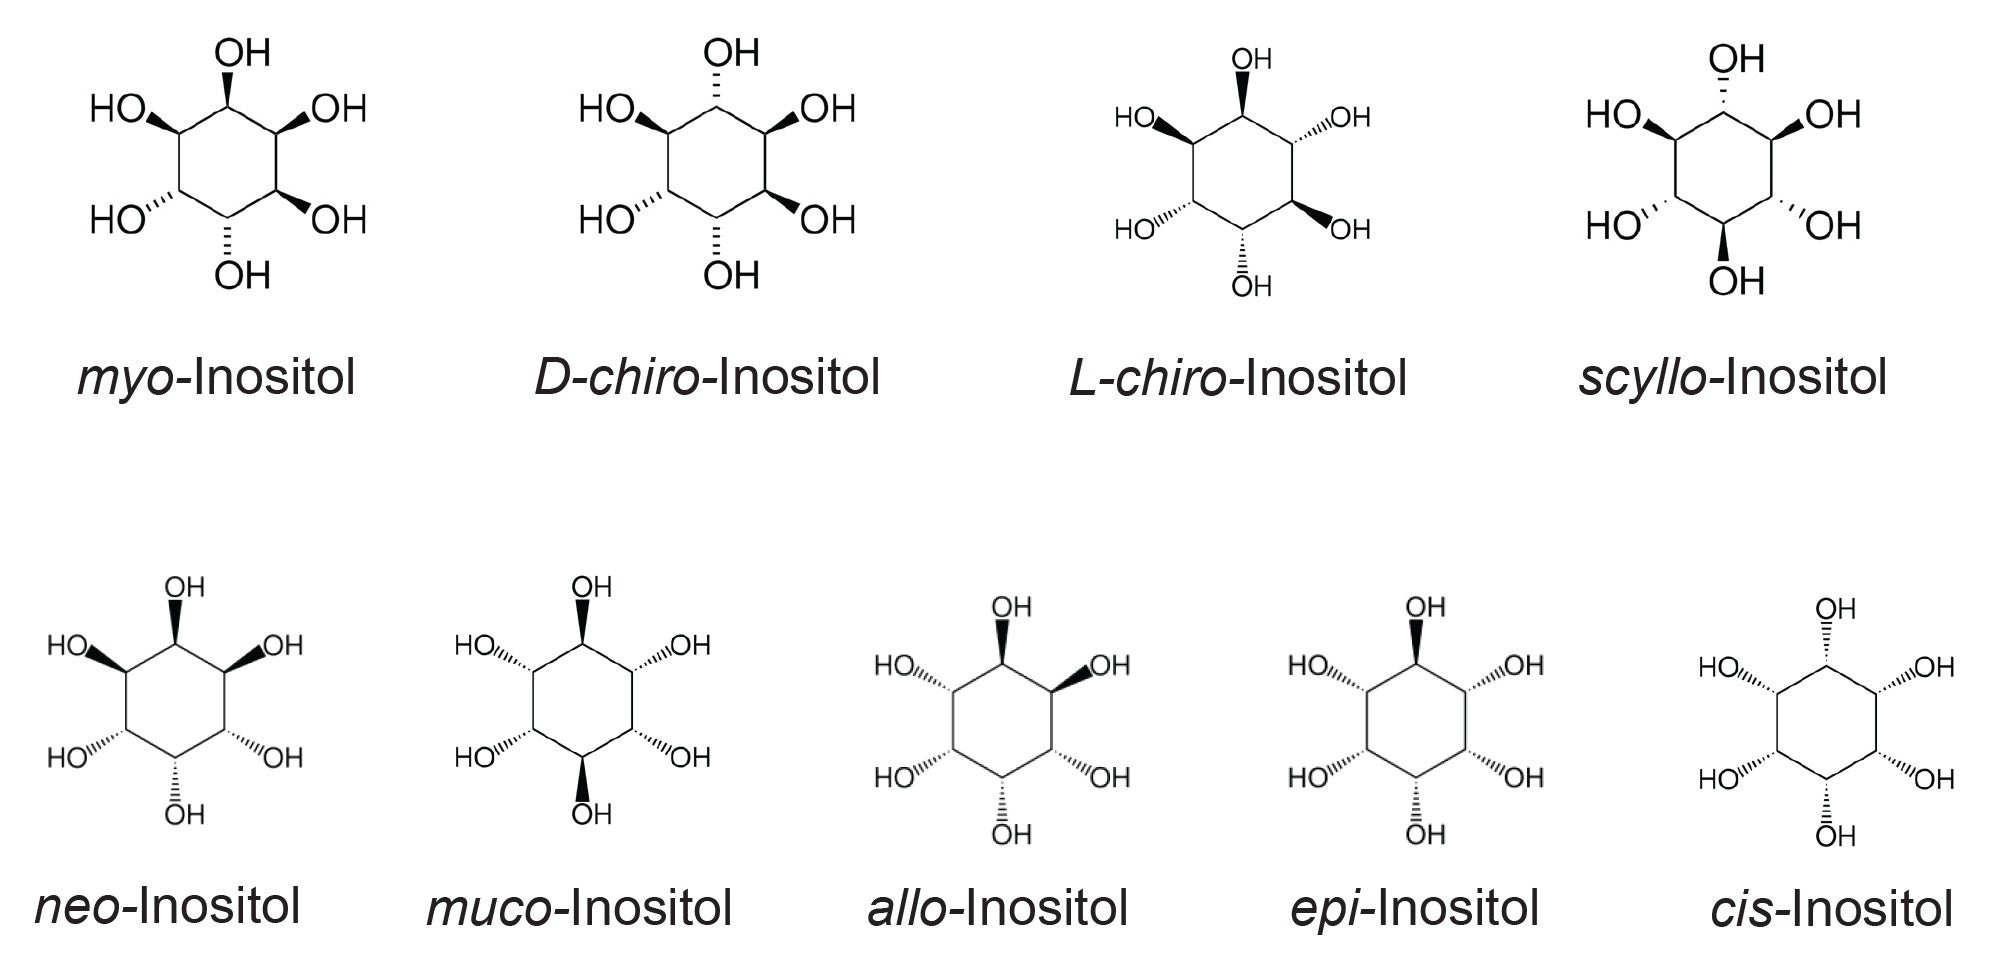
Inositols are cyclic carbohydrates with a six-carbon ring structure and six hydroxyl groups (cyclohexane-1,2,3,4,5,6-hexol). There are nine stereoisomers: myo-, D-chiro-, L-chiro-, scyllo-, neo-, muco-, allo-, epi-, and cis-inositol (Figure 1), most of which occur naturally.1-5 While the human body can synthesize inositol from glucose, it is an essential nutrient for babies and must be supplied through breast milk, inositol-enriched formula, or milk. For individuals with inositol deficiency caused by certain medical conditions, adequate dietary intake is critical to maintain normal biological functions and help prevent related health issues.6 Moreover, evidence suggests that an imbalanced profile of inositol stereoisomers in the body could contribute to certain biological dysfunctions and increase the risk of certain diseases.7 An increasing number of food products are now enriched with inositol. Developing an analytical method capable of analyzing inositol stereoisomers in foods is therefore of great interest to many fields, including food manufacturing, nutritional research, and clinical studies.
Previously, a HILIC-MS method was developed for analyzing inositol stereoisomers in dietary supplements.8 In this study, the focus was on improving the original method to make it suitable for more complex food matrices, such as dairy and plant-based milks, grains, and infant formulas. Details of the method development and validation are presented. This study focused exclusively on free inositol isomers; bound inositols were outside the scope of the work.
Experimental
Chemicals and Standards
Potassium hexacyanoferrate (II) trihydrate (K4[Fe(CN)6]·3H2O, ACS reagent) and zinc sulfate heptahydrate (ZnSO4·7H2O, ACS reagent) were obtained from Sigma-Aldrich (Milwaukee, WI). Carrez I reagent was prepared by dissolving 0.36 g of K4[Fe(CN)6]·3H2O in 10 mL water. Carrez II reagent was prepared by dissolving 0.72 g of ZnSO4·7H2O in 10 mL water. Details of additional chemicals, standards and preparation of calibration standard solutions are available in a previous Waters Application Note.8
Sample Preparation
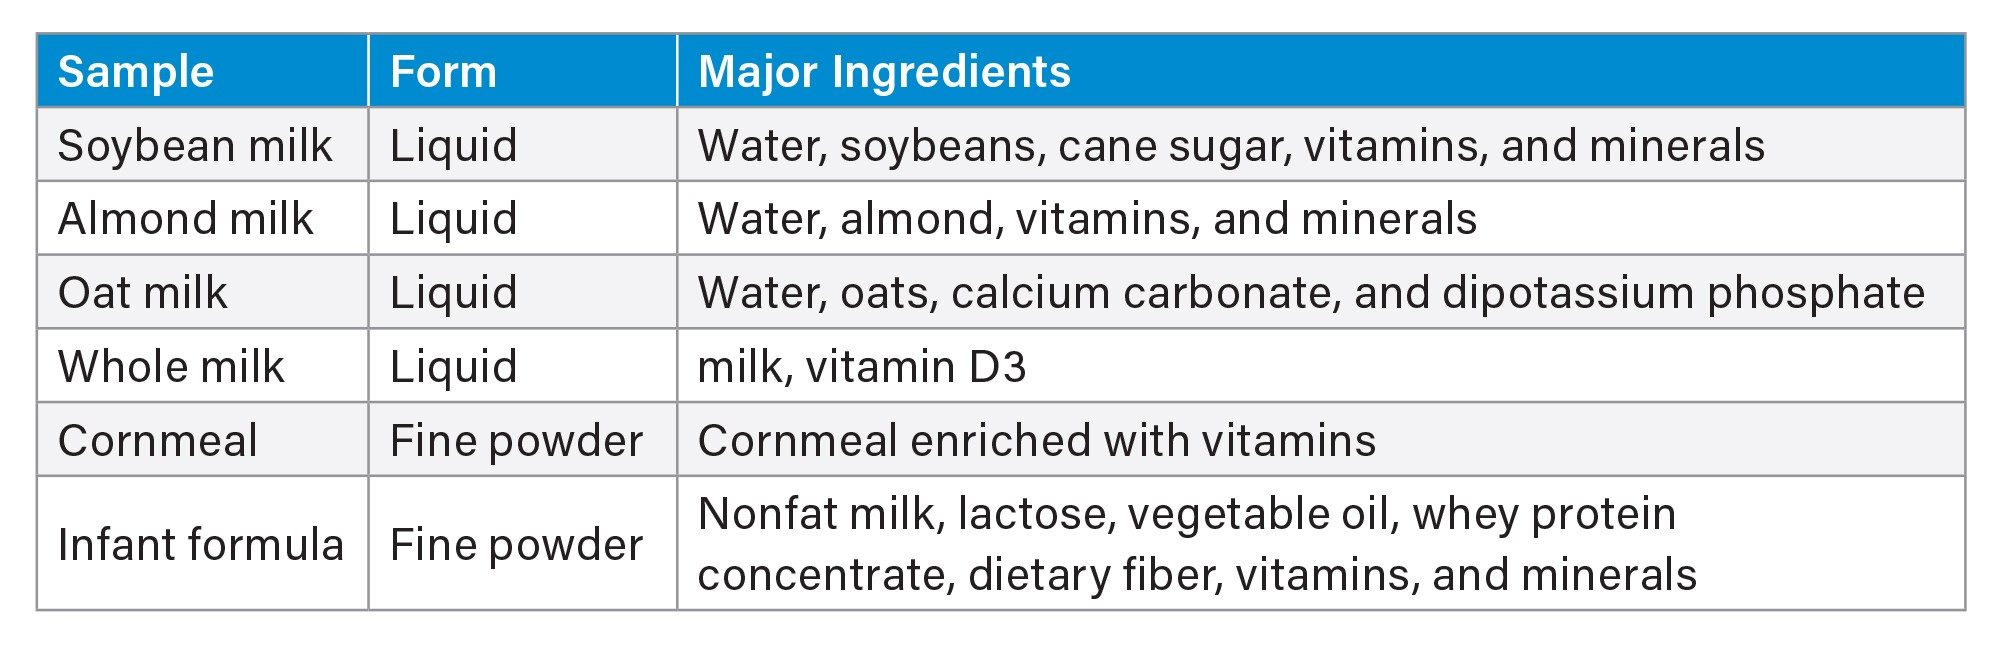
Milk (liquid), cornmeal (fine powder), and infant formula (powder) from major brands were purchased. Milk types included soybean, almond, oat, and whole milk (bovine). Table 1 presents the sample forms and their major ingredients.
Cornmeal powder was first mixed with water at 50 mg/mL and soaked overnight. Infant formula powder was mixed with water at 100 mg/mL and vortexed to obtain a homogeneous liquid mixture. Aliquots of 500 µL from the milk, cornmeal suspension, and the infant formula liquid mixture were transferred into 5 mL volumetric flasks. To each flask, 3 mL of water were added, followed by 250 µL of Carrez I and 250 µL of Carrez II reagents, with vortexing after each addition. Each flask was then brought to volume with water and allowed to stand for at least 20 minutes to ensure complete protein precipitation. The contents were quantitatively transferred to glass vials, vortexed, and aliquots of approximately 1.2 mL were pipetted into 1.5 mL centrifuge tubes, which were centrifuged at 20,000 x g for 10 minutes at 4 °C. The supernatant was filtered through a 0.45 µm PVDF syringe membrane filters (p/n: WAT200827, Waters). Final sample solutions were prepared by mixing 200 µL of the filtered supernatant, 5 µL of internal standard (ISTD) solution and 295 µL of water. Details of ISTD solution preparation are available in a previous Waters Application Note.8
Spiking Experiments
Myo-inositol and D-chiro-inositol were spiked into samples after they were transferred into volumetric flasks (see previous section) and were subsequently processed using the same procedure as un-spiked samples. Spike recovery was assessed by subtracting the native inositol concentration from the total inositol measured and comparing that against the amount of inositol that was spiked and expressed in percentage.
LC-MS/MS Instrument and Conditions
|
LC-MS/MS system: |
Arc™ Premier System equipped with a Quaternary Solvent Manager (QSM-R), a Sample Manager (FTN-R), a Column Manager, and coupled with a Xevo TQ-S cronos triple quadrupole Mass Spectrometer |
|
Software: |
MassLynx™ 4.2 MS Software |
|
Column: |
ACQUITY UPLC™ BEH Amide Column (1.7 μm, 2.1 mm x 150 mm, p/n: 186004802, Waters), or ACQUITY Premier BEH Amide VanGuard™ FIT Column (1.7 μm, 2.1 mm x 150 mm, p/n: 186009509, Waters). |
|
Column temperature: |
25 °C |
|
Run time: |
23 minutes |
|
Mobile phase A: |
ACN:water (90:10 v/v) with 0.01% NH4OH |
|
Mobile phase B: |
ACN:water (50:50 v/v) with 0.01% NH4OH and 20 mM NH4HCO3 |
|
Sample manager purge: |
ACN:water (50:50, v/v) |
|
Flow rate: |
0.35 mL/min. |
|
Injuction volume: |
2 µL |
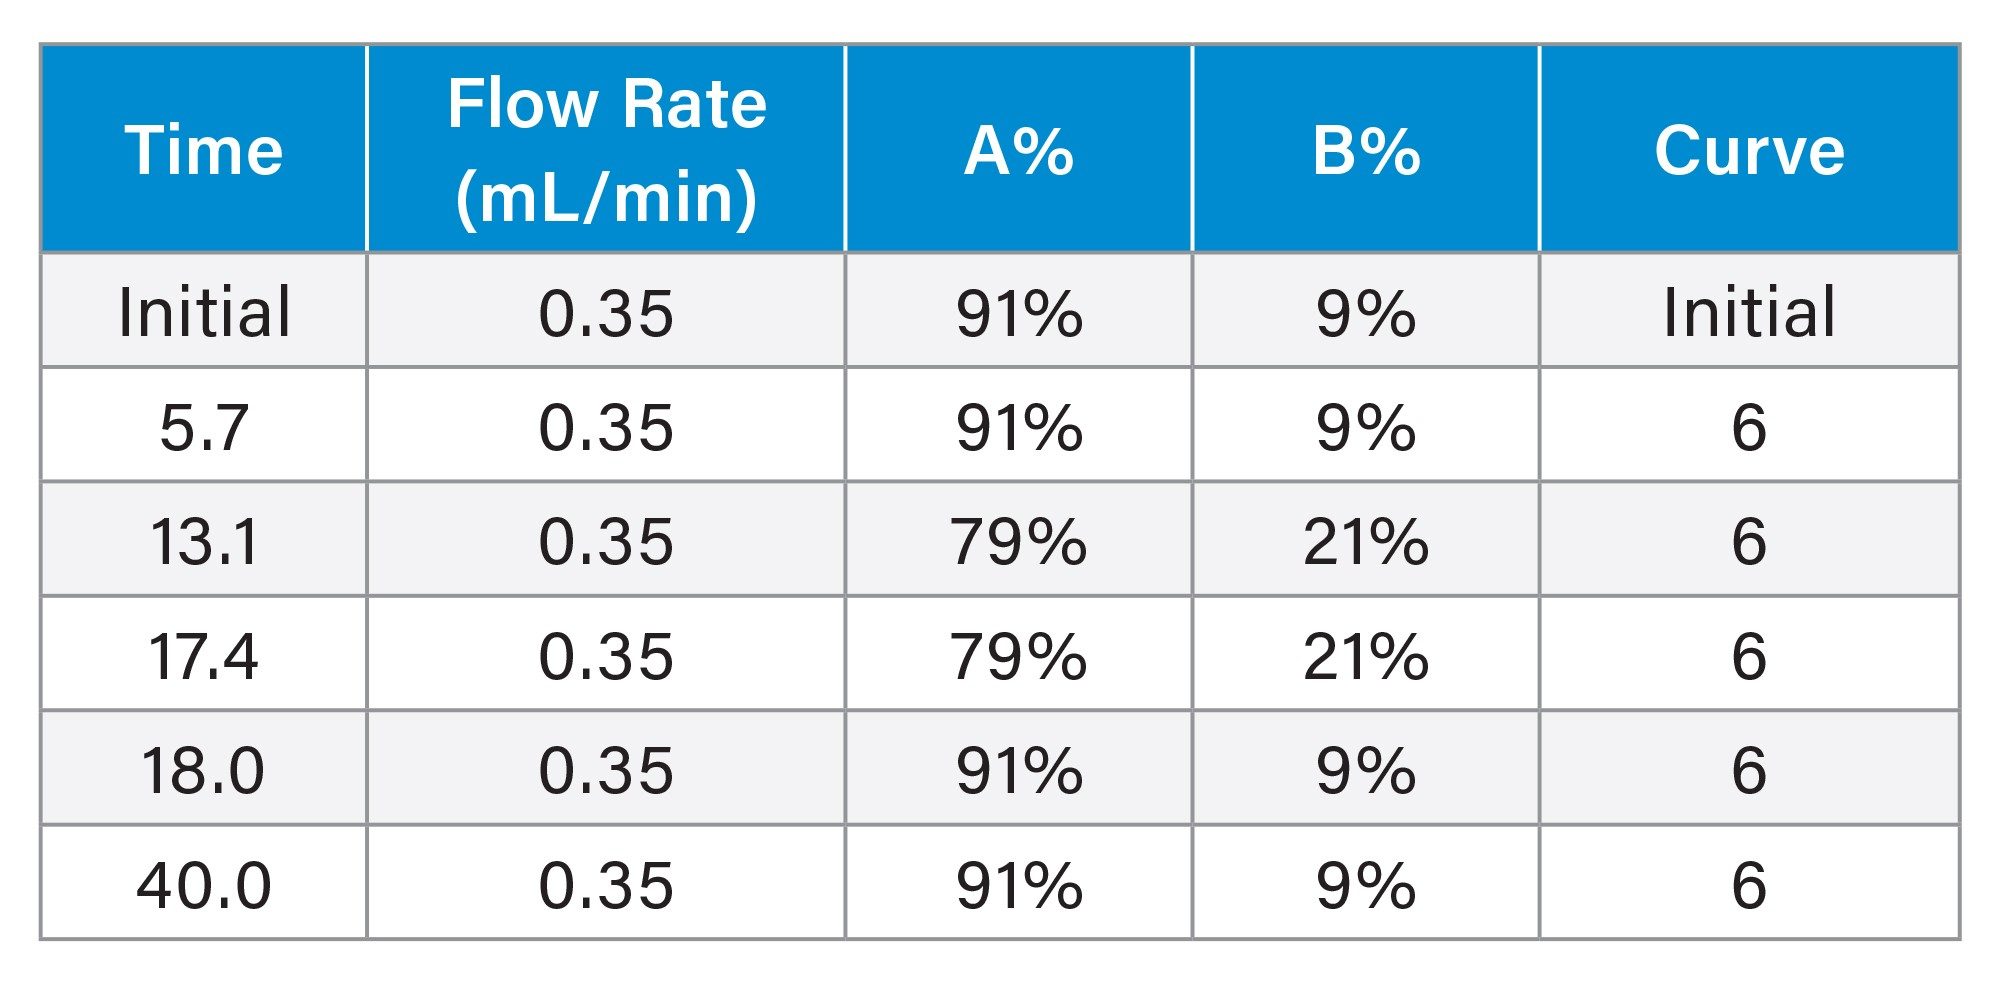
Gradient Elution Program
MS Conditions
|
Polarity: |
ESI- |
|
|
Capillary voltage: |
2.50 kV |
|
|
Source temperature: |
150 °C |
|
|
Desolvation temperature: |
350 °C |
|
|
Cone gas flow: |
40 L/hr |
|
|
Desolvation gas flow: |
650 L/hr |
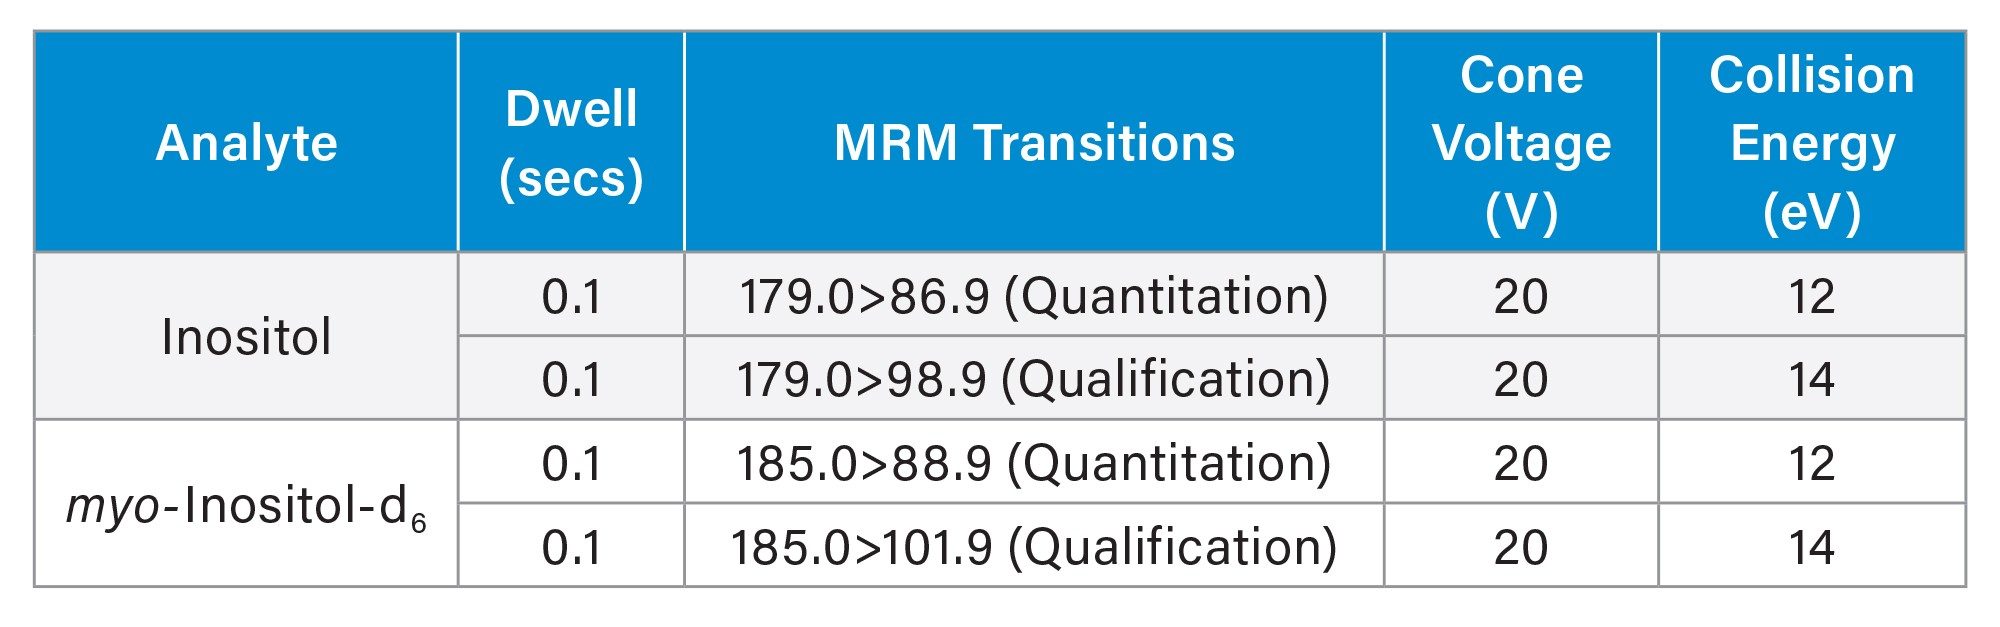
Multiple Reaction Monitoring (MRM) Transitions and Detection Parameters
Calibration and Limit of Quantitation
The relationship between the normalized response (MRM peak area ratio of standards to ISTD) and standard concentrations was modeled using a second-order polynomial regression, fitted by the least-squares method with a 1/x weighting factor.
Limit of quantitation (LOQ) in solvent and whole milk were estimated from the standard deviation (SD) of six replicate measurements (n=6) of a standard or spiked whole milk at concentrations near the LOQ (< 5xLOQ). LOQ was calculated as 10 times the SD.
Results and Discussion
Method Improvements for Complex Food Matrices
Previously, HILIC-MS method was developed for the determination of free inositol stereoisomers in dietary supplements. Sample preparation involved a simple dilute-and-filter process, and detection was performed using selected ion recording (SIR) on an ACQUITY QDa II Mass Detector. When this original HILIC-MS method was applied to more complex food matrices, such as milk, grains, and infant formulas, the initial results were unsatisfactory due to improbably high recovery levels (results not shown). To improve analytical accuracy for these food matrices, a protein precipitation step was incorporated using Carrez reagents into the sample preparation, and a more selective MS detection technique, MRM, using a Xevo TQ-S cronos Mass Spectrometer was adopted. These two improvements resulted in excellent recovery, which will be discussed in detail in the following section.
Method Accuracy and Precision
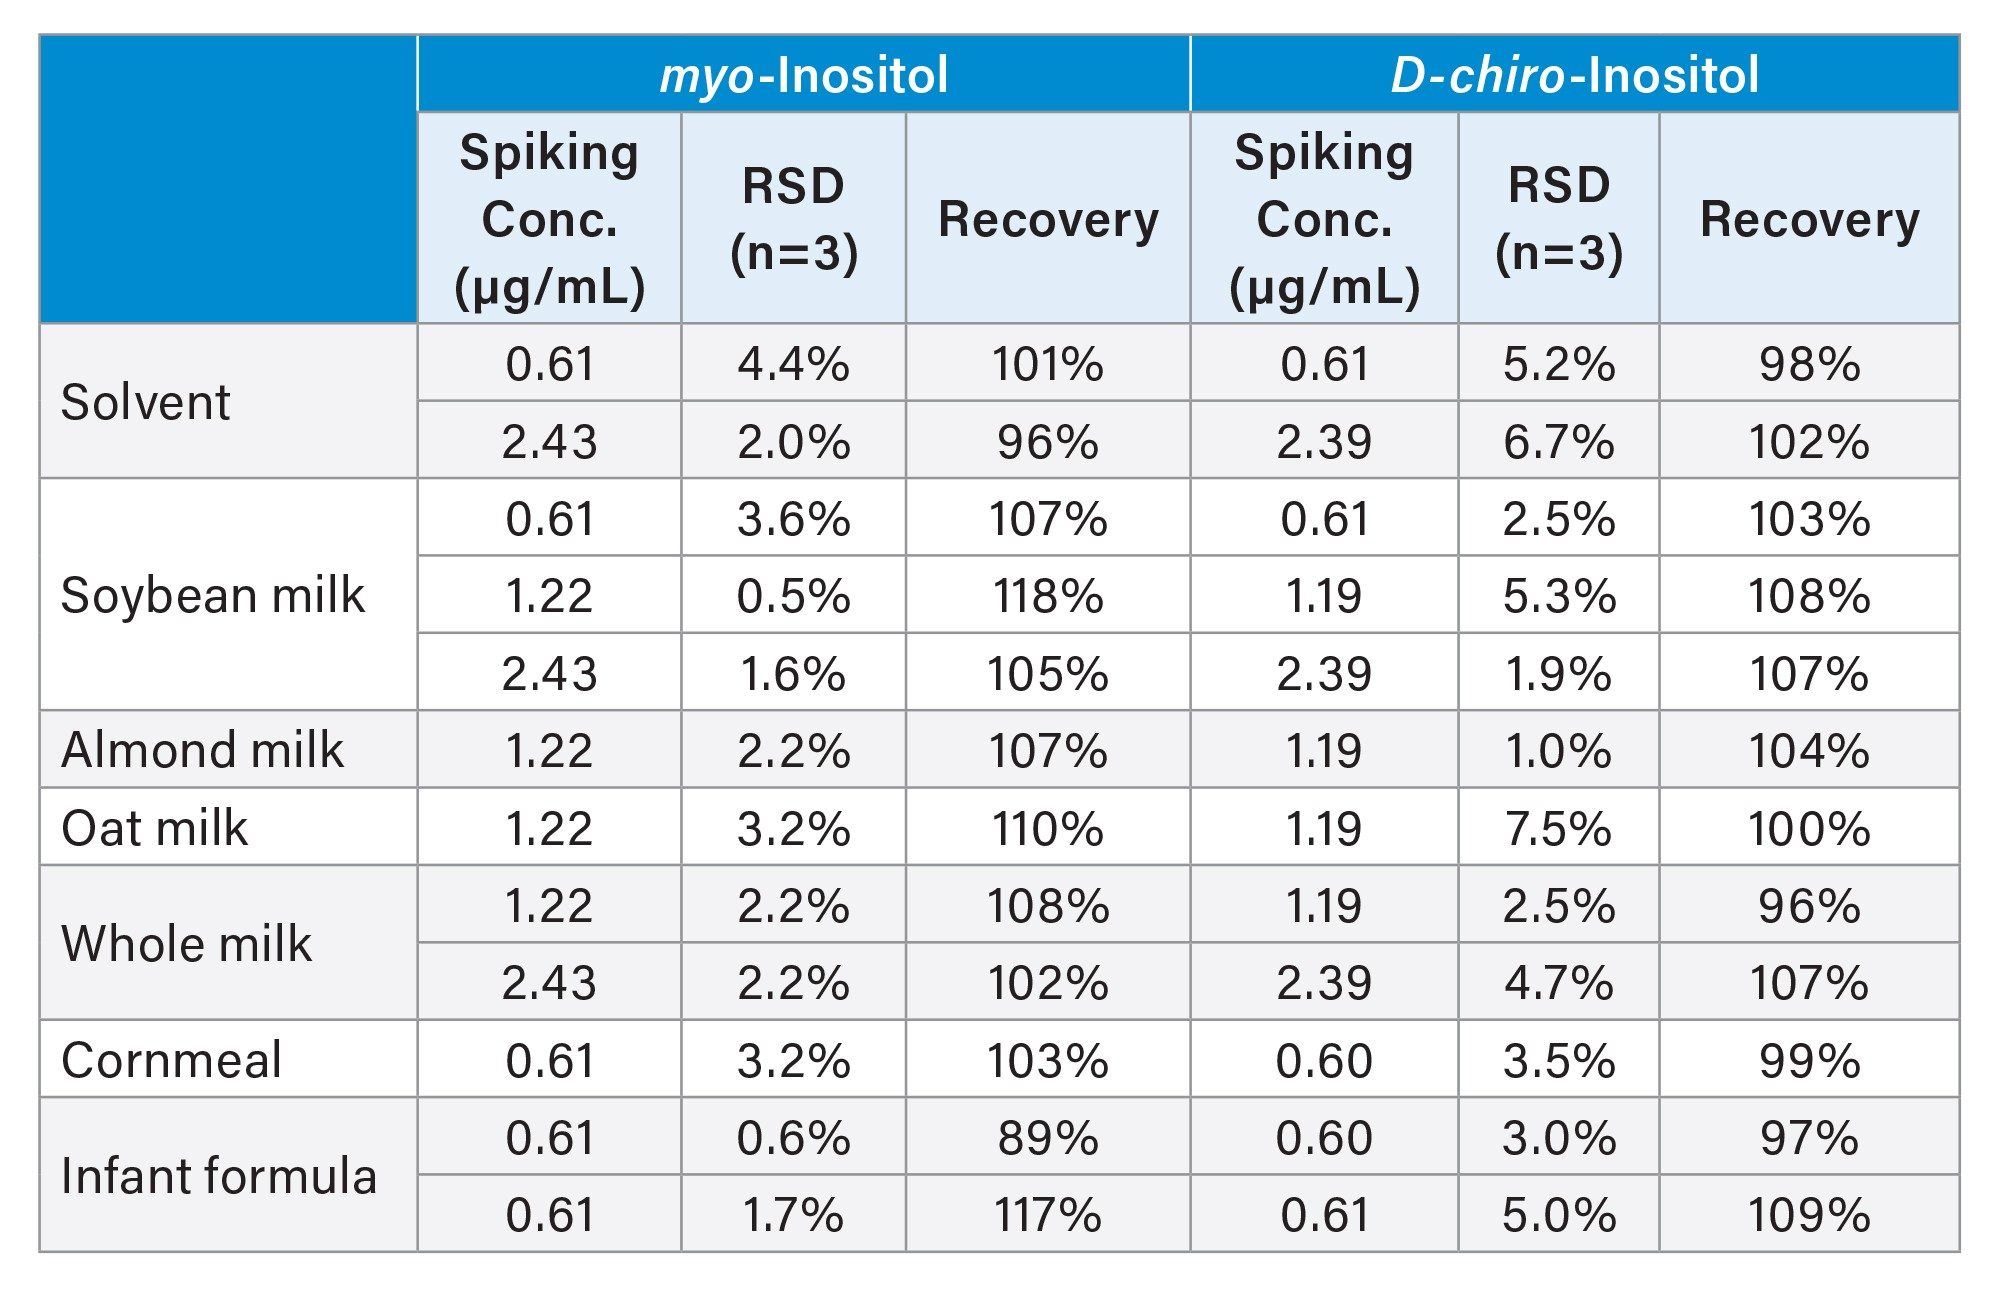
Myo-inositol and D-chiro-inositol were spiked into solvent blanks and food samples at various levels to evaluate accuracy and precision. Table 2 summarizes the spiking concentrations, relative standard deviations (RSDs, n=3), and recoveries. Recoveries for myo-inositol and D-chiro-inositol in the spiked solvent blanks ranged from 96% to 102%, confirming minimal analyte loss during protein precipitation with Carrez reagents and subsequent centrifugation and filtration steps. In spiking experiments with food samples, recoveries ranged from 89% to 118% for myo-inositol and from 96% to 109% for D-chiro-inositol. Most results (22 out of 24) fell within the recovery range of 80-110% as recommended by the AOAC International guidelines for concentrations between 0.1 and 10 ppm.9 The RSDs for these determinations were below 4.4% for myo-inositol and 7.5% for D-chiro-inositol, meeting the AOAC International Guidelines for Standard Method Performance Requirements for Standard Method Performance Requirements in repeatability. These findings demonstrated the excellent accuracy and precision of the optimized analytical method for quantifying inositol stereoisomers in complex food matrices.
Calibration Linearity and LOQ
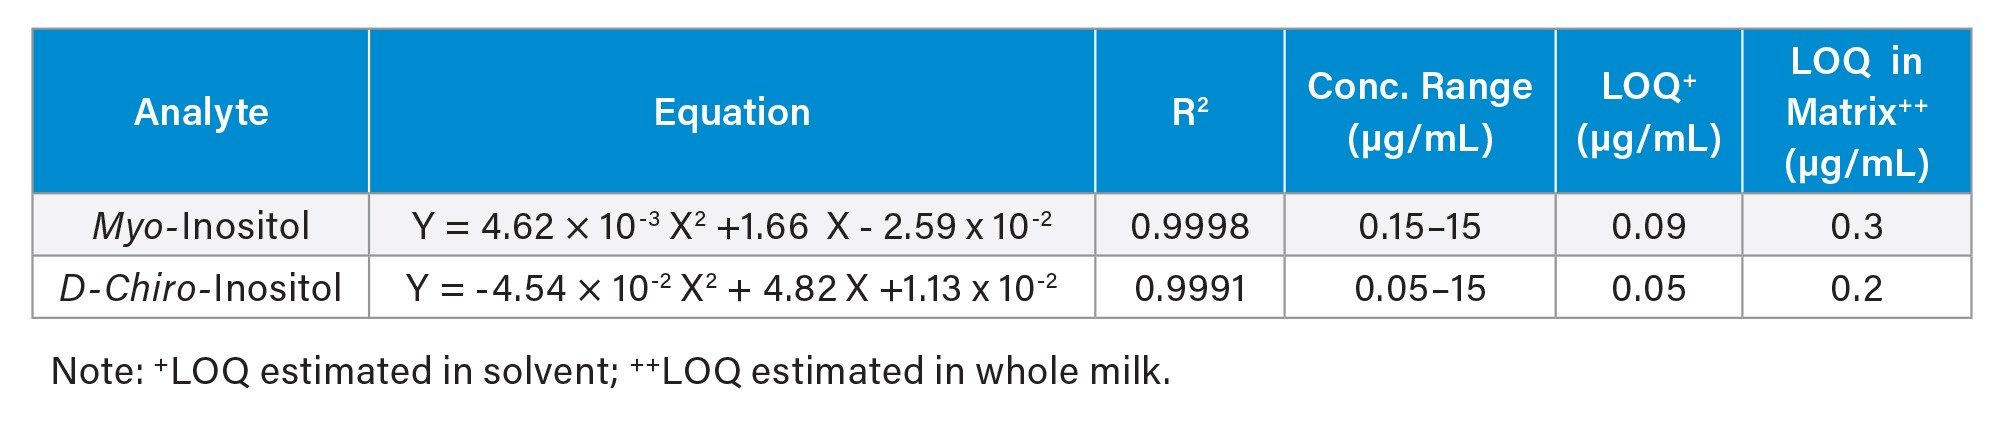
Table 3 summarizes the calibration equations and coefficients of determination (R2), along with calibration ranges and estimated LOQs for myo- and D-chiro-inositol. Excellent calibration linearity results (R2 ≥ 0.999) were obtained for both analytes. The LOQs in food matrix (whole milk) were estimated at 0.3 µg/mL for myo-inositol and 0.2 µg/mL for D-chiro-inositol in the final solutions, corresponding to 0.75 mg/100 mL and 0.50 mg/100 mL in whole milk, respectively. These LOQs are sufficiently sensitive given typical myo-inositol levels of 4-11 mg/100 mL in bovine mature milk reported in literature.1
Method Ruggedness
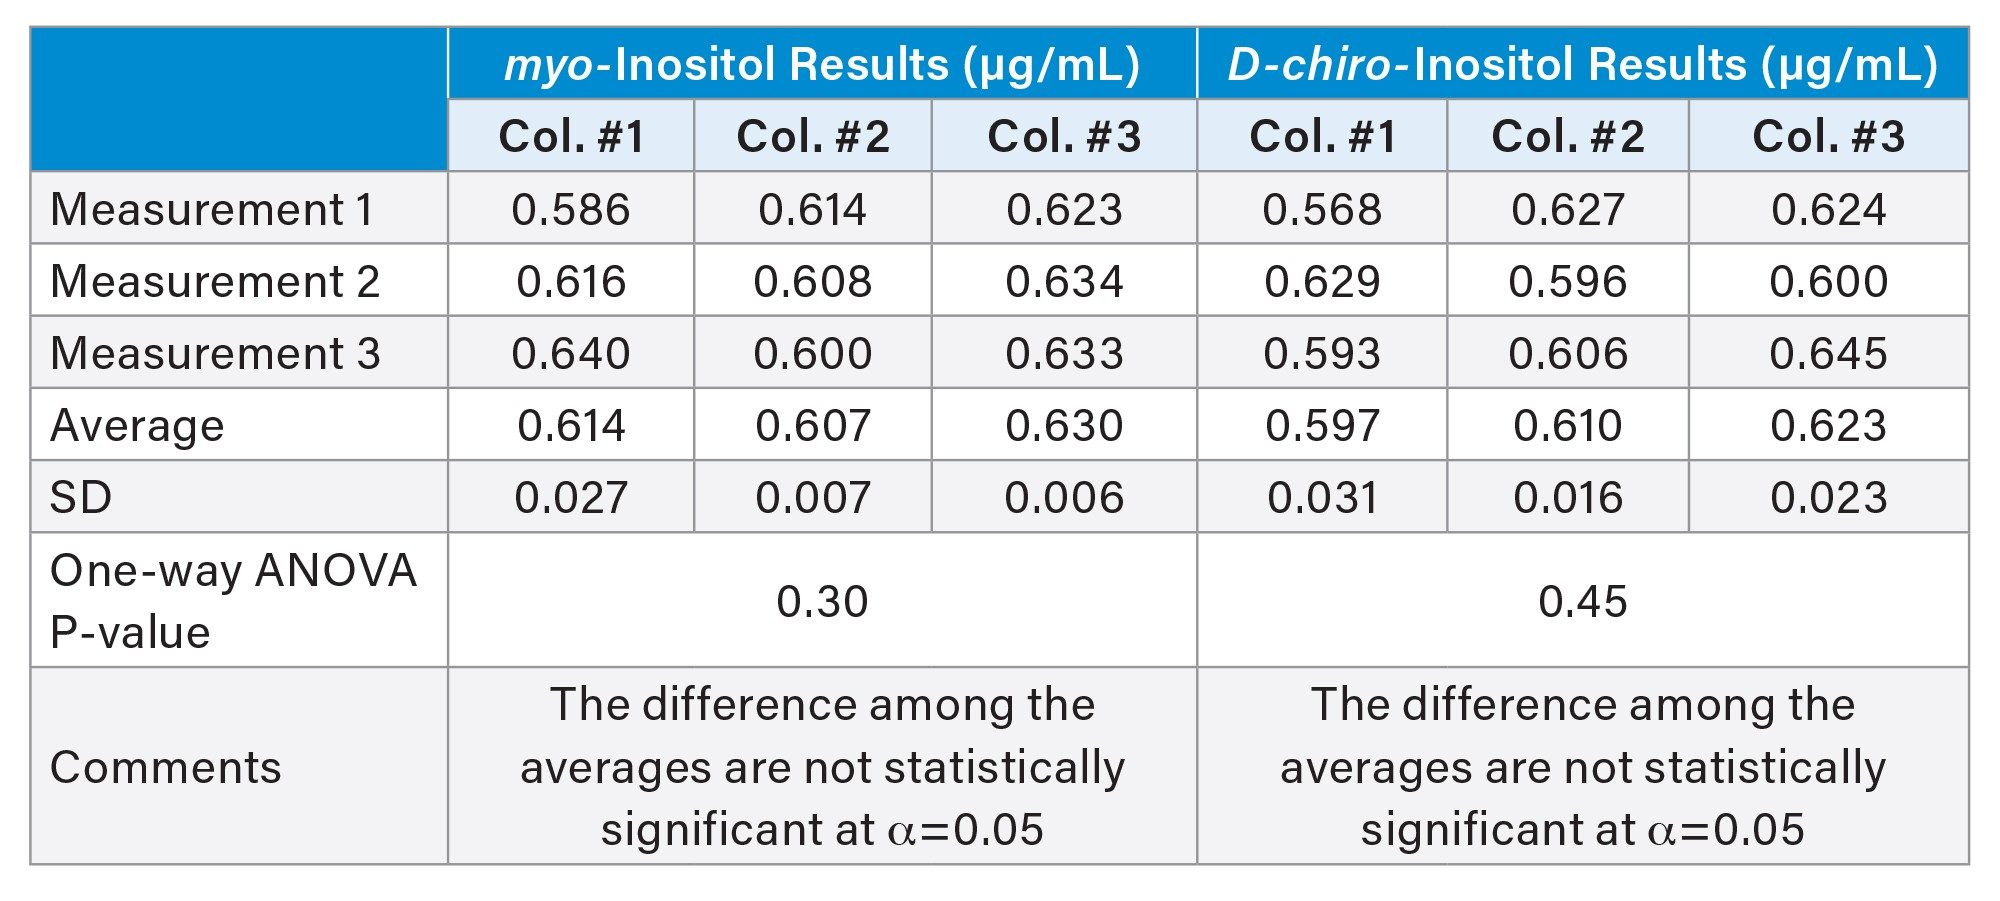
Previously, the ruggedness of this HILIC separation was evaluated in the determination of free inositols in supplements.8 Consistent separation performance was achieved by implementing precautionary measures, including end-of-day column rinsing with mobile phase (90% acetonitrile with no additive) and initial column conditioning through five consecutive injections of a blank at the beginning of a sample analysis. Here, the ruggedness of the method was further demonstrated by analyzing a solvent blank spiked with myo-inositol and D-chiro-inositol across three ACQUITY BEH Amide Columns from different production lots. The results from all individual measurements, along with the average and SD for each column, are summarized in Table 4. Comparable results were obtained across columns for myo-inositol and D-chiro-inositol. Furthermore, a one-way ANOVA (Analysis of Variance) revealed p-values of 0.30 for myo-inositol and 0.45 for D-chiro-inositol, confirming no statistically significant difference among averages across columns at α=0.05.
Method Specificity
In a previous study,8 it was found that structurally related isobaric monosaccharides, such as glucose, galactose, fructose, and mannose, did not interfere with the separation of inositol stereoisomers. These monosaccharides eluted earlier than the inositol stereoisomers. The tandem mass spectrometry employed in this method enhanced the method specificity through the use of inositol-specific MRM transitions and ion ratio monitoring, making interference from other compounds highly unlikely. The ion ratios of all samples in this study (peak area ratio of the qualification MRM to the quantitation MRM) were within ±30% (relative deviation) of those of standards in the same run, meeting the EU SANTE/2026 guideline for analyte identity confirmation.10
Sample Analysis
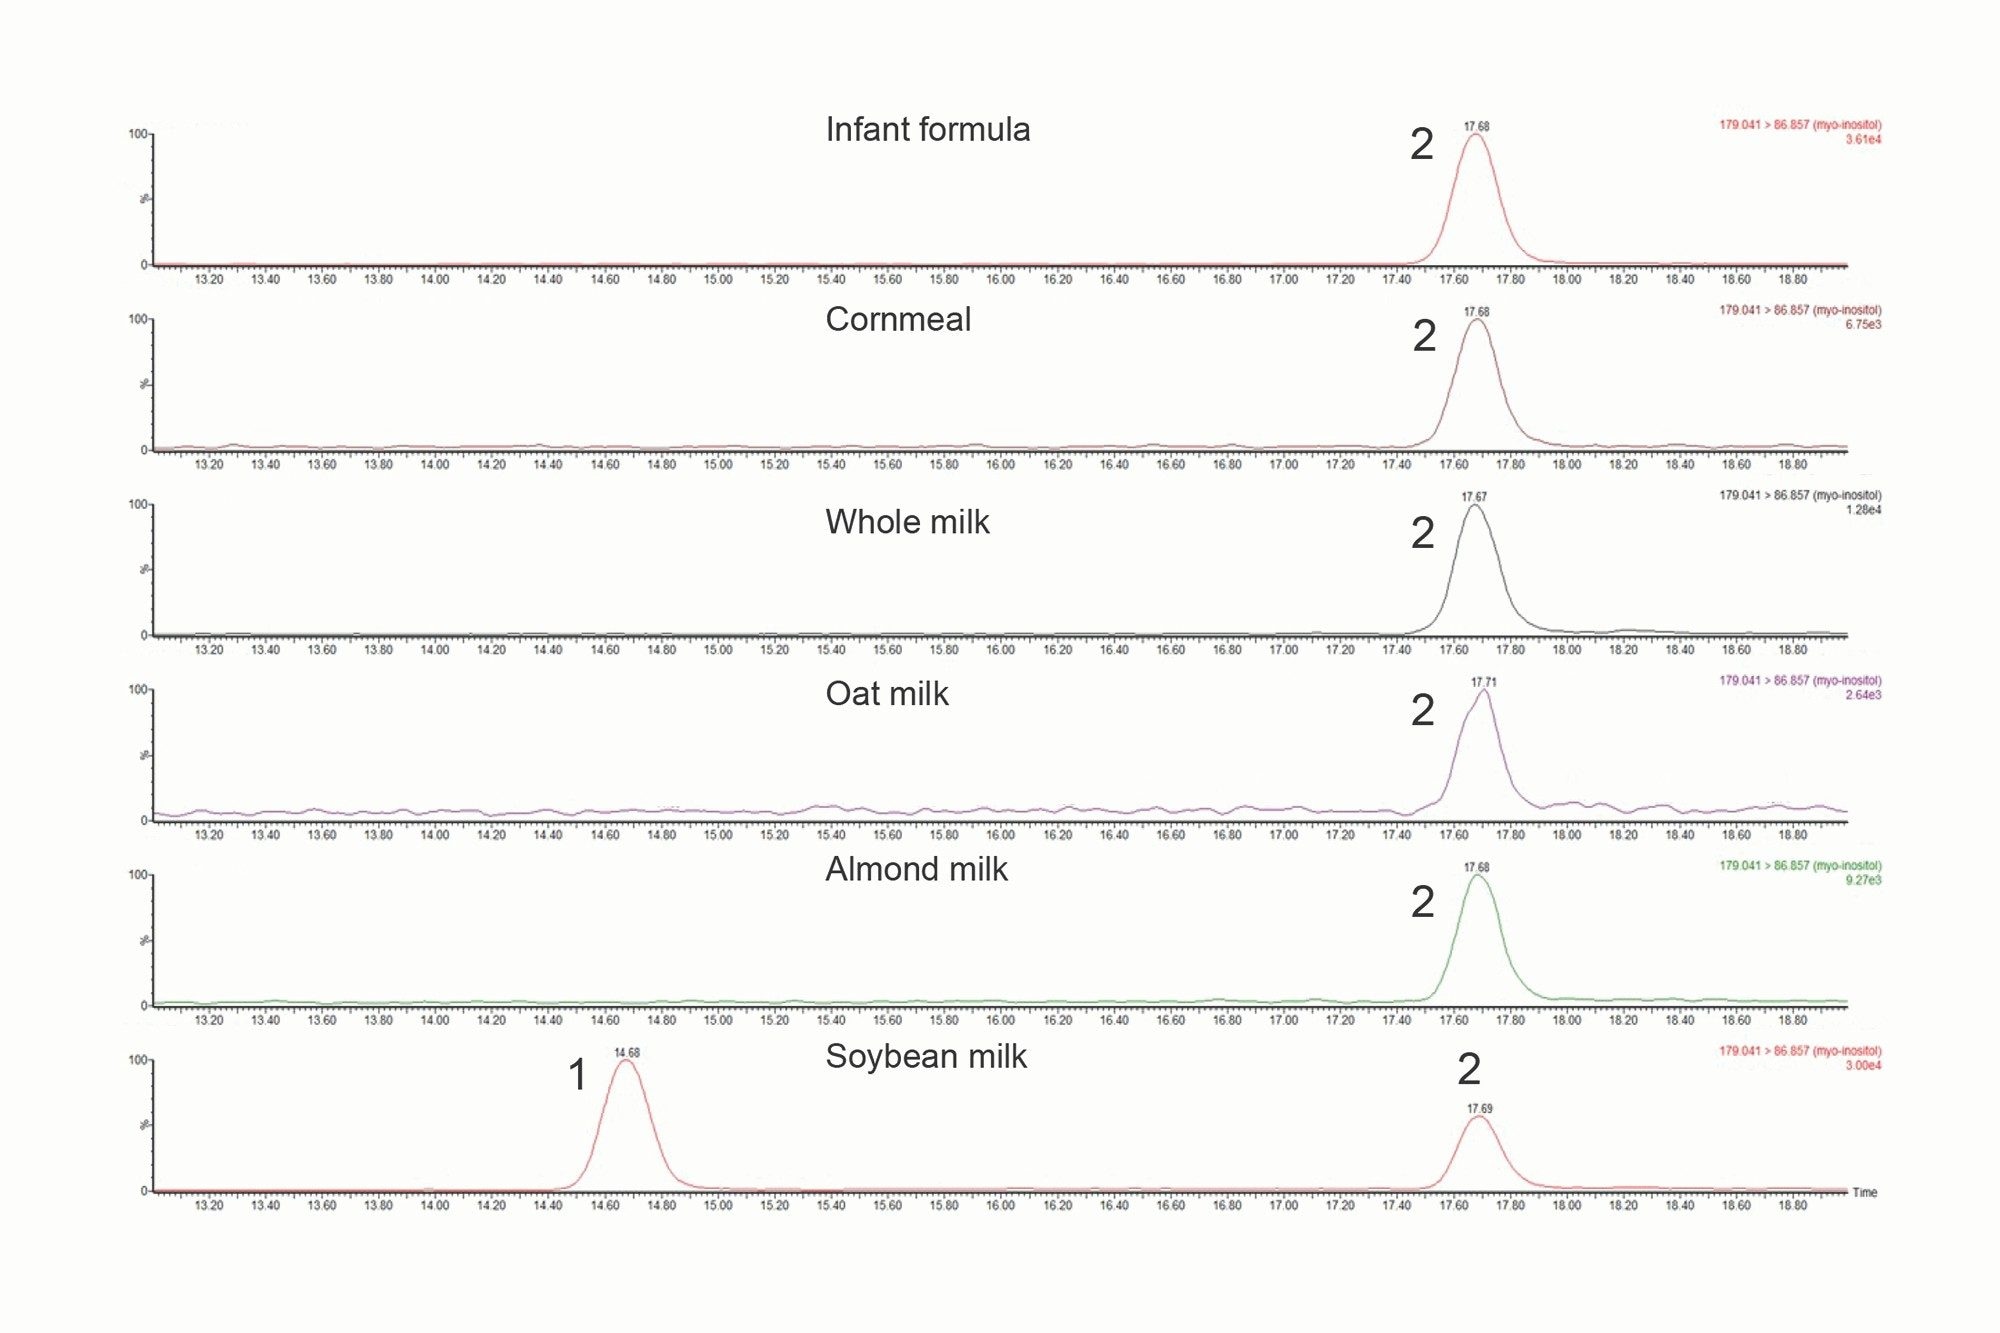
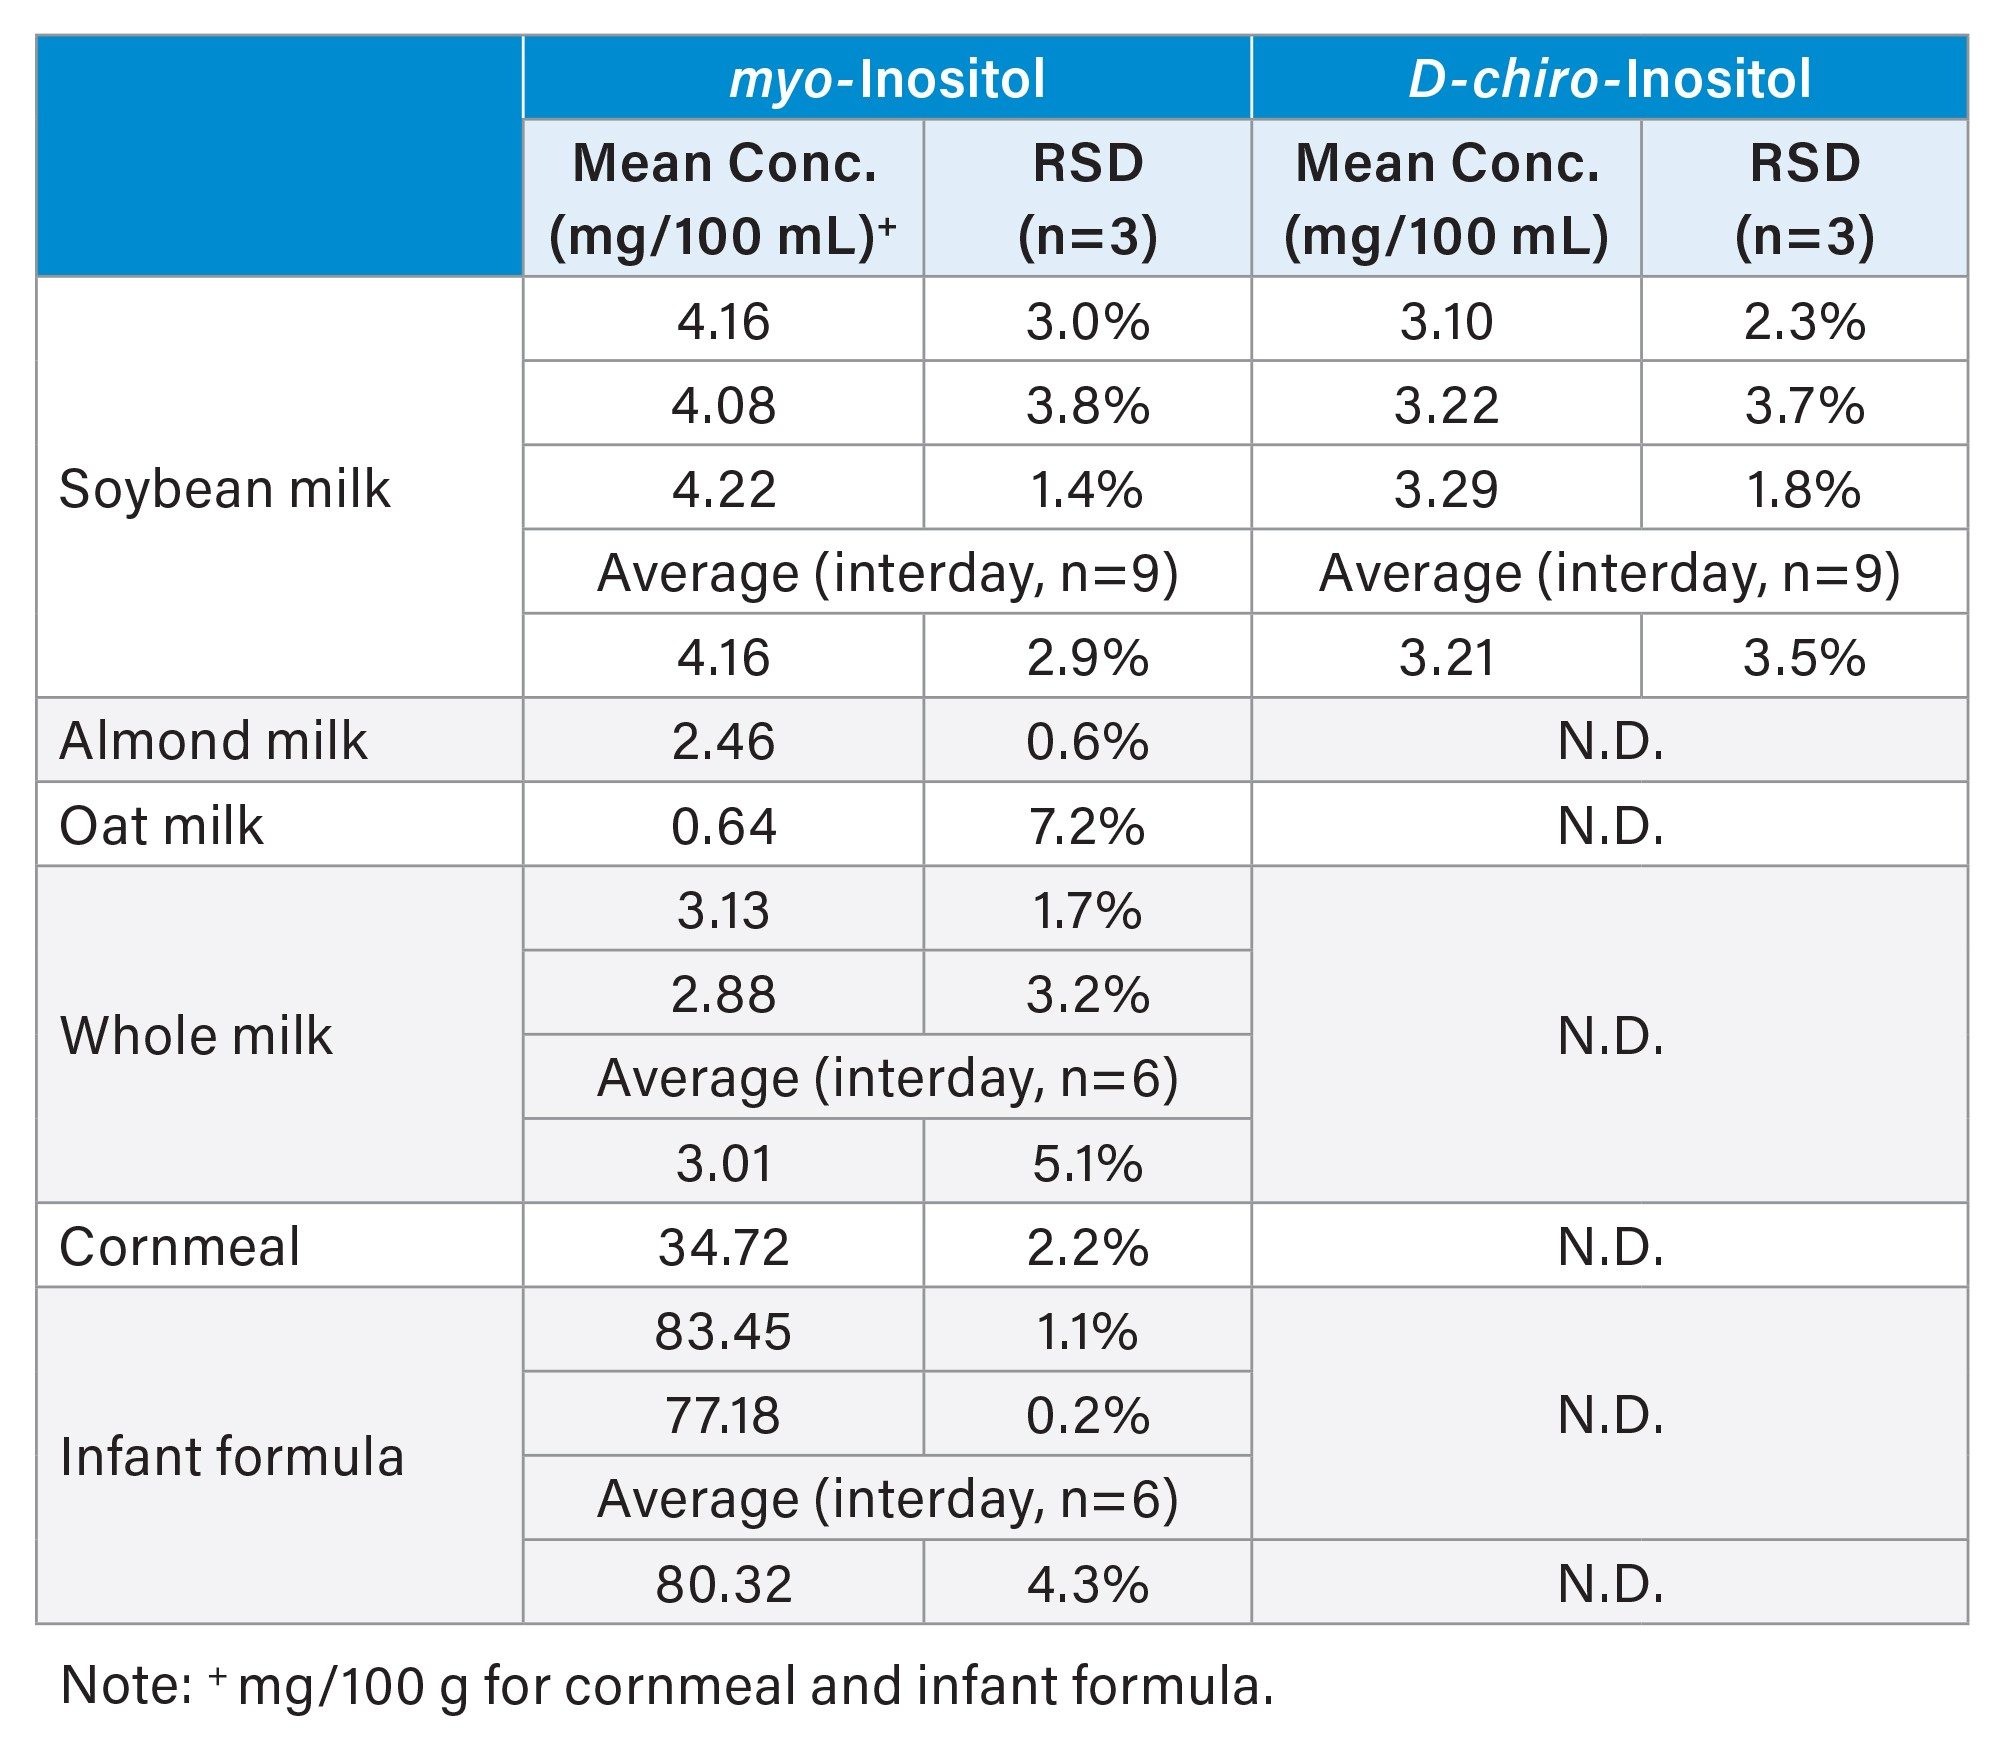
Figure 2 presents MRM chromatograms of food samples (transition 179.0 > 86.9) obtained under optimized HILIC-MS/MS conditions. These chromatograms exhibit clean baselines, demonstrating high selectivity in detection. Soybean milk was observed to contain both myo- and D-chiro-inositol, consistent with a report in the literature.11 Table 5 summarizes the results for these food samples, in which soybean milk, whole milk, and infant formula were analyzed in duplicate or triplicate on different days to evaluate interday RSD.
Repeatability (intraday RSD) for both myo- and D-chiro-inositol was below or equal to 3.8% for all samples, except oat milk (7.2%), where the myo-inositol concentration was near the LOQ (0.75 mg/100g). Interday RSDs values were below or equal to 5.1% for all samples and analytes. These results in repeatability and interday RSD were better than those reported for a similar HILIC-MS/MS approach, where repeatability for comparable concentrations was below 7%, and interday RSD values were reported as less than 13%, respectively.12–13
The free myo-inositol concentration in bovine whole milk was 3.01 mg/100 mL, which is in good agreement with the value reported for bovine mature milk (3.74±1.1 mg/100 mL free myo-inositol) by Ogasa et al.1 These findings demonstrate that the developed HILIC-MS/MS method is highly suitable for the determination of free inositols in the tested complex food matrices. Please note that although only D-chiro- and myo-inositols were demonstrated in this study, the developed method is capable of analyzing other free inositol stereoisomers. For bound inositols, an additional sample preparation step, such as hydrolysis, is required to release the bound forms into their free forms for analysis by the developed HILIC-MS/MS method.
Conclusion
We have developed a HILIC-MS/MS method for the separation and quantification of free inositol stereoisomers in dairy and plant-based milks, grains, and infant formulas, employing an ACQUITY BEH Amide Column on an Arc Premier System coupled with a Xevo TQ-S cronos Mass Spectrometer.
- Incorporating protein precipitation into the sample preparation significantly improved matrix cleanup.
- The ACQUITY BEH Amide Column delivered efficient separation of inositol stereoisomers and effectively resolved them from potential interfering monosaccharides.
- The Xevo TQ-S cronos Mass Spectrometer further enhanced quality of analysis through highly selective MS/MS detection.
This HILIC-MS/MS method was validated using both solvent standards and food samples, demonstrating excellent analytical performance in terms of linearity, sensitivity, specificity, accuracy, precision, and ruggedness. The method was successfully applied to commercially available food products and its suitability for routine quantitation of free inositol stereoisomers across a variety of food matrices has been demonstrated.
References
- Ogasa, K., Kuboyama, M., Kiyosawa, I., Suzuki, T., And Itoh, M. (1975). The Content of Free and Bound Inositoi in Human and Cow’s Milk. J. Nutr. Sci. Vitaminol., 21, 129-135.
- Sanz, M.L., Sanz, J., Martinez-Castro, I. (2004). Prescence of Some Cyclitols in Honey. Food Chemistry, 84, 133-135. https://doi:10.1016/S0308-8146(03)00200-0
- Soria, A., Sanz, M., & Villamiel, M. (2008). Determination of Minor a Crbohydrates in Carrot (Daucus carota L.) by GC–MS. Food Chemistry, 114(2), 758–762. https://doi.org/10.1016/j.foodchem.2008.10.060
- Kong, L., Wang, Y., & Cao, Y. (2008). Determination of Myo-inositol and d-chiro-inositol inBlack Rice Bran by Capillary Electrophoresis With Electrochemical Detection. Journal of Food Composition and Analysis, 21(6), 501–504. https://doi.org/10.1016/j.jfca.2008.04.005
- Megías-Pérez, R., Ruiz-Matute, A. I., Corno, M., & Kuhnert, N. (2019). Analysis of Minor Low Molecular Weight Carbohydrates in Cocoa Beans by Chromatographic Techniques Coupled to Mass Spectrometry. Journal of Chromatography A, 1584, 135–143. doi:10.1016/j.chroma.2018.11.033
- DiNicolantonio JJ, H O'Keefe J. Myo- inositol for Insulin Resistance, Metabolic Syndrome, Polycystic Ovary Syndrome and Gestational Diabetes. Open Heart 2022;9:e001989. http://doi:10.1136/openhrt-2022-001989
- Pintaudi, B.; Di Vieste, G.; Bonomo, M. The Effectiveness of Myo-Inositol and D-chiro Inositol Treatment in Type 2 Diabetes. Int. J. Endocrinol. 2016, 2016, 1–5. http://dx.doi.org/10.1155/2016/9132052
- Yang, J., Harden, S., and Rainville, P. Analysis of Free Inositol Stereoisomers in Dietary Supplements by Hydrophilic Liquid Chromatography Using The Arc Premier System and ACQUITY QDa II Mass Detector. Waters Application Note 720009186, Waters Corporation, 2025.
- AOAC INTERNATIONAL. (2016). Appendix F: Guidelines for Standard Method Performance Requirements. In Official Methods of Analysis of AOAC INTERNATIONAL, 20th Edition, pp. 1–18. Rockville, MD: AOAC INTERNATIONAL. Available at: https://www.aoac.org/wp-content/uploads/2019/08/app_f.pdf.
- European Commission. (2025). Analytical Quality Control and Method Validation Procedures for Pesticide Residues Analysis in Food and Feed (SANTE/11312/2021 v2026). Implemented by 01/01/2026. Retrieved from https://eurl-pesticides.eu/userfiles/file/EurlALL/SANTE-11312_2021-V2026.pdf.
- Zuluaga, A. M., Mena-García, A., Monzón, A. C. S., Rada-Mendoza, M., Chito, D. M., Ruiz-Matute, A. I., & Sanz, M. L. (2020). Microwave Assisted Extraction of Inositols for the Valorization of Legume By-Products. LWT, 133, 109971. https://doi.org/10.1016/j.lwt.2020.109971.
- Monnard, I., Bénet, T., Jenni, R. et al. Plasma and Urinary Inositol Isomer Profiles Measured by UHPLC-MS/MS Reveal Differences in Scyllo-Inositol Levels Between Non-Pregnant and Pregnant Women. Anal Bioanal Chem 412, 7871–7880 (2020). https://doi.org/10.1007/s00216-020-02919-8.
- Flores, M. I. A., Moreno, J. L. F., Frenich, A. G., & Vidal, J. L. M. (2011). Fast Determination of Myo-Inositol in Milk Powder by Ultra High Performance Liquid Chromatography Coupled to Tandem Mass Spectrometry. Food Chemistry, 129(3), 1281–1286. https://doi.org/10.1016/j.foodchem.2011.05.045.
720009200, January 2026