A Sensitive and Cost-Effective LC–MS Method for Quantifying N-Nitroso-Atenolol in Drug Formulation
Henry Foddya, Matthew Gregoryb, Joe Lackeyb, Moritz Perscheidb, Neil Walsha
a Waters Corporation, Wilmslow, United Kingdom
b LGC Standards, Guildford, United Kingdom
Published on December 09, 2025
Benefits
- Sensitive and cost-effective UHPLC–MS method to quantify N-nitroso-atenolol in both atenolol drug substance and drug product down to 1.5 ppm (10% of the CPCA specification limit).
- Reproducible sub-ppb levels of detection using the ACQUITY QDa II Mass Detector, with strong linearity and recovery across challenging pharmaceutical matrices.
- Integration with Empower™ CDS software enables streamlined data analysis and review within a regulatory-compliant environment.
- Effective chromatographic separation allows clear differentiation from structurally related impurities, supporting robust routine testing in alignment with regulatory limits for CPCA Category IV NDSRIs.
- Reference standards from LGC Standards, including Atenolol, N-Nitroso-Atenolol, and N-Formyl-Atenolol, provide reliable reference points enabling confident detection of the NDSRI at trace levels.
Introduction
N-nitrosamines have emerged as a central and ongoing challenge to pharmaceutical quality and safety, with growing concern over potential toxicity, mutagenicity, and carcinogenicity. Even at trace levels, these impurities can pose unacceptable risks to patient health. As such, regulatory agencies such as the U.S. Food and Drug Administration (FDA) and the European Medicines Agency (EMA) have issued rigorous guidance on the identification, control, and acceptable intake (AI) limits of N-nitrosamines in both drug substance and product.1 This has resulted in a series of high-profile product recalls in recent years, with the presence of N-nitrosamines continuing to prove a significant challenge and source of concern for the pharmaceutical industry.2,3
N-nitrosamine drug substance-related impurities (NDSRIs) represent a particularly concerning subclass of nitrosamines, with a structural resemblance to the active pharmaceutical ingredient (API). NDSRIs typically form through reactions between susceptible secondary or tertiary amine groups present within a given drug substance, and nitrosating agents (such as nitrite) introduced during synthesis, formulation, or storage. Further exacerbating factors can include contaminated raw materials or process reagents, as well as degradation under heat, humidity, or light.4
One example of such NDSRI formation is N-nitroso-atenolol, which can form through the nitrosation of atenolol - a selective β1-adrenergic blocker widely prescribed in cases of hypertension and arrhythmias. Hypertension affects over 1.2 billion adults aged 30–79 years worldwide, with atenolol among the many off-patent anti-hypertensive agents commonly prescribed in clinical practice.5
In 2023, the Ministry of Food and Drug Safety (MFDS) of South Korea reported the detection of N‑nitroso-atenolol in atenolol-containing pharmaceutical products manufactured using API sourced from an Indian supplier.6 This finding underscored the necessity for enhanced analytical testing and more stringent oversight of N-nitrosamine impurities in pharmaceutical formulations.
Currently, N-nitroso-atenolol is categorizsed as a Category IV NDSRI, with regulatory authorities such as the FDA and EMA establishing an acceptable intake (AI) of 1500 ng per day - based on the Carcinogenic Potency Categorization Approach (CPCA).7 Given the maximum daily dose (MDD) of atenolol is 100 mg, the corresponding specification limit for N‑nitroso‑atenolol in drug formulation is calculated as 15 ppm (AI/MDD). This threshold highlights the critical regulatory emphasis on the identification, control, and minimization of NDSRI exposure in order to ensure long-term patient safety.
Given the trace-level regulatory limits established for NDSRIs, and the structural similarities these compounds often share with parent APIs, the application of highly sensitive and selective analytical techniques is essential for their accurate quantification. Liquid chromatography coupled with mass spectrometry (LC–MS) has become the standard analytical platform, offering the required sensitivity and chromatographic resolution to detect NDSRIs at nanogram-per-gram (ng/g) levels.
Among LC–MS configurations, tandem quadrupole mass spectrometry (LC–MS/MS) and high-resolution mass spectrometry (HRMS) are most frequently employed due to their superior sensitivity, selectivity, and robustness in trace-level impurity analysis. However, these systems are associated with high capital and operational costs, which may limit their accessibility in resource-constrained laboratories.
Recent publications have demonstrated that, for some NDSRI workflows, a single quadrupole mass detector is sufficient to provide the specificity and sensitivity required.8 Supporting this idea, the below following experiments demonstrate the applicability of an alternative, cost-effective approach to analysis, by coupling an ultra-high performance liquid chromatography (UHPLC) system with a single quadrupole mass detector. This configuration was evaluated for its suitability in the detection of Category IV and V NDSRIs, with the goal of enabling high-throughput testing in routine quality control environments.
Experimental
LC-MS Experimental Conditions
|
LC system: |
ACQUITY Arc™ QSM-R UHPLC System |
|
Detection: |
ACQUITY QDa II Mass Detector |
|
UV system: |
Photo Diode Array (PDA) Detector |
|
Column(s): |
CORTECS™ Premier T3 Column, 2.7 µm, 2.1 mm x 100 mm (p/n: 186010473) |
|
Column temperature: |
45 °C |
|
Sample temperature: |
5 °C |
|
Injection volume: |
1 µL |
|
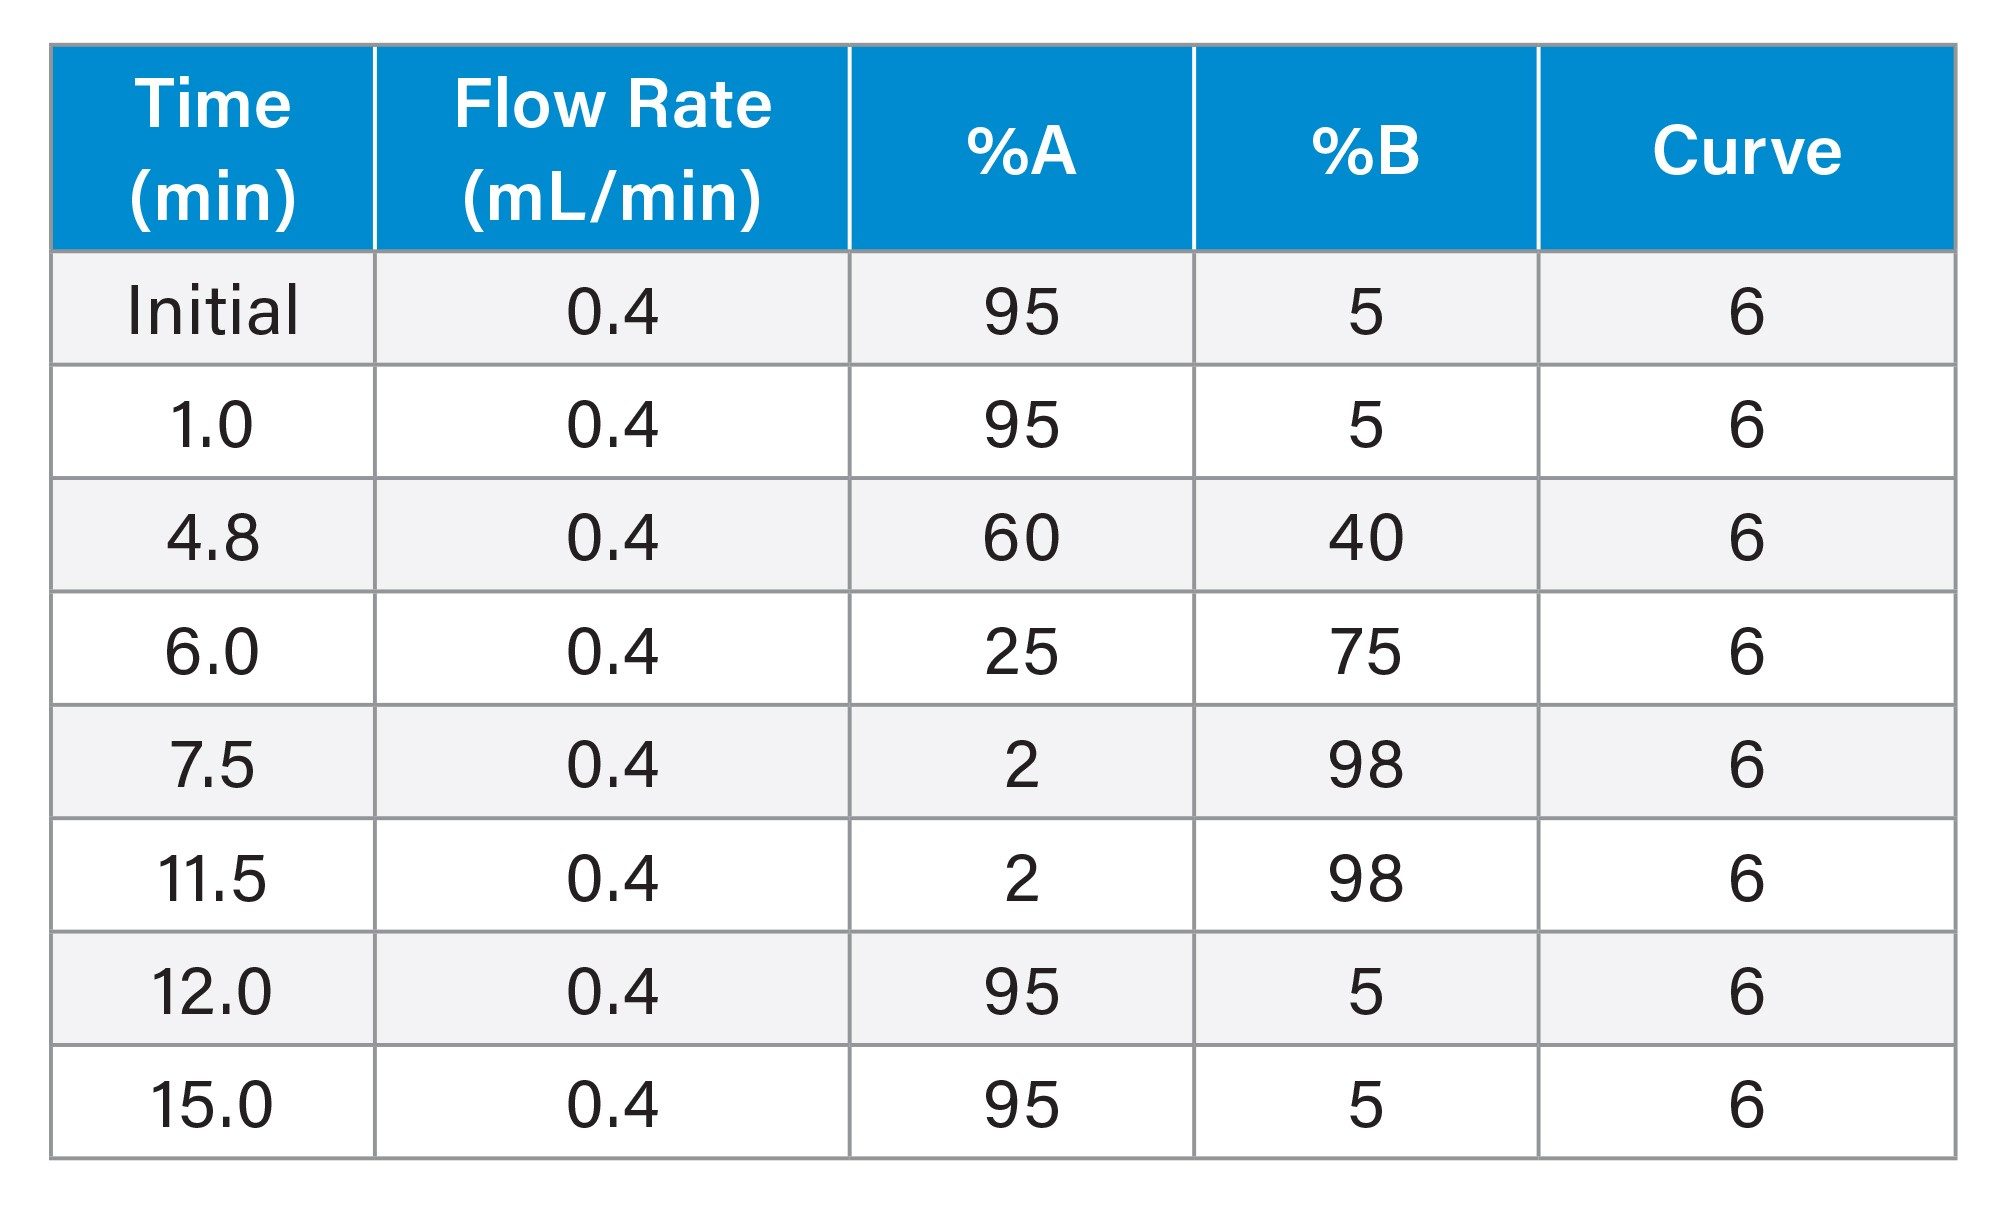
Flow rate: |
0.4 mL/min |
|
Run time: |
15.0 min |
|
Mobile phase A: |
0.1% Formic Acid in Water |
|
Mobile phase B: |
0.1% Formic Acid in Methanol |
|
Vials: |
Clear glass 12 x 32 mm screw neck vial (p/n: 186000273) |
|
Ionization: |
Positive Electrospray (ESI+) |
|
Capillary voltage: |
0.4 kV |
|
Desolvation temperature: |
600 °C |
|
Source temperature: |
120 °C |
|
Extension loop: |
50 µL (Port 6) |
Gradient Table
Software
|
Data acquisition, processing, and reporting: |
Empower CDS 3.8.1 |
Standards and Reagents
Atenolol (CAS 29122-68-7) and N-Nitroso-Atenolol (CAS 134720-04-0) reference materials were supplied by (Mikromol, part of LGC Standards), and N-Formyl-Atenolol (CAS 1159210-06-6) was synthesised as a custom analytical standard by TRC, also part of LGC Standards. Commercially available atenolol tablets (50 mg) were obtained separately and used as received for experimental purposes. All samples were stored at 4 oC until analysis. Primary stock solutions were diluted in 100% methanol. Optima LC-MS grade solvents (purchased from Fisher Scientific) and HPLC grade formic acid (purchased from Sigma Aldrich) were used for this analysis.
Calibration Curve Preparation
An authentic standard of N-nitroso-atenolol in methanol was used to create a serially diluted solvent calibration curve, ranging from 0.2–150 ng/mL. A matrix calibration curve was prepared by serially diluting the same reference standard into a 0.5 mg/mL solution of drug substance in methanol.
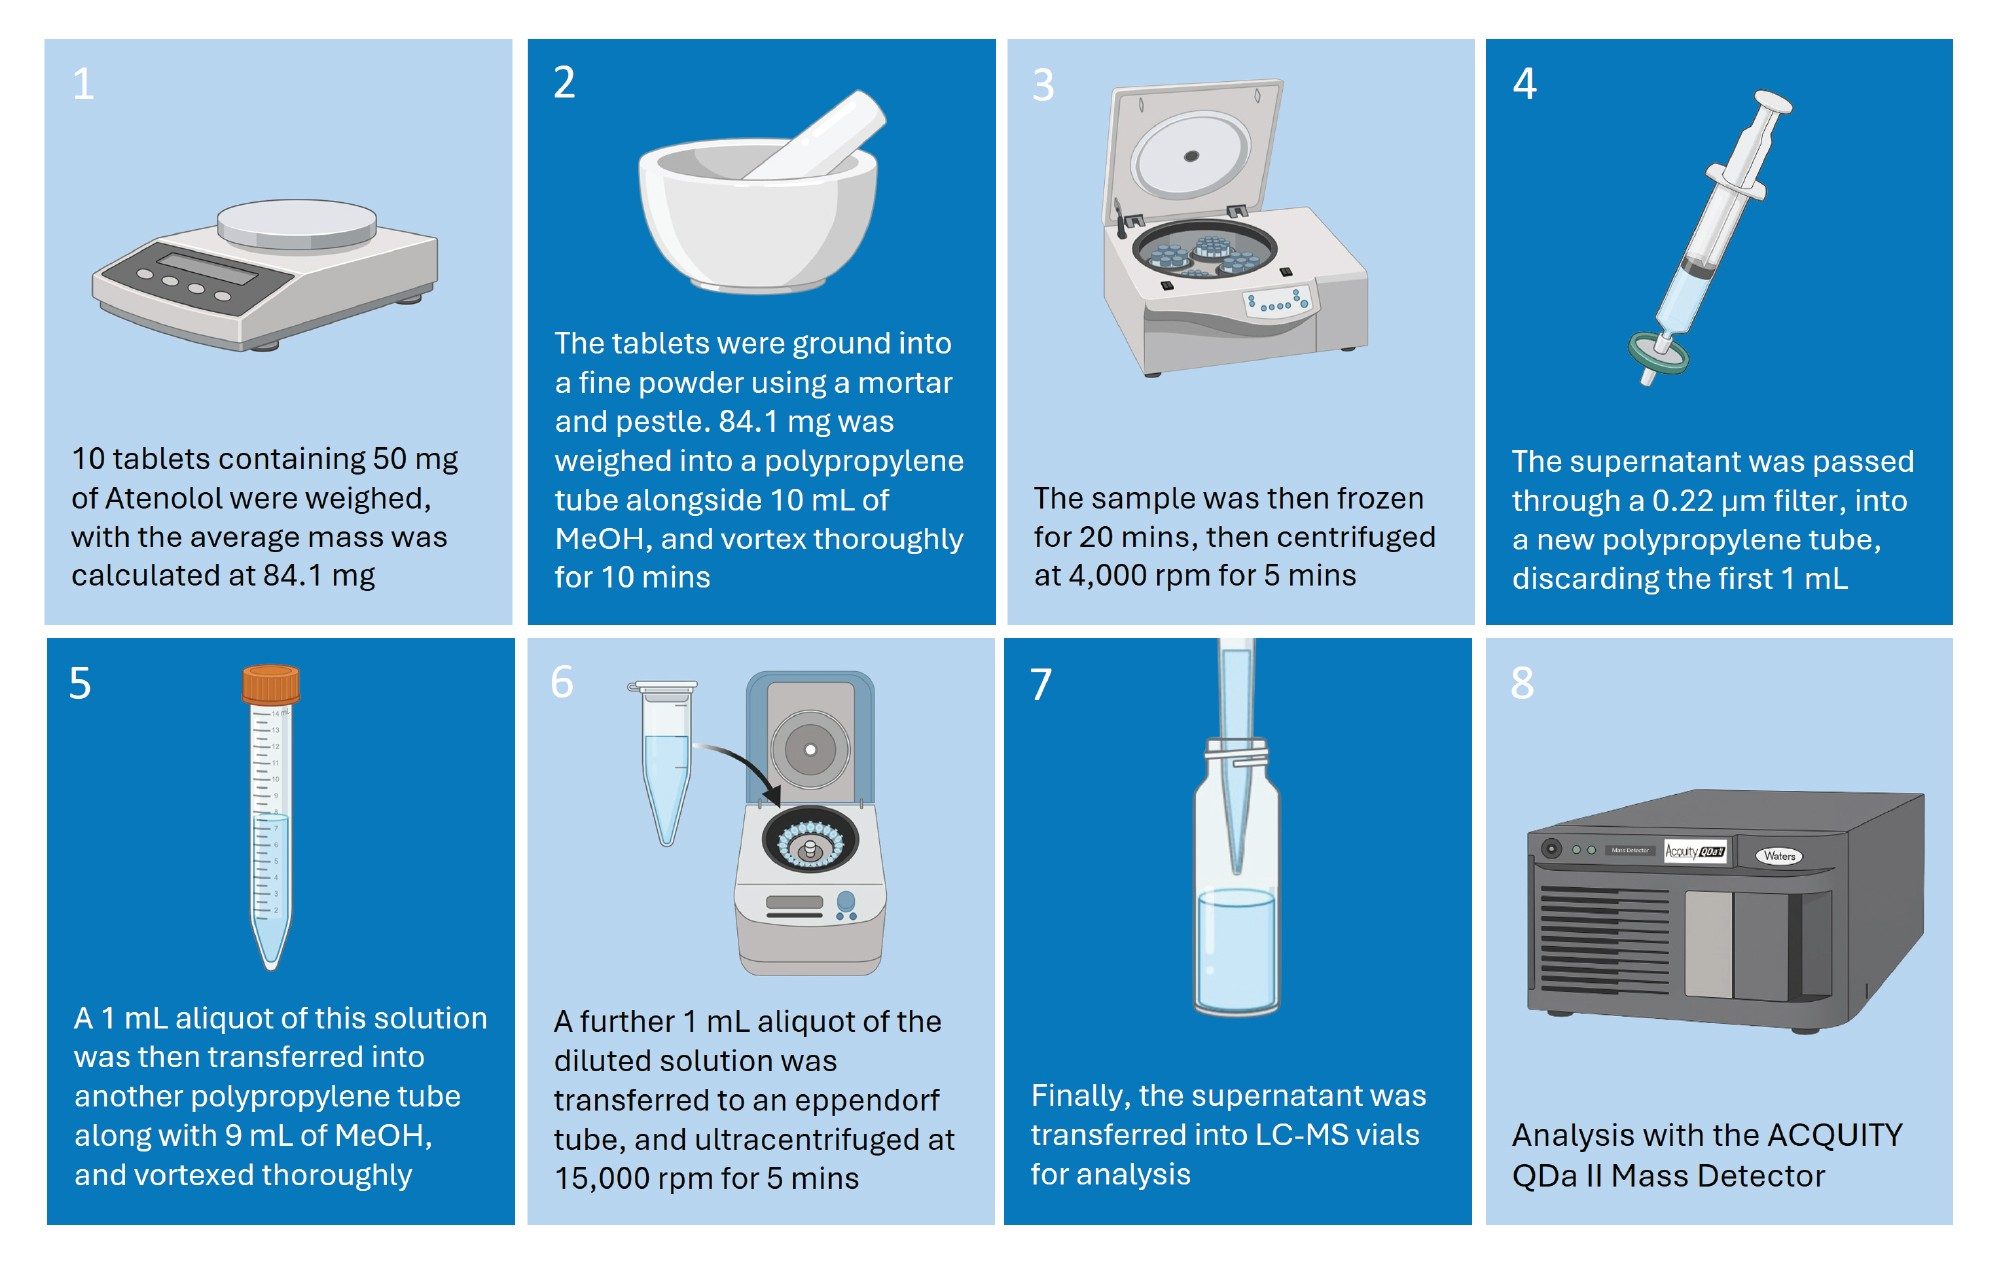
Sample Preparation
The sample preparation procedure used in this workflow is described in Figure 1. When assessing drug substance recovery, 50 mg of the Atenolol reference standard was weighed and used in place of the average tablet weight. The final in-vial concentration of the API in both cases was 0.5 mg/mL.
Instrumentation
An ACQUITY Arc UHPLC System, run using Path 2 to emulate UHPLC conditions, was coupled with a ACQUITY QDa II Mass Detector for this analysis. The LC system provides flexibility to maximize productivity through efficient and rapid 2.5–2.7 µm UHPLC separations. A CORTECS Premier T3 Column was used, – as it generates significantly lower back pressure while maintaining performance and separation, increasing the scope for method development which may otherwise be constrained by the pressure limitations (9500 psi) of the LC system. Additionally, the MaxPeak™ High Performance Surface (HPS) coating of the premier column reduces compound-surface interactions, helping to reduce carryover in the method.
Due to poor solubility in aqueous solvents, 100% methanol was used as a diluent in this study. The addition of a 50 µL extension loop added before the column improves mixing of high-organic samples into comparatively high-aqueous mobile, greatly improving peak shape.9
A divert valve was also used in this workflow, which acts to automatically divert flow to waste during a stated time window. The divert valve was positioned downstream from the PDA detector, but upstream of the mass detector, with the flow diverted to waste from 0-6 minutes, and from 8-15 minutes. In this way, monitoring of the API elution can be performed using the UV trace, while safeguarding the mass detector from high sample concentrations, ensuring more robust and consistent analytical performance.
Results and Discussion
Chromatographic resolution and separation between the atenolol and N-nitroso-atenolol are crucial to reduce potential matrix effects that could occur due to the proximity of the high levels of API. Throughout the workflow, a PDA detector was used to assess the elution of the API, with a wavelength of 225 nm.
An LC method was first developed in solvent to adequately separate N-nitroso-atenolol (RT = 6.72 minutes) from the API (RT = 3.45 minutes) and subsequently adjusted for matrix co-elution. Figure 2 shows the sensitivity of the developed method using the ACQUITY QDa II Mass Detector in selected ion recording (SIR) acquisition mode, with linearity in solvent down to 0.2 ng/mL, or 0.2 picograms on-column. In solvent, the compound was found to be linear (1/X weighted) over a range of 0.2–150 ng/mL (R2 = 0.999), with residual values not exceeding 14.5% across the calibration range (calibration not shown).
![An SIR (m/z 296.2) chromatogram of [A] a process blank sample, and [B] a 0.2 ng/mL N-Nitroso-Atenolol sample](/content/dam/waters/en/app-notes/2025/720009167/720009167en-f2.jpg.82.resize/img.jpg)
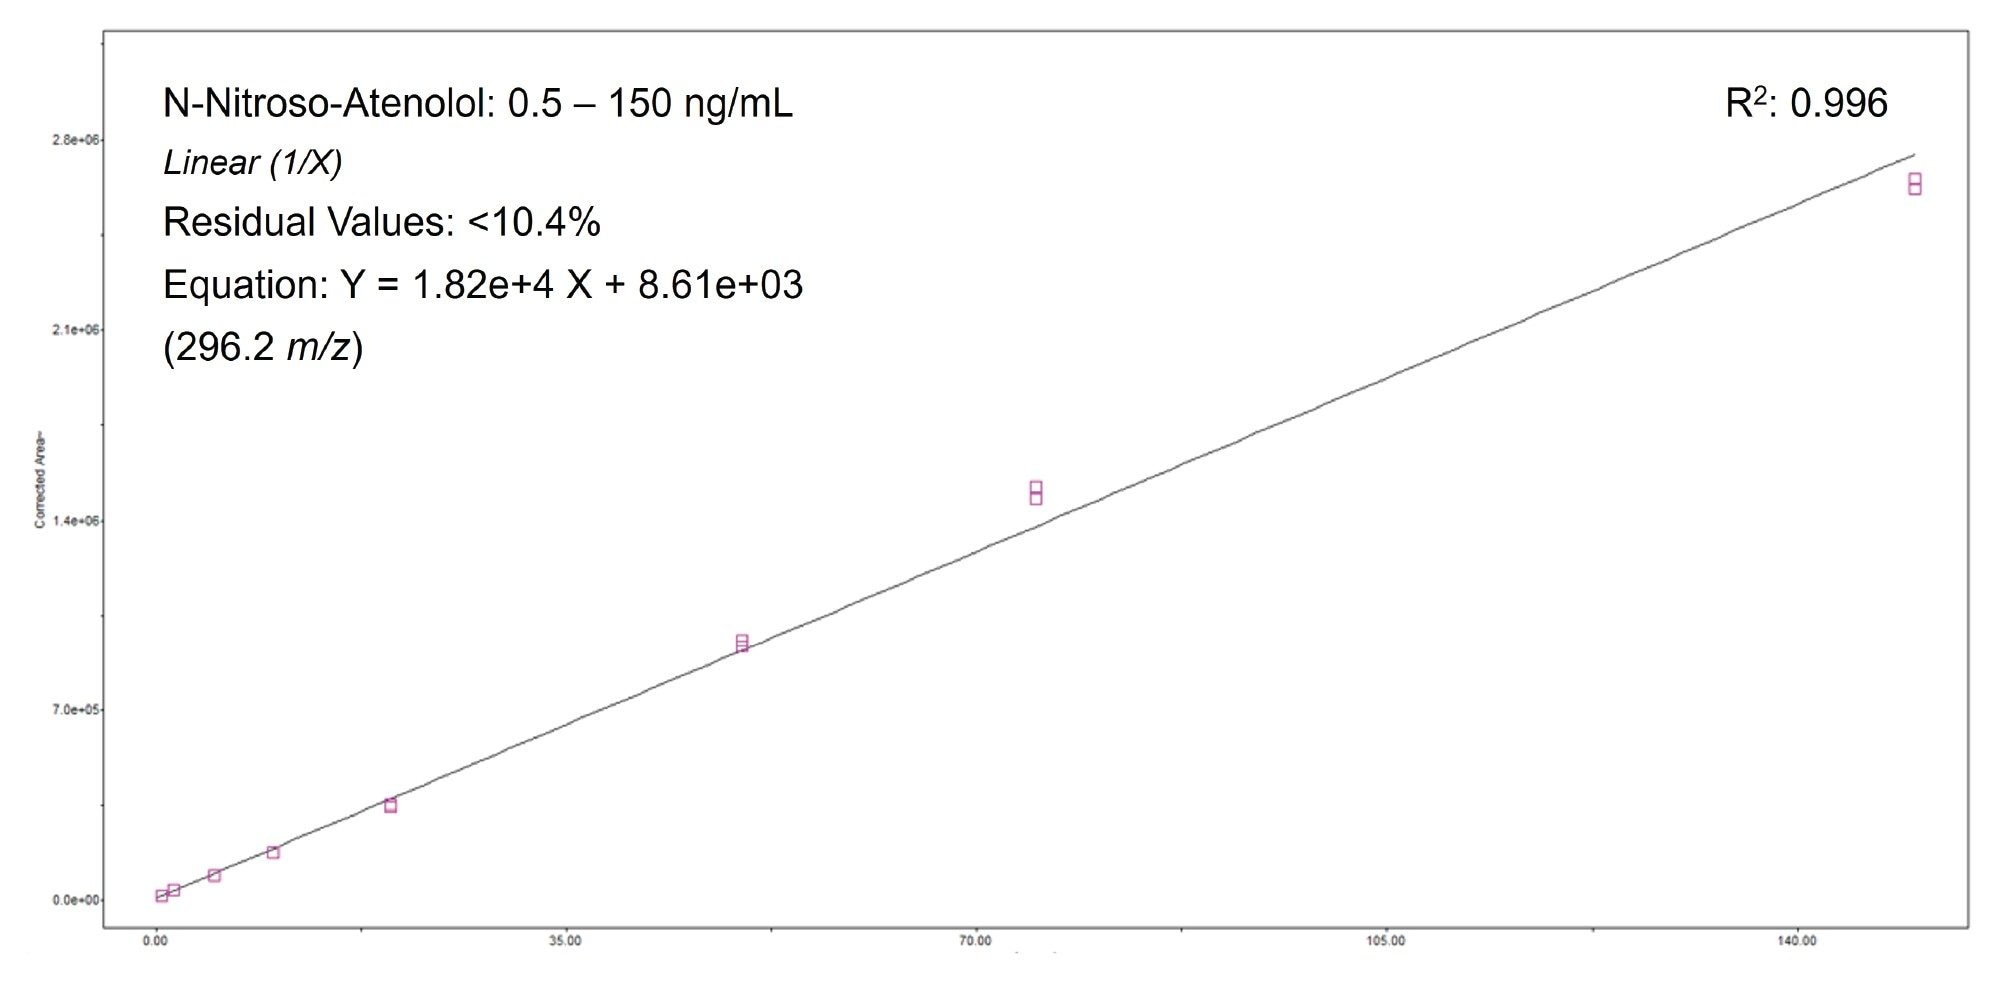
A bracketed calibration plot of N-nitroso-atenolol spiked into 0.5 mg/mL of drug substance (Atenolol reference standard) is shown in Figure 3. The compound was found to be linear (1/X weighted) over a range of 0.5–150 ng/mL (R2 = 0.996). Residual values, expressed as the percentage deviation of the back-calculated concentrations from their nominal values, did not exceed 10.4% across the calibration range. Trace levels of endogenous impurity were present in both the drug substance and drug product. As a result, when assessing linearity, a Corrected Area custom field formula was created using the Custom Fields tool within the Empower Software.
In accordance with the CPCA, the specification limit for N‑nitroso‑atenolol in drug product is calculated using the formula below:
Acceptable Intake / Maximum Daily Dose = Specification Limit
1500 (ng/day) / 100 (mg/day) = 15 ppm (AI/MDD)
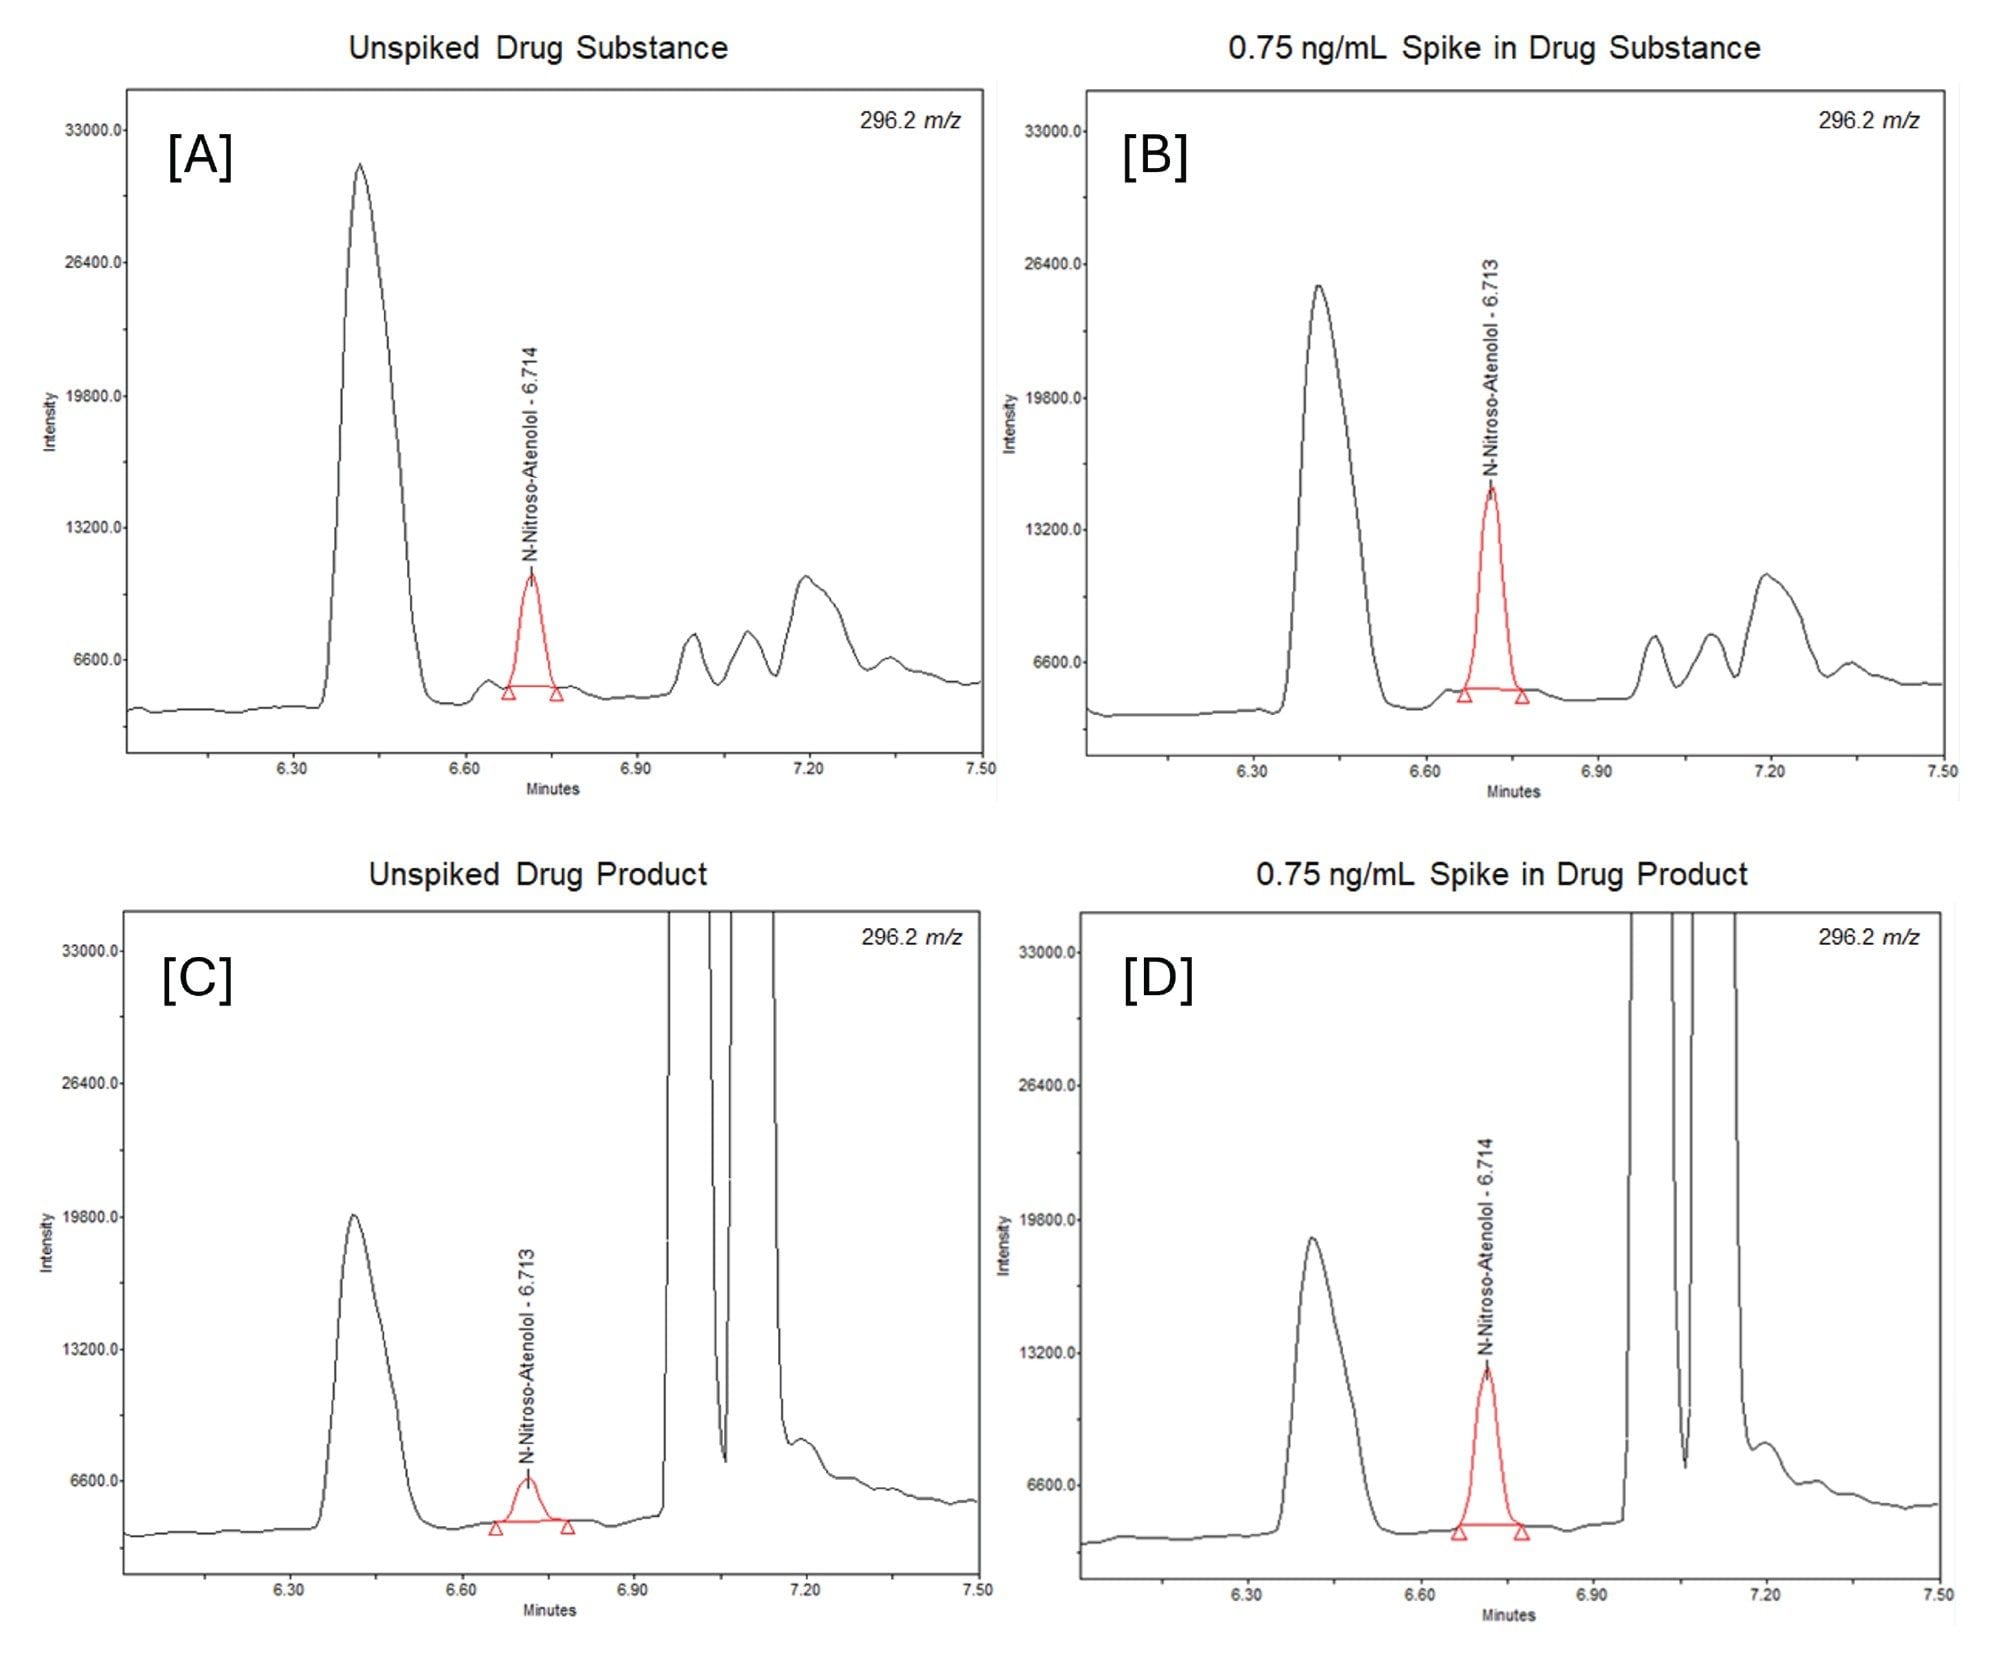
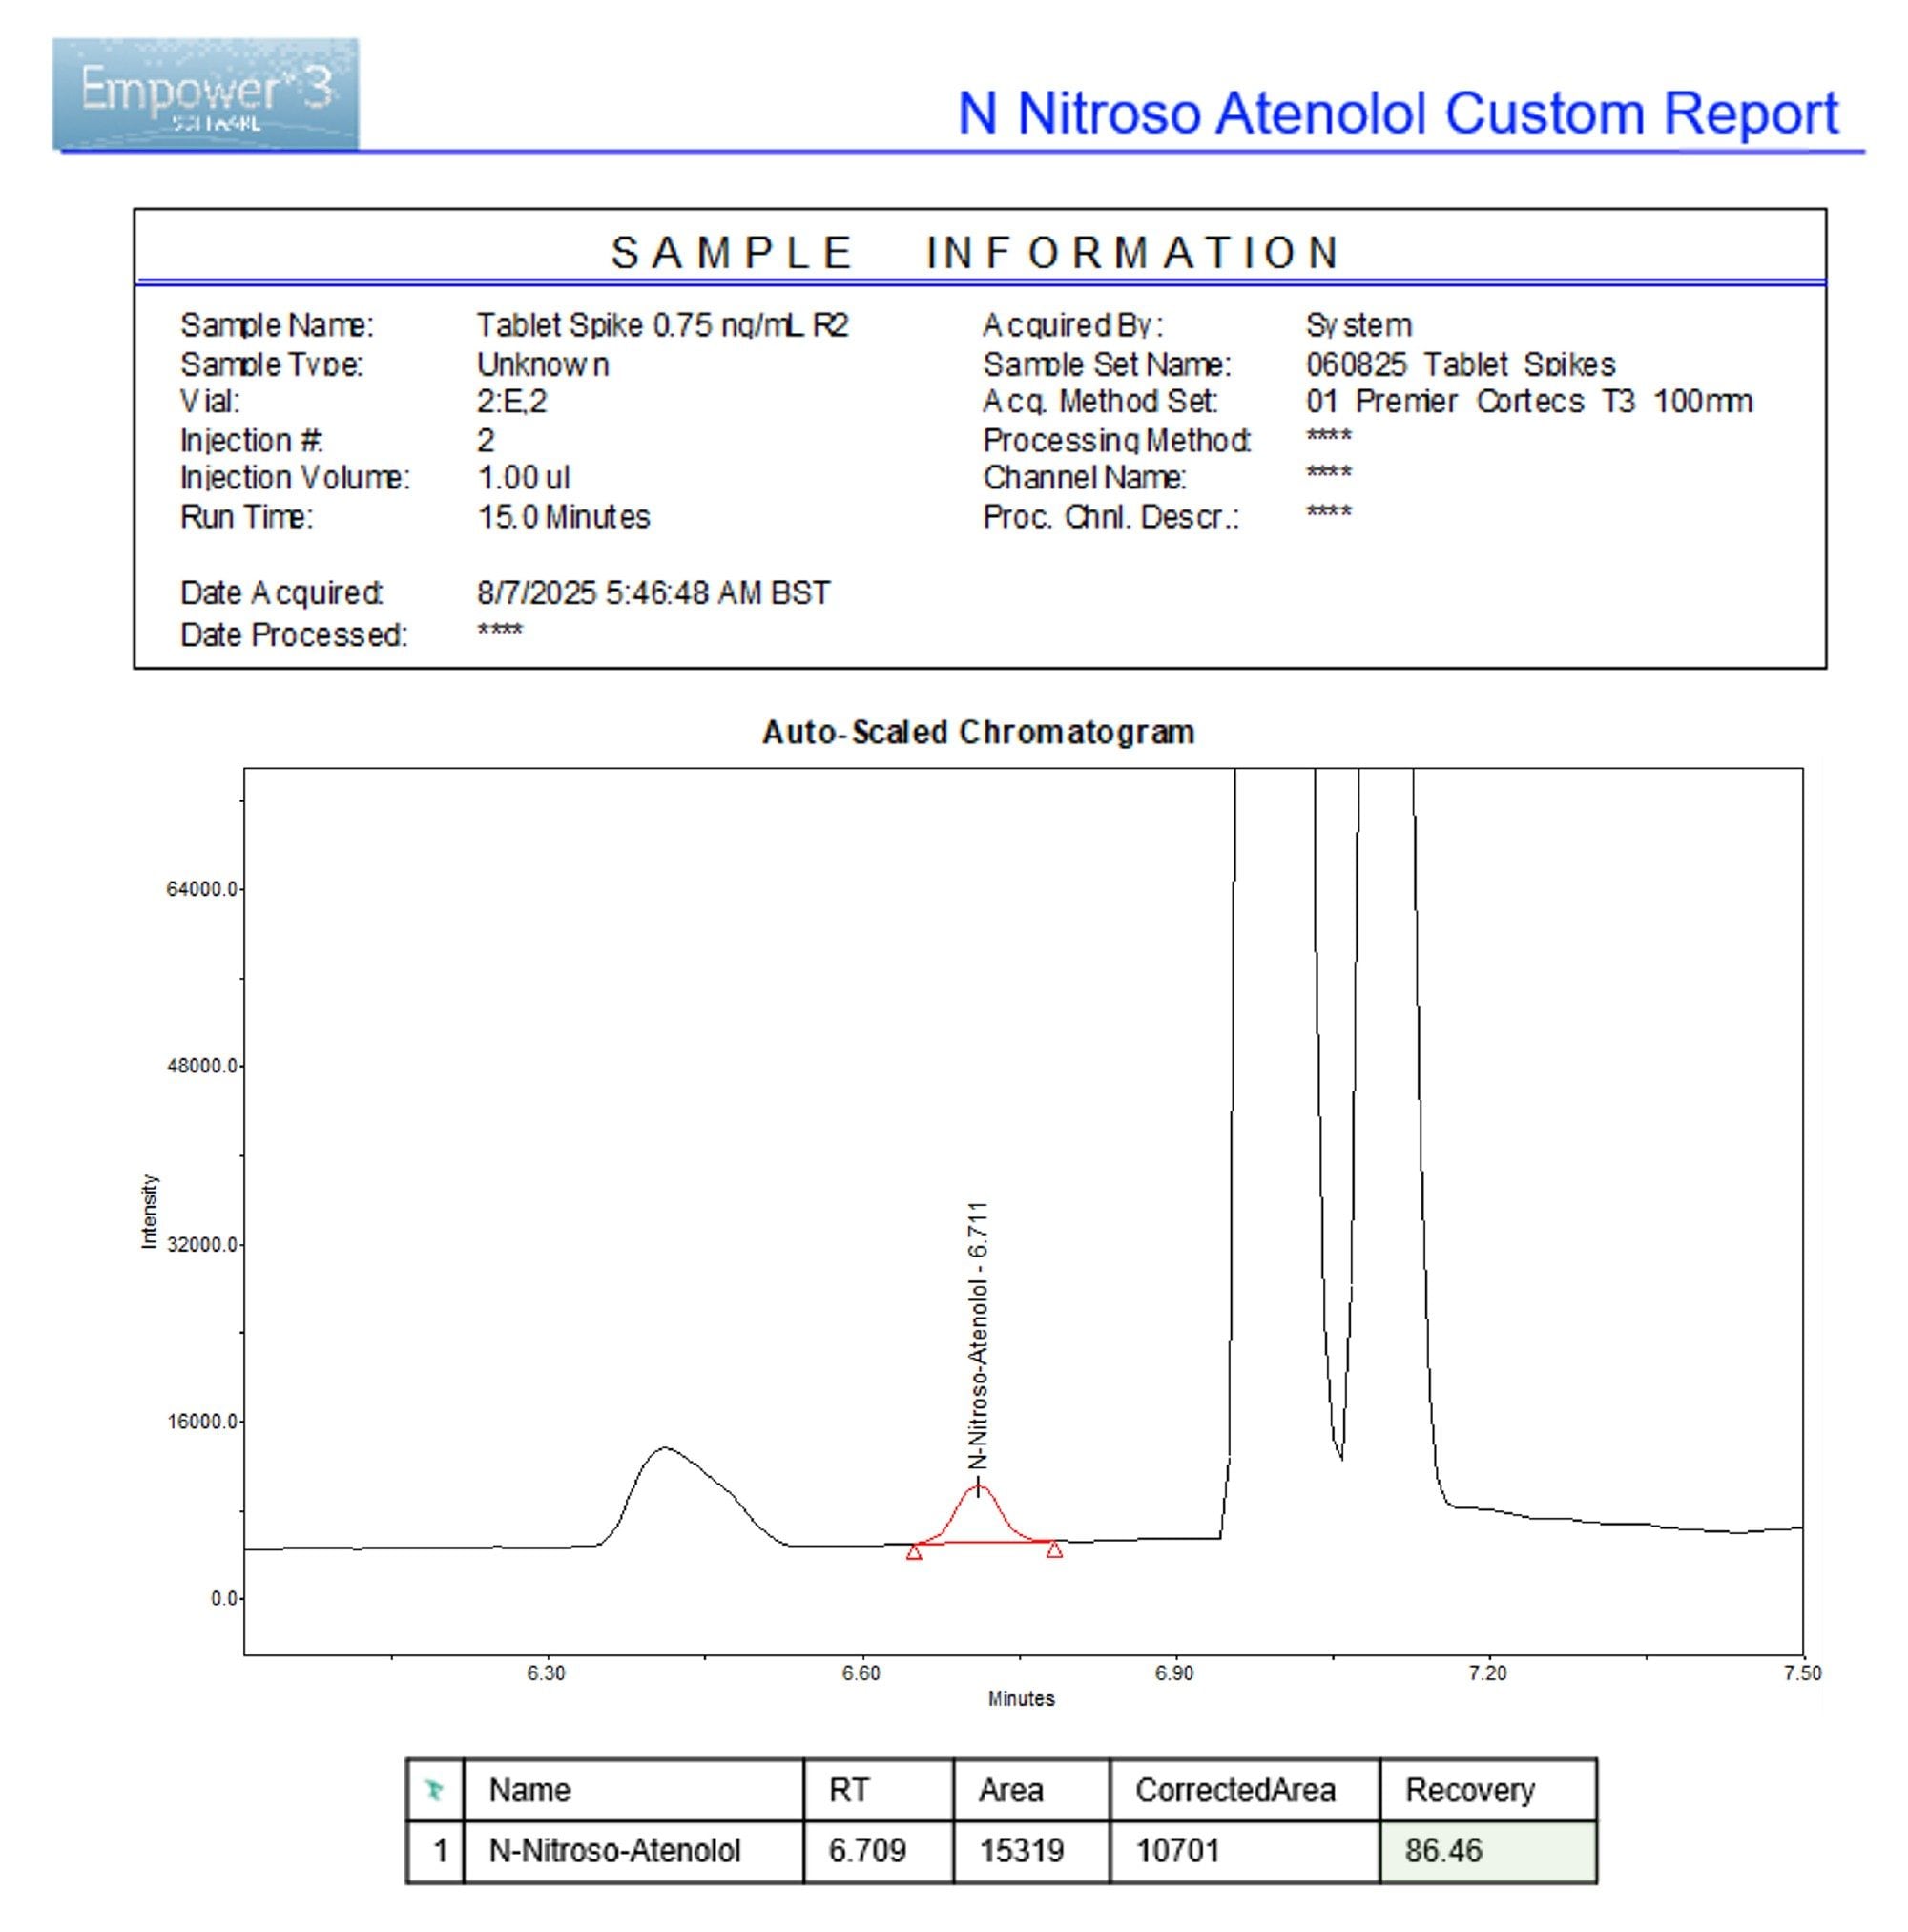
The N-nitroso impurity was spiked into both drug substance and drug product following the protocol detailed in Figure 1, at both the specification limit (15 ppm) and at 10% of the stated threshold (1.5 ppm). For a 0.5 mg/mL concentration of the API, spiking was performed at 7.5 ng/mL and 0.75 ng/mL, respectively. Example chromatography for the latter can be seen in Figure 4, alongside chromatograms of the unspiked drug product and drug substance.
Recovery Experiments
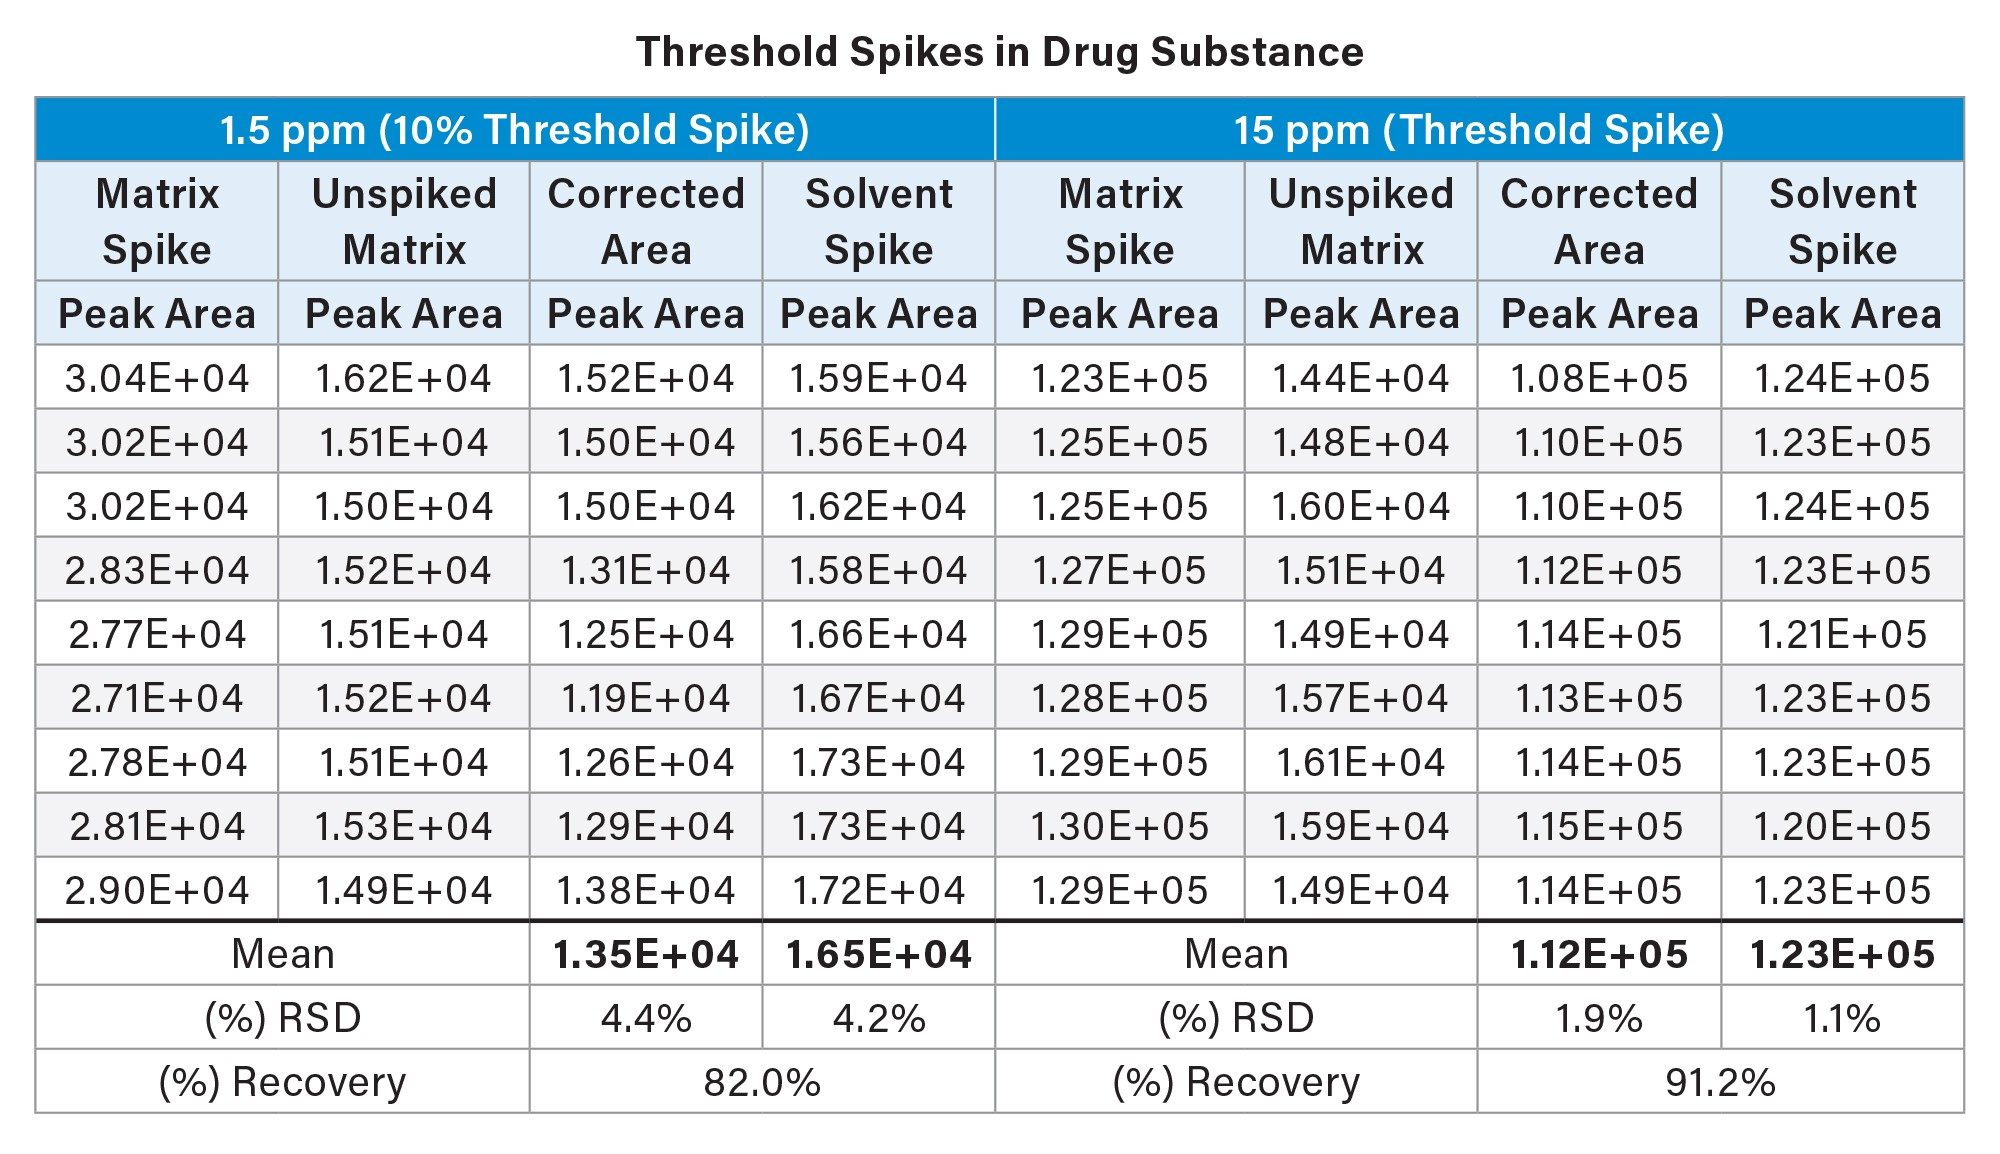
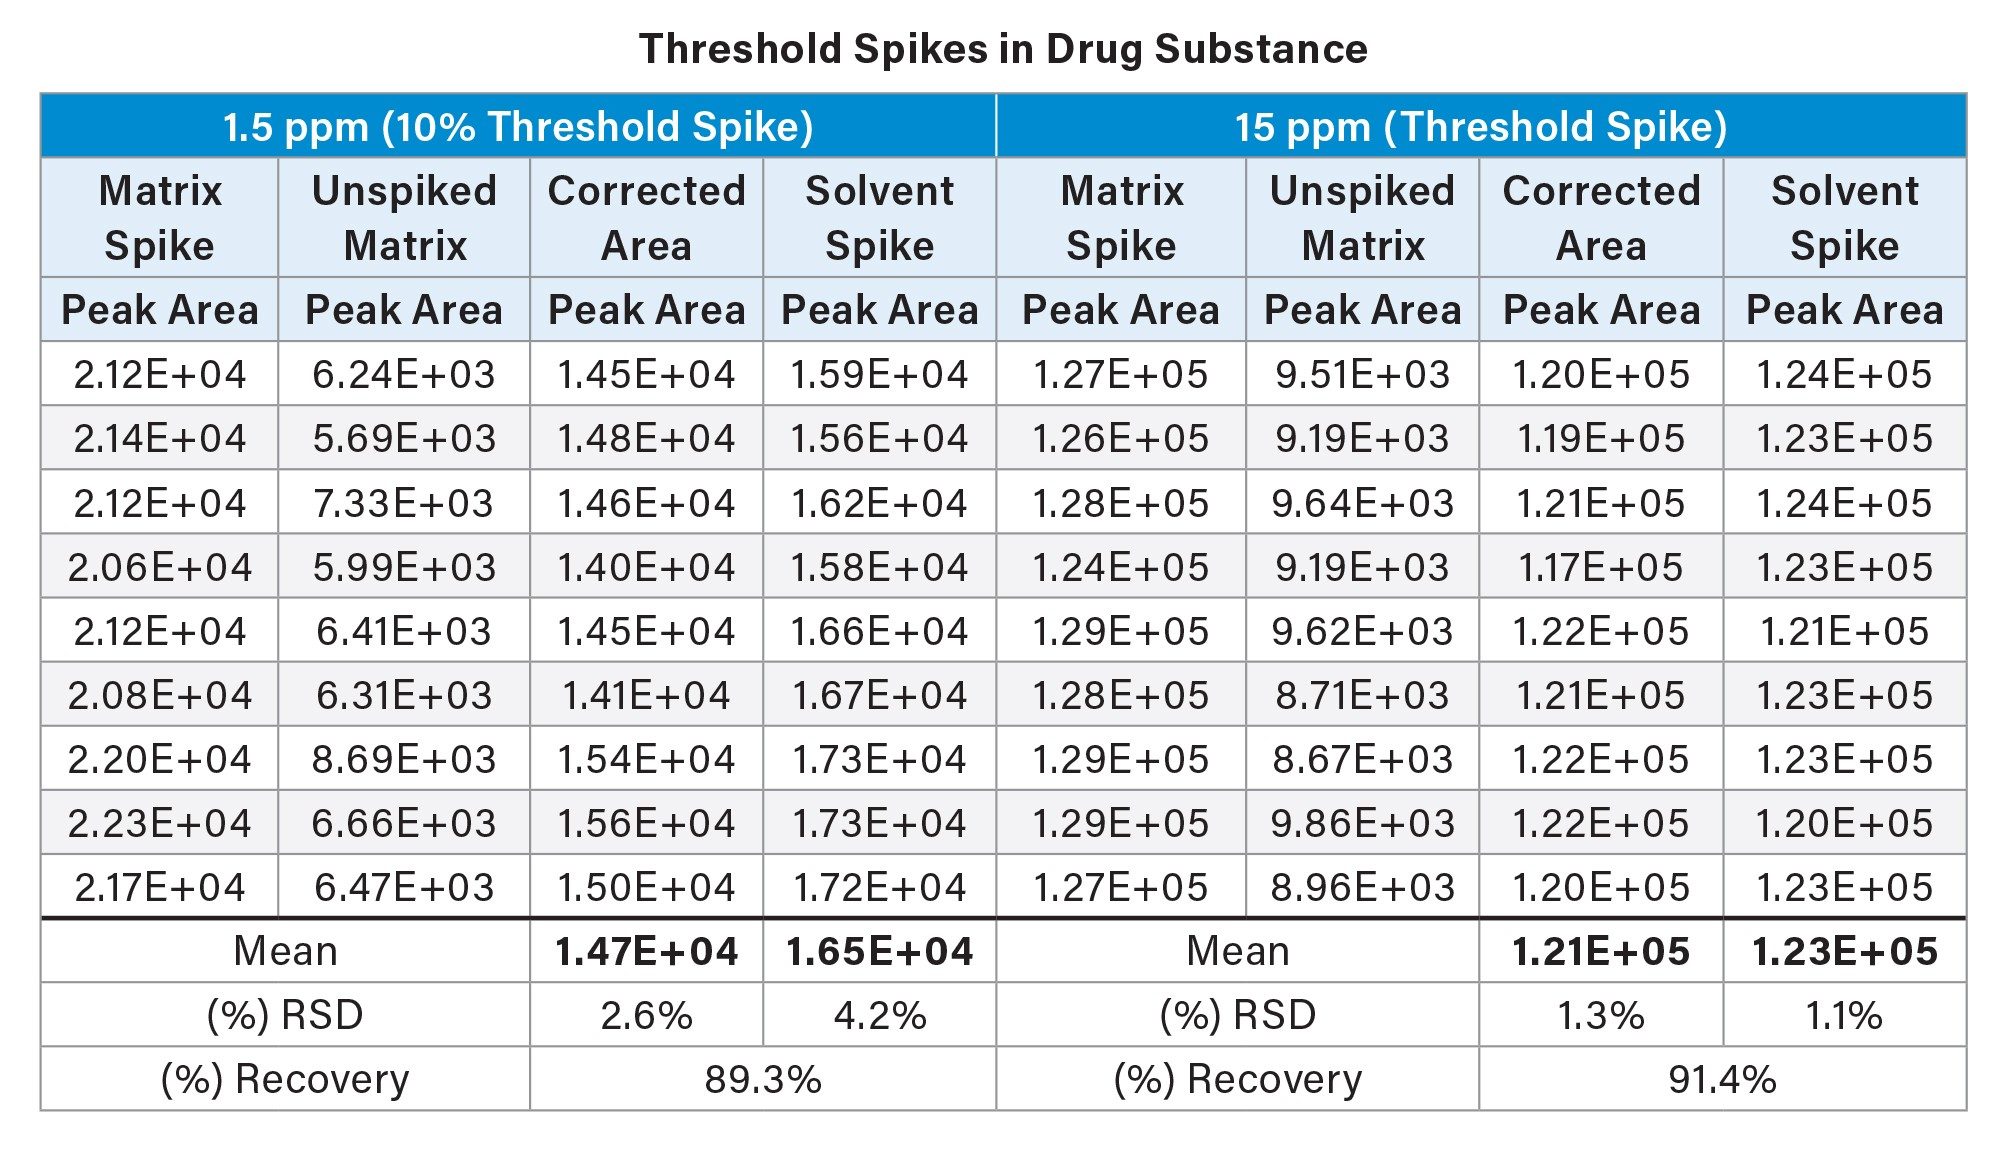
To assess recovery at both the 15 ppm and 1.5 ppm level, replicate spiked injections (n=9) in both matrix and solvent were performed, alongside unspiked matrix injections. This was performed in both drug substance and drug product, with the results detailed in Table 1 and Table 2, respectively.
To calculate recovery, the below calculation(s) were used:
%Recovery = ( Corrected Area [Mean] / Solvent Spike [Mean] ) x 100
Corrected Area = Matrix Spike [Peak Area] - Matrix Blank [Peak Area]
At the 15 ppm spiking level - the current specification limit for N-nitroso-atenolol - recoveries ranged from 87–96% in drug substance, and from 95–102% in drug product. Relative standard deviation (RSD) across corrected peak area was found to be 1.9% and 1.3% respectively, over (n=9) replicate injections. At the 1.5 ppm spiking level -10% of the reported specification limit - recoveries ranged from 71–96% in drug substance, and from 84–95% in drug product. Relative standard deviation across corrected peak area was found to be 4.4% and 2.6% respectively, as shown in Table 1 and Table 2.
The sensitivity of the ACQUITY QDa II Mass Detector meant that a lower concentration of drug formulation could be used as a final in-vial concentration, limiting baseline levels of endogenous impurity. Additionally, the method used in this workflow was optimised with a 1 µL injection, to limit high sample concentrations entering the MS source. This approach allowed for a robust and reliable quantitative approach, despite repeated injections of high-concentration tablet formulations containing multiple co-eluting excipients, such as polyethylene glycol, that were not excluded by the divert valve.
The reporting functionality within Empower CDS provides an efficient platform for data analysis and review in a regulated laboratory environment. Throughout this workflow, Empower custom reporting tools were used to rapidly assess analyte recovery at and below the specification limit, enabling data-driven decision-making that was both scientifically defensible and regulatory-compliant. The integrated reporting framework allows scientists to generate and review results directly within the validated CDS environment, supporting data integrity and compliance with regulatory expectations such as 21 CFR Part 11. An example of a custom report used in this workflow can be seen in Figure 5.
Degradation Study
To evaluate whether storage conditions influenced the formation of N-nitroso-atenolol, a small-scale degradation study was conducted. A blister pack of the drug product was placed on a windowsill for 30 days during the summer period, thereby exposing the tablets to ambient heat and ultraviolet (UV) stress. Following storage, the samples were processed according to the protocol described in Figure 1 and subsequently analyzed. The results, presented in Figure 6, indicated no significant change in the concentration of N-nitroso-atenolol (RT=6.72 minutes). However, a marked increase was observed in the peak area of an earlier-eluting component, designated as Peak A (RT=6.42 minutes).
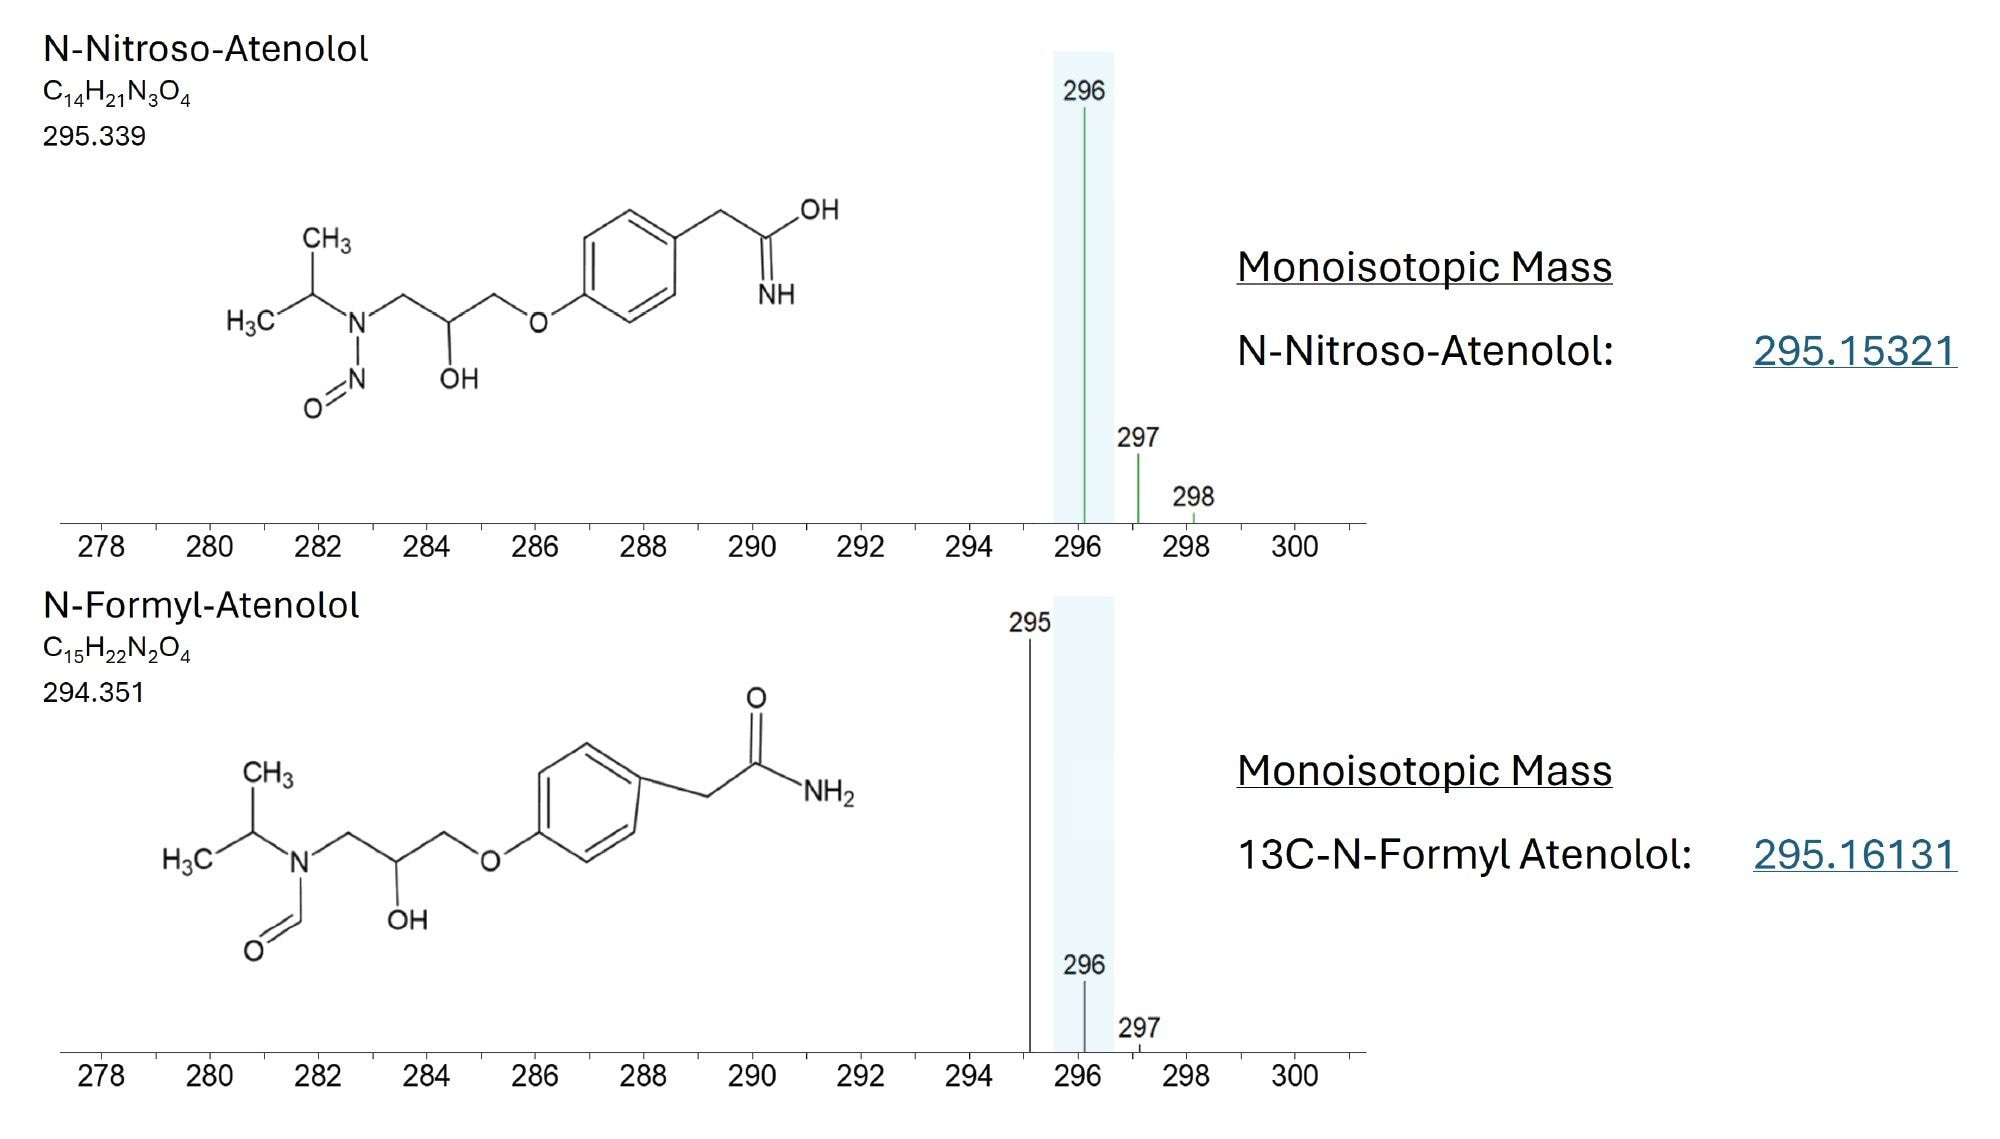
Preliminary investigation of Peak A via in-source fragmentation suggested that it may correspond to a 13C isotopic form of N-formyl-atenolol. To evaluate this, LGC Standards synthesised a custom reference standard of N-formyl-atenolol, which was analyzed under identical LC–MS conditions. The reference standard exhibited an equivalent retention time and in-source fragmentation profile to Peak A. Together, this supports the assignment of Peak A as 13-C-N-formyl-atenolol with a reasonable degree of confidence. A representative SIR chromatogram (m/z 296.2) of a 50 ng/mL N-formyl-atenolol standard is shown in Figure 6C. Increased abundance of N-formyl-atenolol following UV and thermal stress is consistent with atenolol undergoing oxidative or formylation pathways under these conditions. These stress factors are known to promote oxidation of secondary amines, providing a plausible route to formation of the N-formyl analogue.10
![Single ion recording (SIR) chromatograms (m/z 296) for [A] unspiked drug product [B] unspiked drug product analysed following a 30-day exposure to ambient UV and thermal stress [C] a 50 ng/mL solvent standard of N-formyl-atenolol](/content/dam/waters/en/app-notes/2025/720009167/720009167en-f6.jpg.82.resize/img.jpg)
In Figure 7, a structural comparison between N-nitroso-atenolol and N-formyl-atenolol is presented, with the monoisotopic mass of the 13C isotopic form indicated. The unit mass resolution of the ACQUITY QDa II Mass Detector is insufficient to distinguish these two species, therefore, chromatographic separation is essential.
In this study, effective chromatographic resolution enabled the clear separation and quantification of N-nitroso-atenolol. A robust LC–MS workflow, supported by in-source fragmentation, demonstrates that single-quadrupole instrumentation can serve not only as a sensitive platform for quantification, but also as a valuable tool for obtaining meaningful structural insights. This can help to facilitate efficient sample triage and help to reduce some analytical burden on tandem quadrupole and other resource-intensive high-resolution platforms.
Conclusion
This study presents a sensitive and cost-efficient UHPLC–MS method for quantifying N-nitroso-atenolol in both atenolol drug substance and drug product down to 1.5 ppm relative to the API (10% of the specification limit). Using the ACQUITY QDa II Mass Detector, the workflow achieves reliable detection at sub-ppb levels, with strong linearity and recovery across challenging pharmaceutical matrices. Effective chromatographic separation allows clear differentiation from structurally related impurities, supporting robust routine testing in alignment with regulatory limits for CPCA Category IV NDSRIs. Reference standards from LGC Standards provide reliable reference points, supporting confident detection and quantification of N-nitroso-atenolol. Integration with Empower CDS Software enables streamlined data analysis and review within a regulatory-compliant environment. Overall, this workflow demonstrates broader analytical accessibility by providing a practical and scalable approach for NDSRI testing in laboratories with limited access to advanced or resource-intensive mass spectrometric instrumentation.
References
- U.S. Food and Drug Administration (FDA) (2023). ‘FDA Guidance for Industry: Recommended Acceptable Intake Limits for Nitrosamine Drug Substance Related Impurities (NDSRIs)’. Available at: https://www.fda.gov/media/170794/download [Accessed 1st October 2025].
- U.S. Food and Drug Administration (FDA) (2023). ‘FDA updates and press announcements on Angiotensin II Receptor Blocker (ARB) recalls (Valsartan, Losartan, and Irbesartan)’. Available at: https://www.fda.gov/drugs/drug-safety-and-availability/fda-updates-and-press-announcements-angiotensin-ii-receptor-blocker-arb-recalls-valsartan-losartan [Accessed 1st October 2025].
- European Medicines Agency (EMA) (2021) ‘CHAMPIX (Varenicline)-Lots to Be Recalled Due to Presence of Impurity N-Nitroso-Varenicline’. Available at: https://www.ema.europa.eu/system/files/documents/dhpc/champix_varenicline_dhpc_and_communication_plan_en.pdf [Accessed 1st October 2025].
- Jireš, J. & Douša, M. (2022). ‘Nitrites as precursors of N-nitrosation in pharmaceutical samples – A trace level analysis’. Journal of Pharmaceutical and Biomedical Analysis., 213, p.114677. doi:10.1016/j.jpba.2022.114677.
- NCD Risk Factor Collaboration (NCD-RisC) (2021) ‘Worldwide trends in hypertension prevalence and progress in treatment and control from 1990 to 2019: a pooled analysis of 1201 population-representative studies with 104 million participants’., The Lancet, 398(10304), pp. 957–980. doi:10.1016/S0140-6736(21)01330-1.
- Kwon, S., Ahn, S.-H., Chang, Y., Park, J.-S., Cho, H. & Kim, J.-B. (2025). ‘Development and Validation of a Sensitive LC-MS/MS Method for the Determination of N-Nitroso-Atenolol in Atenolol-Based Pharmaceuticals’. Separations, 12(5), article 122. doi:10.3390/separations12050122.
- European Medicines Agency (EMA) (2025). ‘Appendix 1: Acceptable intakes established for N‑nitrosamines’. Available at: https://www.ema.europa.eu/en/documents/other/appendix-1-acceptable-intakes-established-n-nitrosamines_en.xlsx [Accessed 1st October 2025].
- Zheng, J. et al. (2024) ‘A practical HPLC-MS method for the analysis of nitrosamine drug substance related impurities using an inexpensive single quadrupole mass spectrometer.’, Journal of Chromatography A, 1736, p. 465399. doi:10.1016/j.chroma.2024.465399.
- Marian Twohig, Amy Bartlett, Padmakar Wagh. Quantitation of N-Nitroso-Propranolol in Drug Substance using LC-MS/MS. Waters Application Note. 720008171.
- Hoaglund Hyzer, C.S. et al. (2017) ‘Mechanistic studies of the N-formylation of Edivoxetine, a secondary amine-containing drug, in a solid oral dosage form.’, Journal of Pharmaceutical Sciences, 106(5), pp. 1218–1238. doi:10.1016/j.xphs.2017.01.026.
720009167, December 2025