High Sensitivity, High Throughput LC-MS Analysis of Eicosanoids Using the Xevo™ MRT QTof
Abstract
Prostaglandins (PGs) such as Prostaglandin E2 (PGE2), Prostaglandin D2 (PGD2), Prostaglandin F2α (PGF2α) and Thromboxane B2 (TXB2) exhibit a wide variety of physiological and pathophysiological functions manifested by pain, fever and allergic reactions. Using the Xevo MRT QTof coupled to UltraPerformance LCTM the dynamic ranges covering four orders of magnitude were achieved. Examples of detection limits include Leukotriene B4 (LTB4) the LOD and LOQs were <0.05 ng/mL (<0.00015 ng on column) and 0.1 ng/mL (0.0003 ng on column). For PGD2 the LOD and LOQs were 0.1 ng/mL (0.0003 ng on column) and 0.5 ng/mL (0.0015 ng on column). Triplicate injections show good reproducibility at low, middle, and high concentrations; peak area reproducibility CV <3.5% across replicate injections. Exceptional mass accuracy and resolution observed (example PGD2 (C20H32O5) theoretical m/z [M-H] equals 351.2770 m/z) mass error equals -0.05 ppm, resolution equals 69000 FWHM. RMS typically less than 1 ppm enabling confident identifications. The data processing is easily performed using waters_connect but third-party software such as Lipostar and Skyline are also applicable for added workflow flexibility.
Benefits
Xevo MRT QTof coupled to Ultra Performance LC offers a simple and robust acquisition strategy, providing high-quality, comprehensive data quickly and efficiently. The Xevo MRT MS has key features that make it ideal for researchers in metabolomics and lipidomics especially when high levels of sensitivity, mass accuracy and mass resolution need to be combined with high-throughput methods
- Compact footprint for lab efficiency
- High resolution/scan speed
- High sensitivity
- High linear dynamic range
- Excellent mass accuracy
Introduction
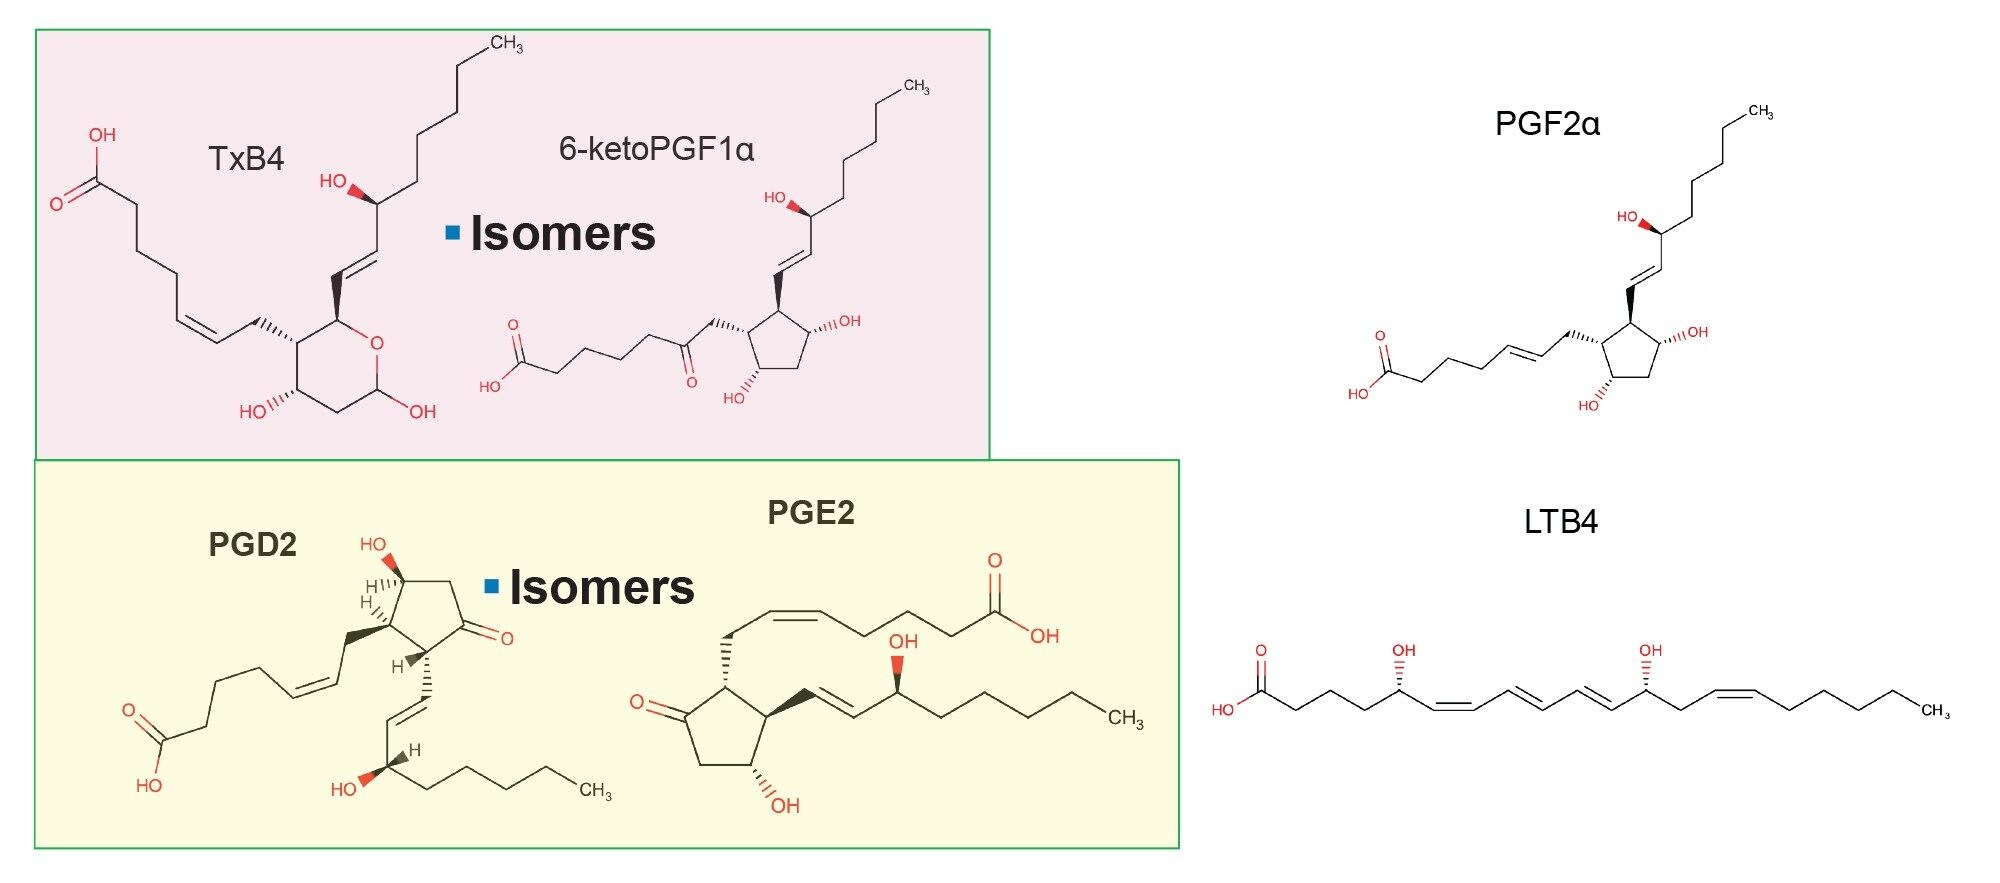
Studies have shown that inflammatory pain can be characterized by release of lipid mediators from the cyclooxygenase (COX) pathway such as endocannabinoids, prostaglandins (PGs), thromboxanes, leukotrienes, among others from peripheral as well as central nervous system tissues such as brain and spinal cord.1 Prostaglandins such as PGE2, PGD2, PGF2α, and Thromboxane B2 (TXB2) exhibit a wide variety of physiological and pathophysiological functions manifested by pain, fever, and allergic reactions.2 Monitoring dynamic changes of circulating levels of COX eicosanoids is complicated by the high occurrence of isomeric variants and their low abundance in biological samples.3 Structures of common eicosanoids are shown in Figure 1.
Analysis of these lipids has previously been performed using radiometric and enzymatic immunoassays, but these methods lack selectivity so target a limited number of compounds.4 Gas chromatography (GC-MS) methods have also been used but require complex procedures involving derivatization. Most recently a combination of liquid chromatography (LC) and tandem quadrupole mass spectrometry (MS) have been used. Schmidt et al., 2005 validated an LC–MS/MS method for quantifying PGE2 and PGD2 in rat microdialysis samples with LLOQ of 25 pg/mL and 50 pg/mL, respectively.5 Likewise, PGE2 and PGD2 were measured using a validated method from more recent studies which quantified LTB4 in human plasma or sputum specimens where their limits of quantitation were 0.2 ng/mL and 0.078 ng/mL in microglial cells.6
Here we show the key benefits of using UltraPerformance LC (UPLC™) combined with the Xevo MRT Mass Spectrometer. Due to the improved sensitivity and high dynamic range of the mass spectrometer, a streamlined workflow of data acquisition and analysis was developed to achieve tandem quadrupole levels of sensitivity with the added benefit of high mass accuracy and mass resolution. For added flexibility, the data can also be analyzed using third party software such as Lipostar 2 or Skyline.7
Experimental
Sample Preparation
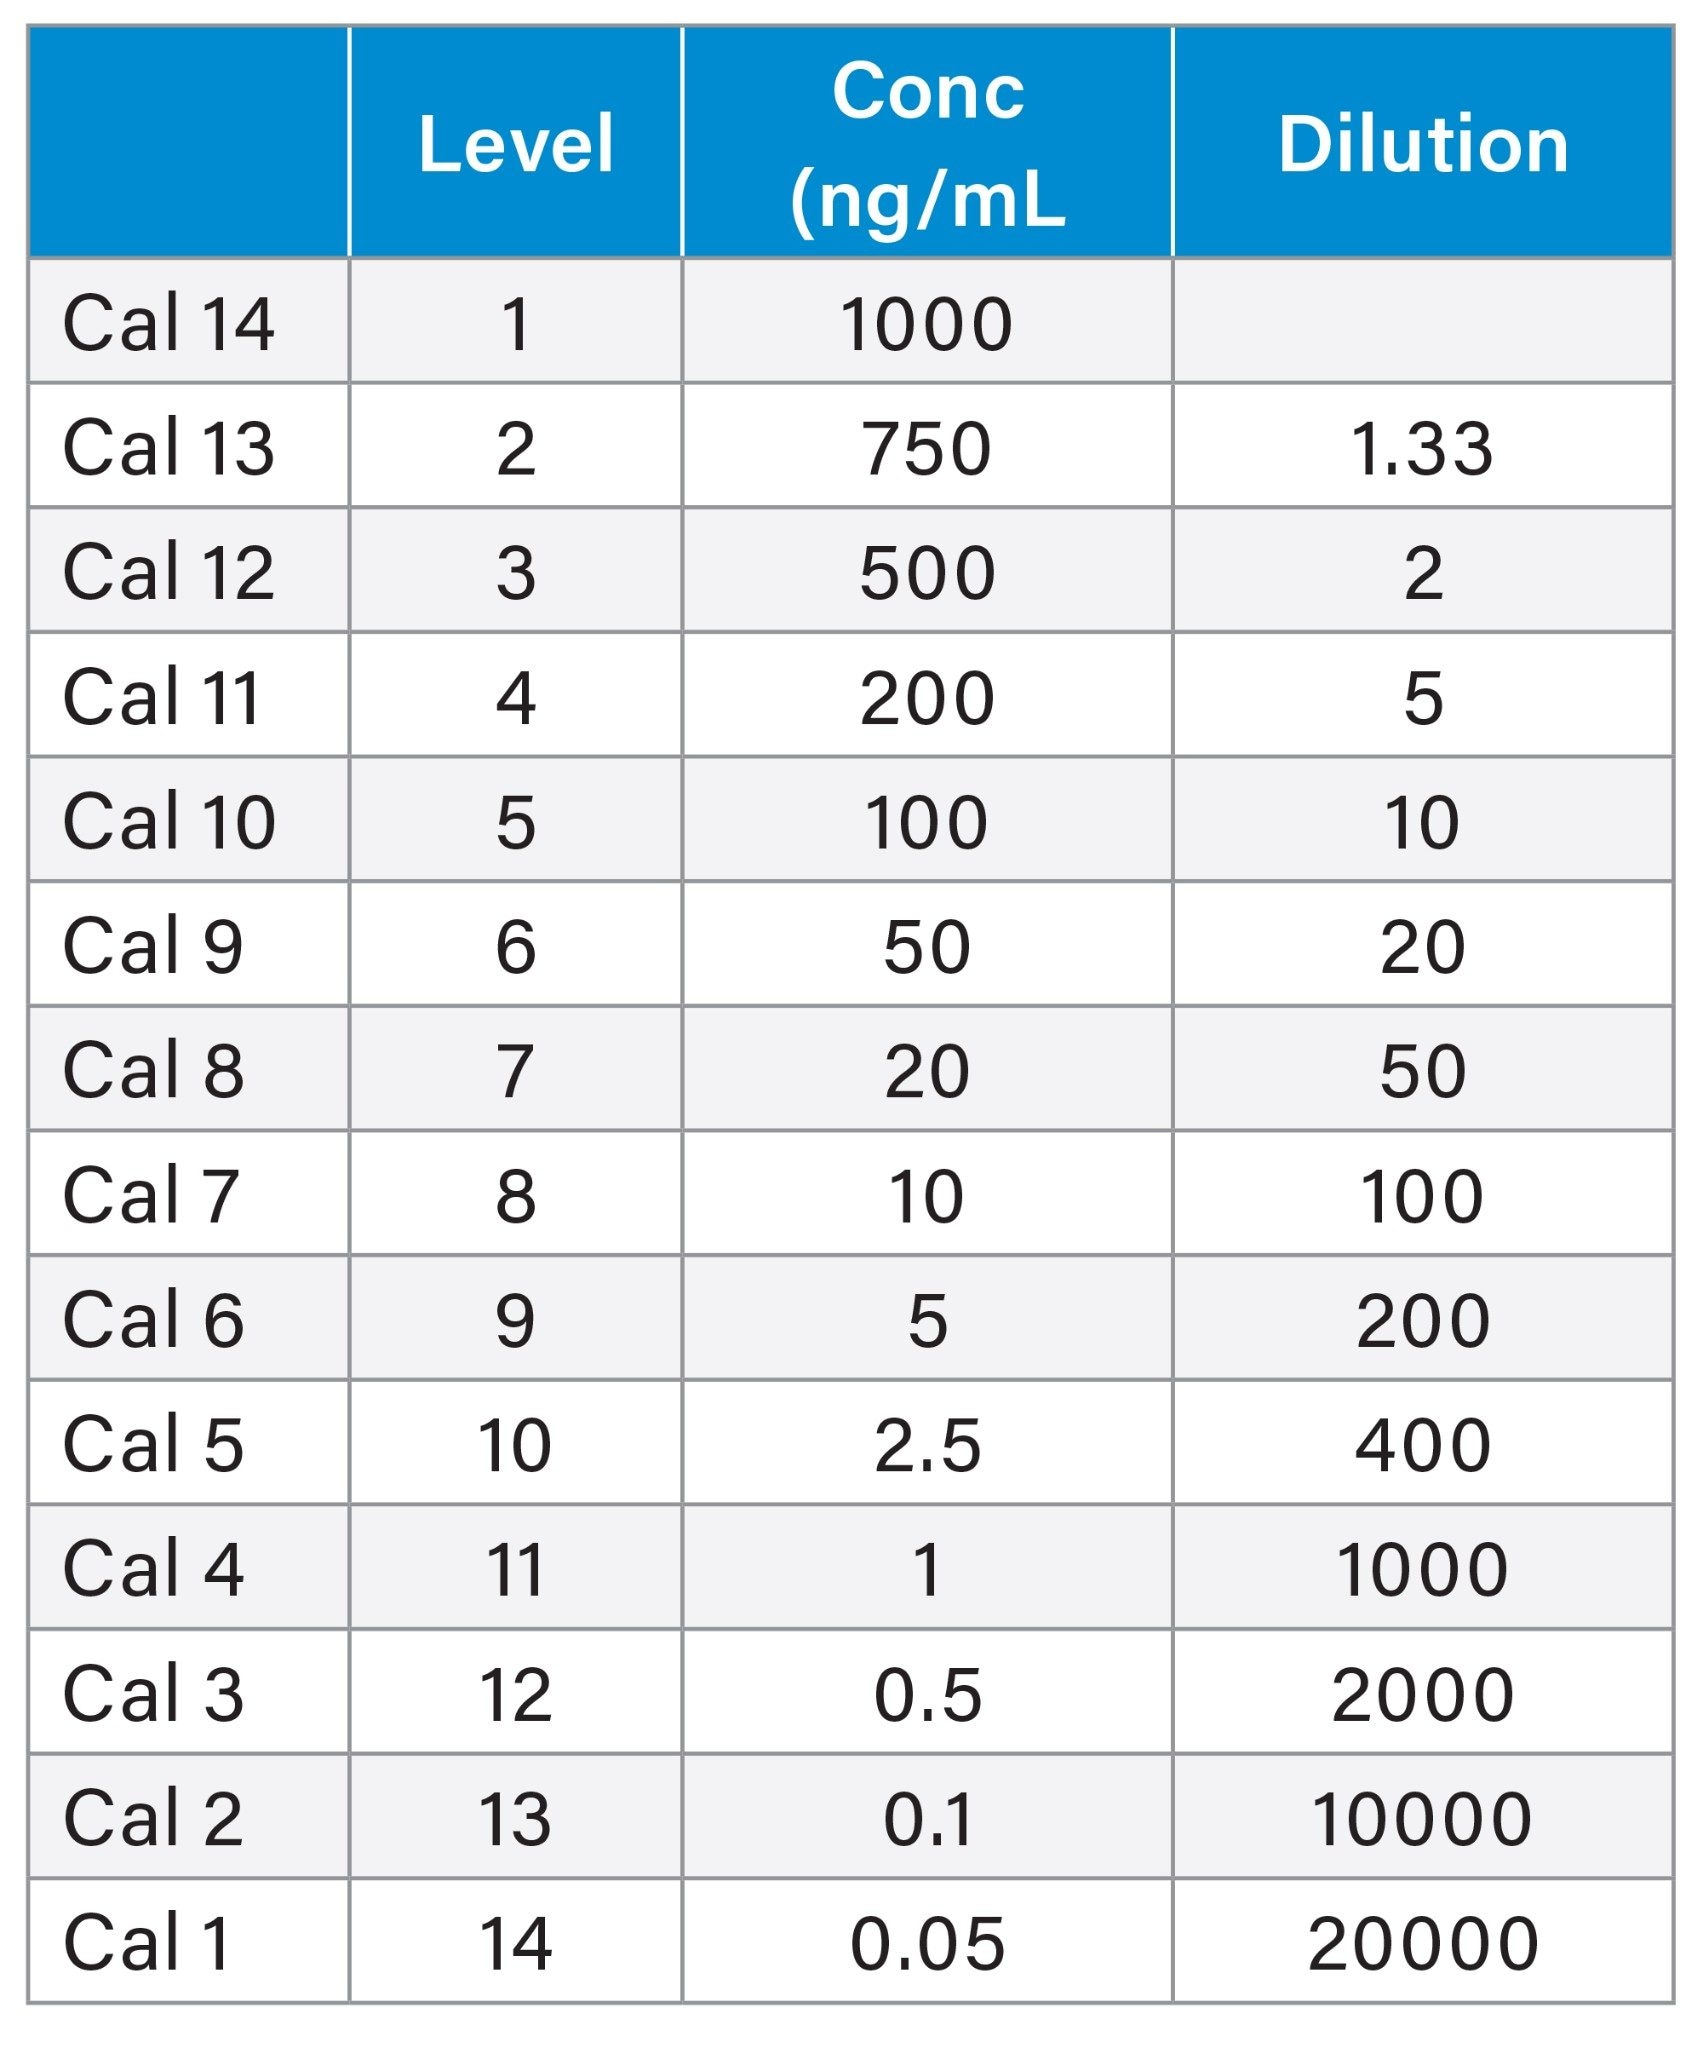
Using a 1000 ng/mL mix containing LTB4, PGF2α, PGE2, PGD2, 6-Keto-prostaglandin F1a (6-ketoPGF1α) and TxB2 (Caymans Chemicals, Ann Arbor, MI, US) a 14-point calibration curve from 1000 ng/mL to 0.05 ng/mL in methanol was produced as shown below.
Sample Prep Table
LC Conditions
|
LC system: |
ACQUITY Premier Flow Through Needle (FTN) UltraPerformance LC |
|
Vials: |
Certified Glass Screw Neck Max Recovery Vials (p/n: 186000326c) |
|
Column(s): |
CORTECS™ T3 Column, 120 Å, 1.6 µm, 2.1 mm x 50 mm, 1/pk - p/n: 186008497 |
|
Column temperature: |
35 °C |
|
Sample temperature: |
8 °C |
|
Injection volume: |
3 µL (ESI-) |
|
Flow rate: |
0.6 mL/min |
|
Mobile phase A: |
Water 0.01% Formic Acid |
|
Mobile phase B: |
Acetonitrile 0.01% Formic Acid |
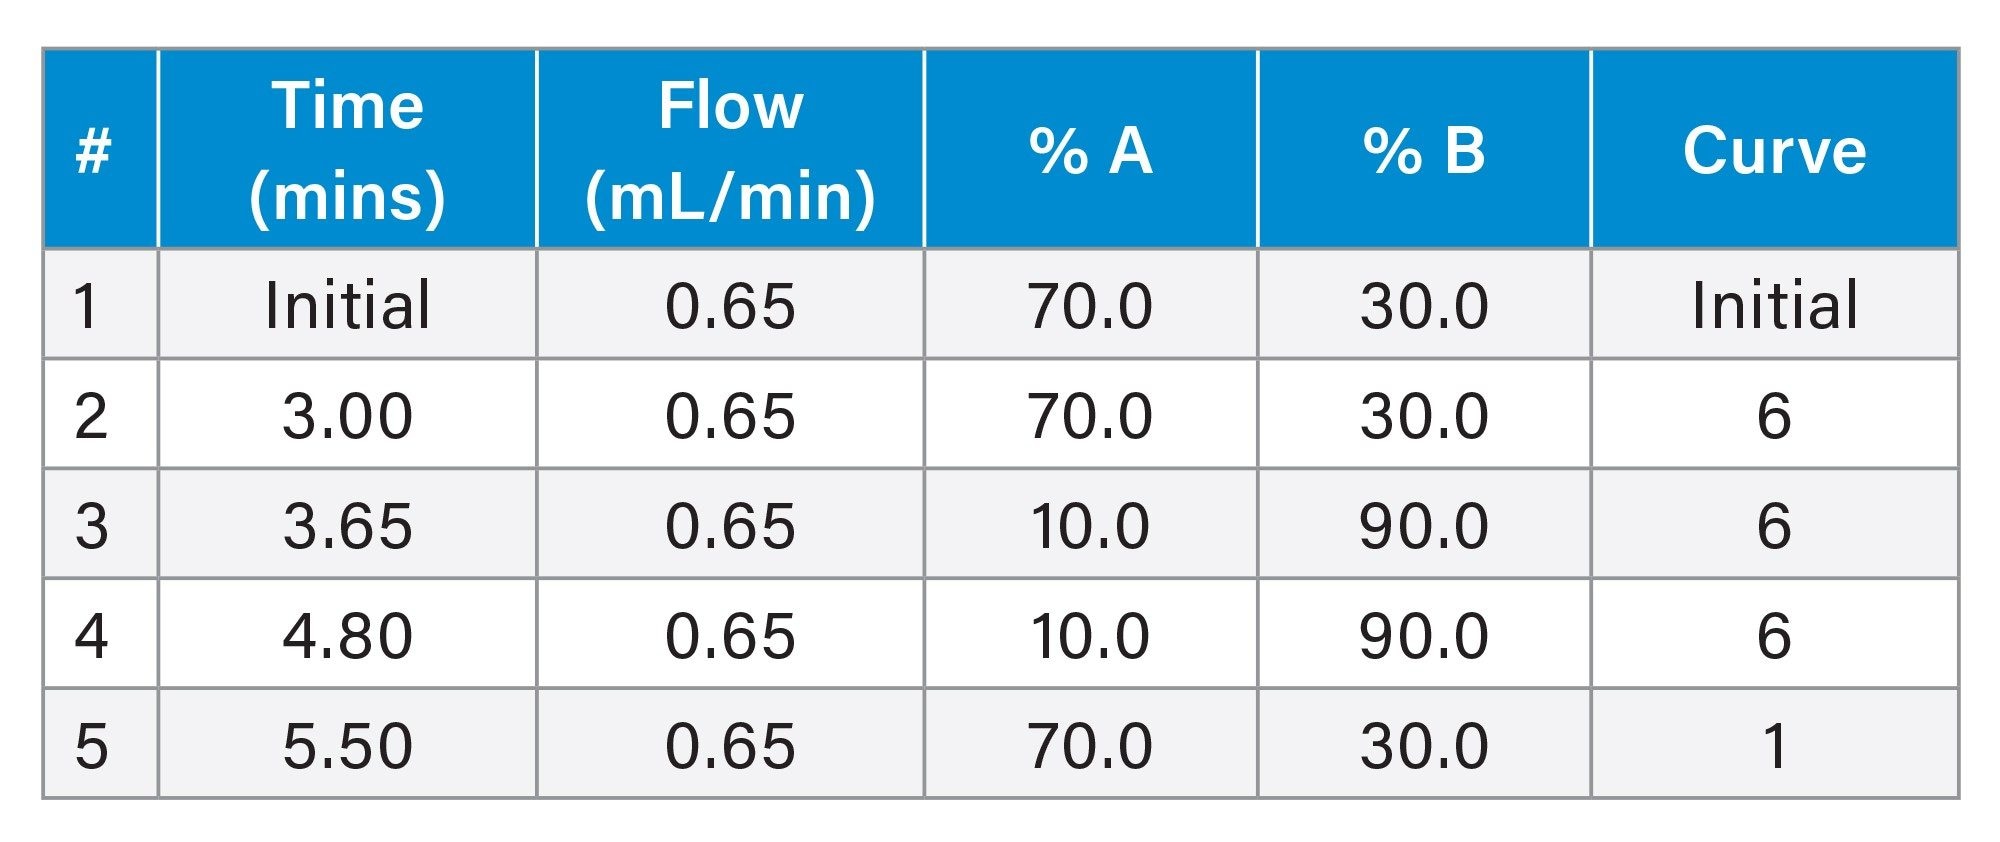
Gradient Table
MS source settings
|
Variable: |
Description (negative) |
|
Capillary voltage: |
2.0 kV |
|
Sampling cone: |
30 |
|
Source offset: |
30 |
|
Source temperature: |
120 °C |
|
Desolvation temperature: |
650 °C |
|
Cone gas flow: |
50 L/hr |
|
Desolvation flow: |
600 L/hr |
|
Lockspray flow: |
10 µl/min |
TOF settings
|
Variable: |
Description |
|
Experiment type: |
ToF MSe |
|
Scan rate: |
10 Hz |
|
Mass range: |
50–1200 Da |
|
Data format: |
Continuum |
|
Collision energy: |
30–40 eV |
|
Lockspray settings: |
Single Mode Ref m/z 554.26202 1.5 minute intervals, sample time 0.30 seconds, Capillary voltage 2.5 kV, Cone voltage 30 V |
Informatics
Data were collected and processed using waters_connect™. mzML files were then used to transfer to Lipostar 2 software (Mass Analytica, Barcelona, Spain) and Skyline (MacCoss Lab Software, University of Washington).
Results and Discussion
Detection Limits and dynamic response
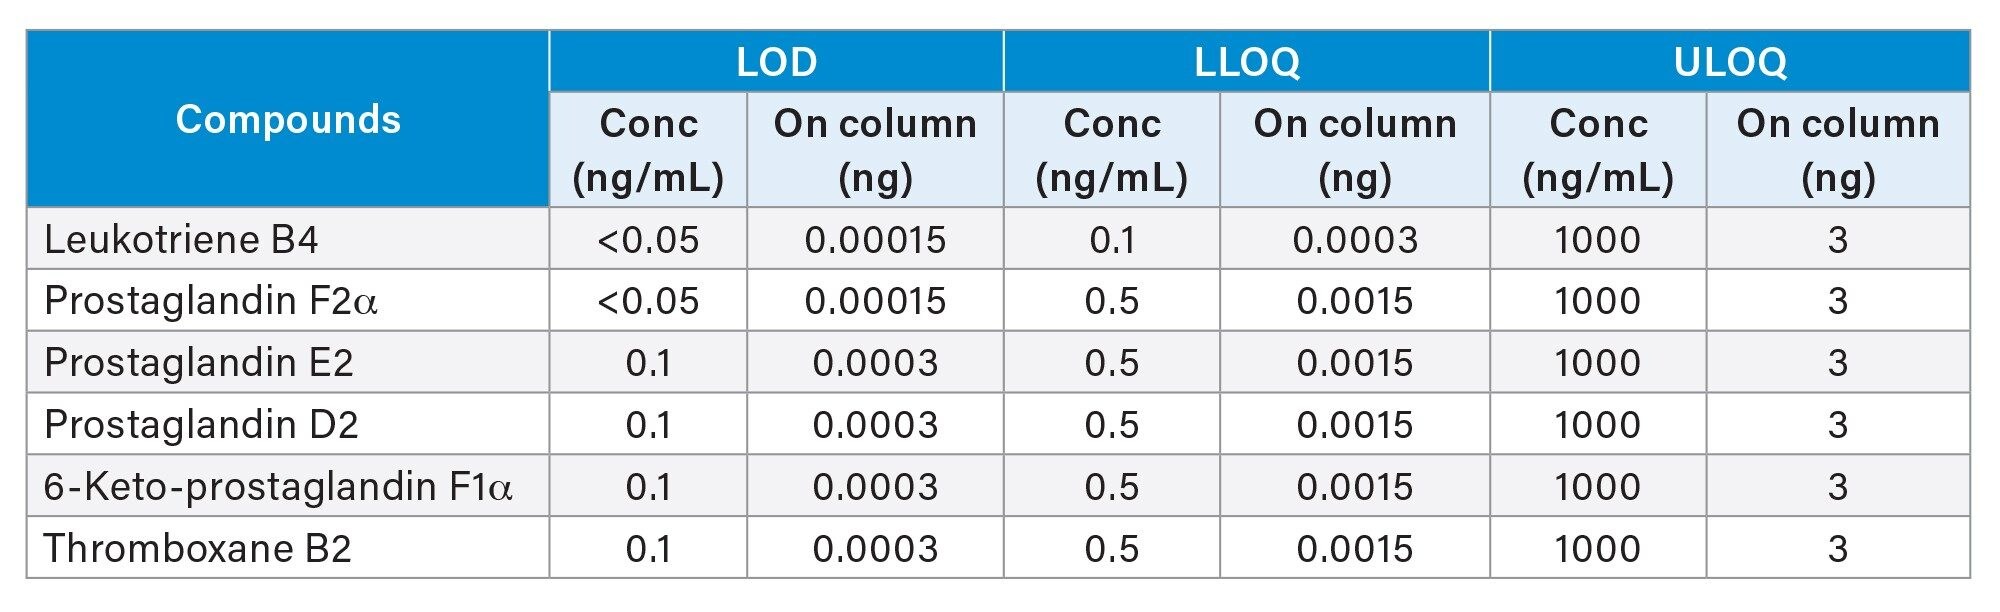
For this study the Limit of Detection (LOD) is defined as a peak with a signal to noise ratio> three while the Lower Limit of Quantification (LLOQ) is defined as a peak with a signal to noise ratio> ten and where the analyte response is reproducible and linear.8 The Upper Limit of Quantification (ULOQ) is defined as the highest calibration standard on the calibration curve. The results of these experiments show excellent sensitivity (sub 1pg on column) LODs and high linear dynamic range. Figure 2 shows an example of the data generated for Leukotriene B4 (LBT4). The LODs are confirmed based on none of the target m/z signals being extracted from in the blanks.
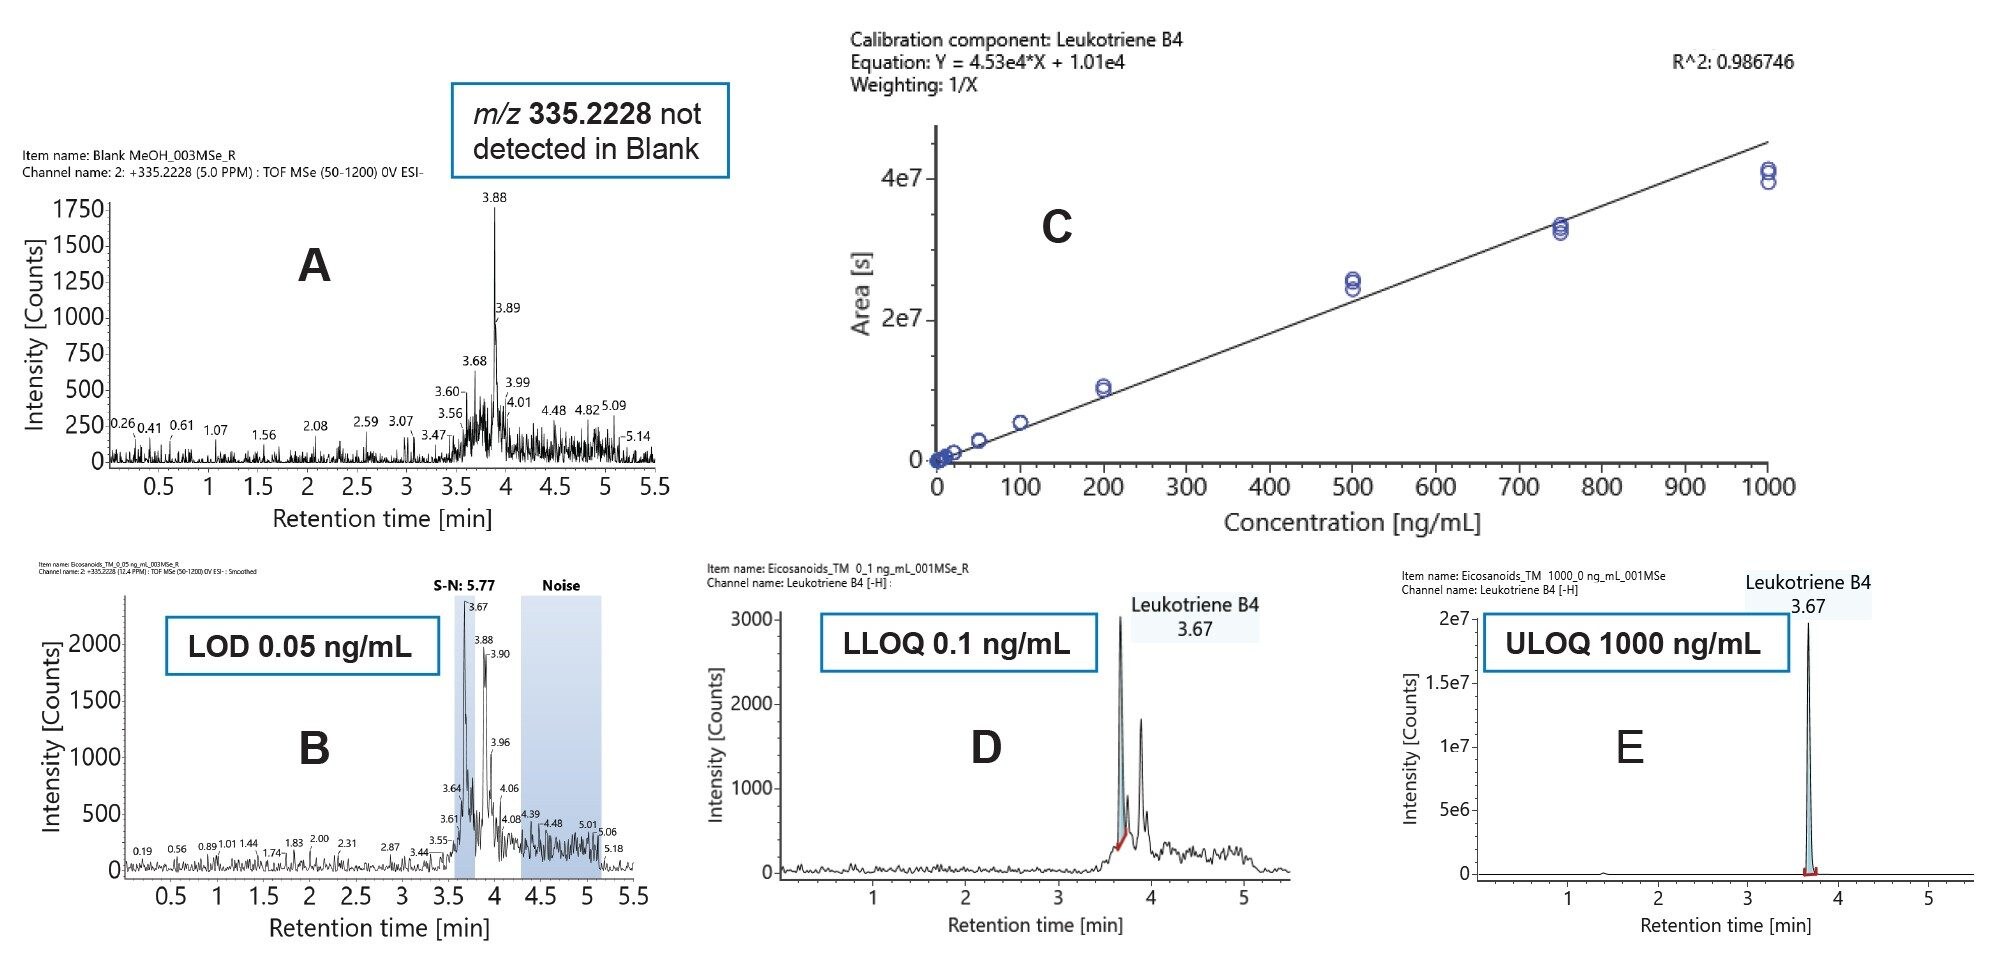
The results of detection limits for all the compounds are summarized in Table 1. The results also include the on-column values for detection limits for comparison with methods using different injection volumes.
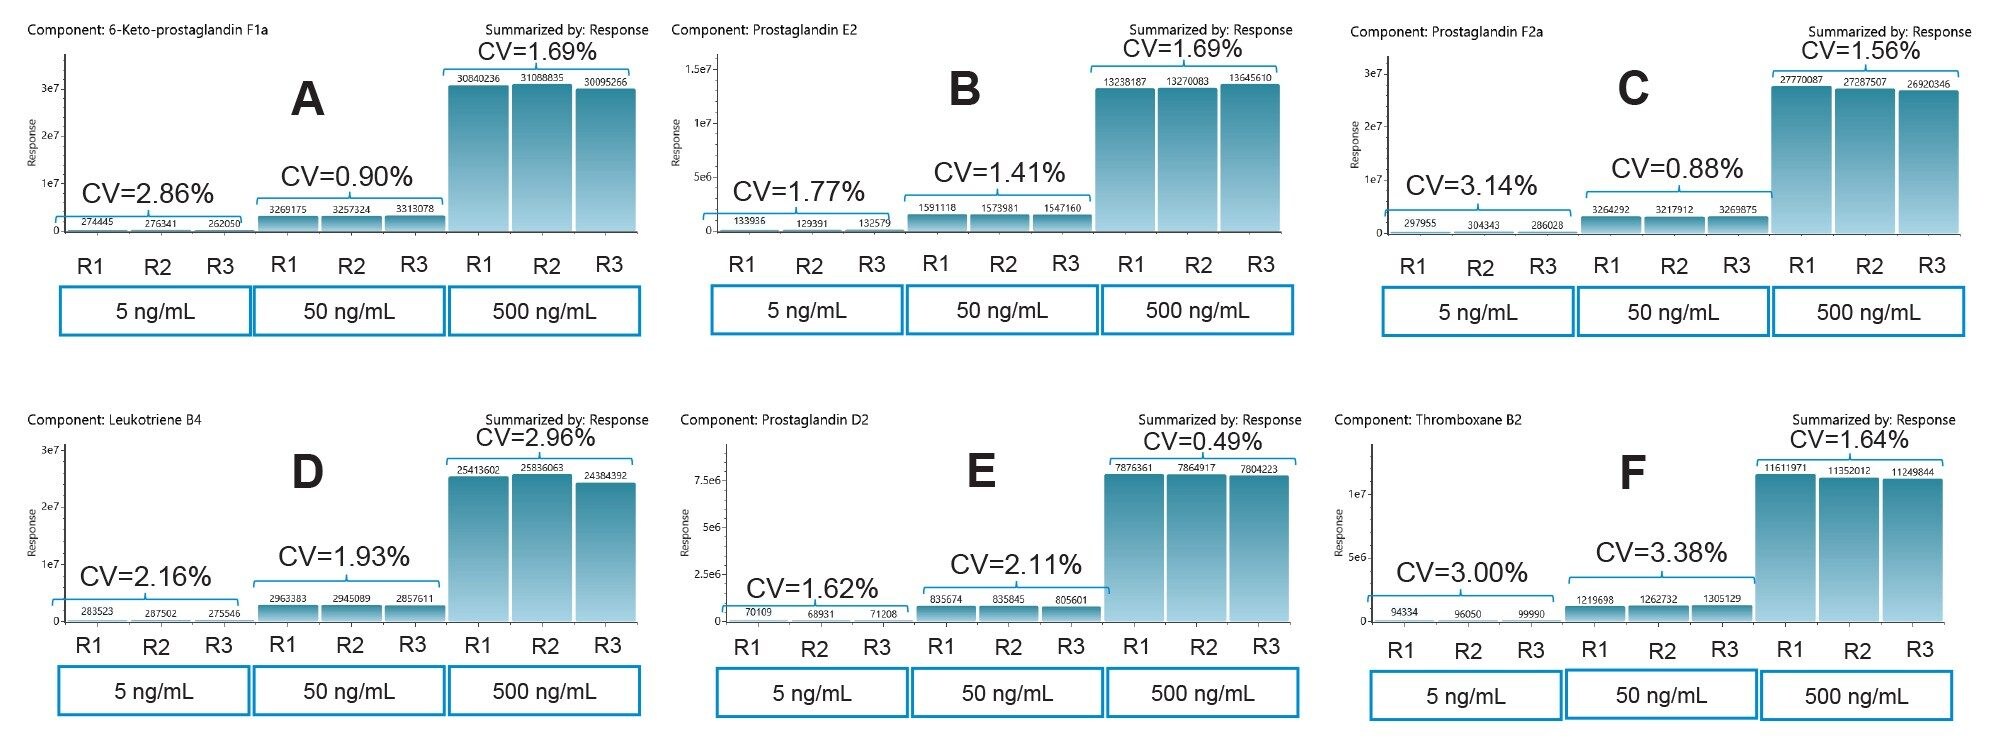
Precision Peak Area
The method used here showed good precision over triplicate injections for low (5 ng/mL), mid (50 ng/mL), and high (500 ng/mL) concentration sample using 3 µL injections. The CVs were all than 3.5%. Figure 3 shows the response and the CVs of 6-keto PGF1α, PGE2, PGF2α, LTB4, PGD2, and TXB2.
Resolution/ Mass accuracy
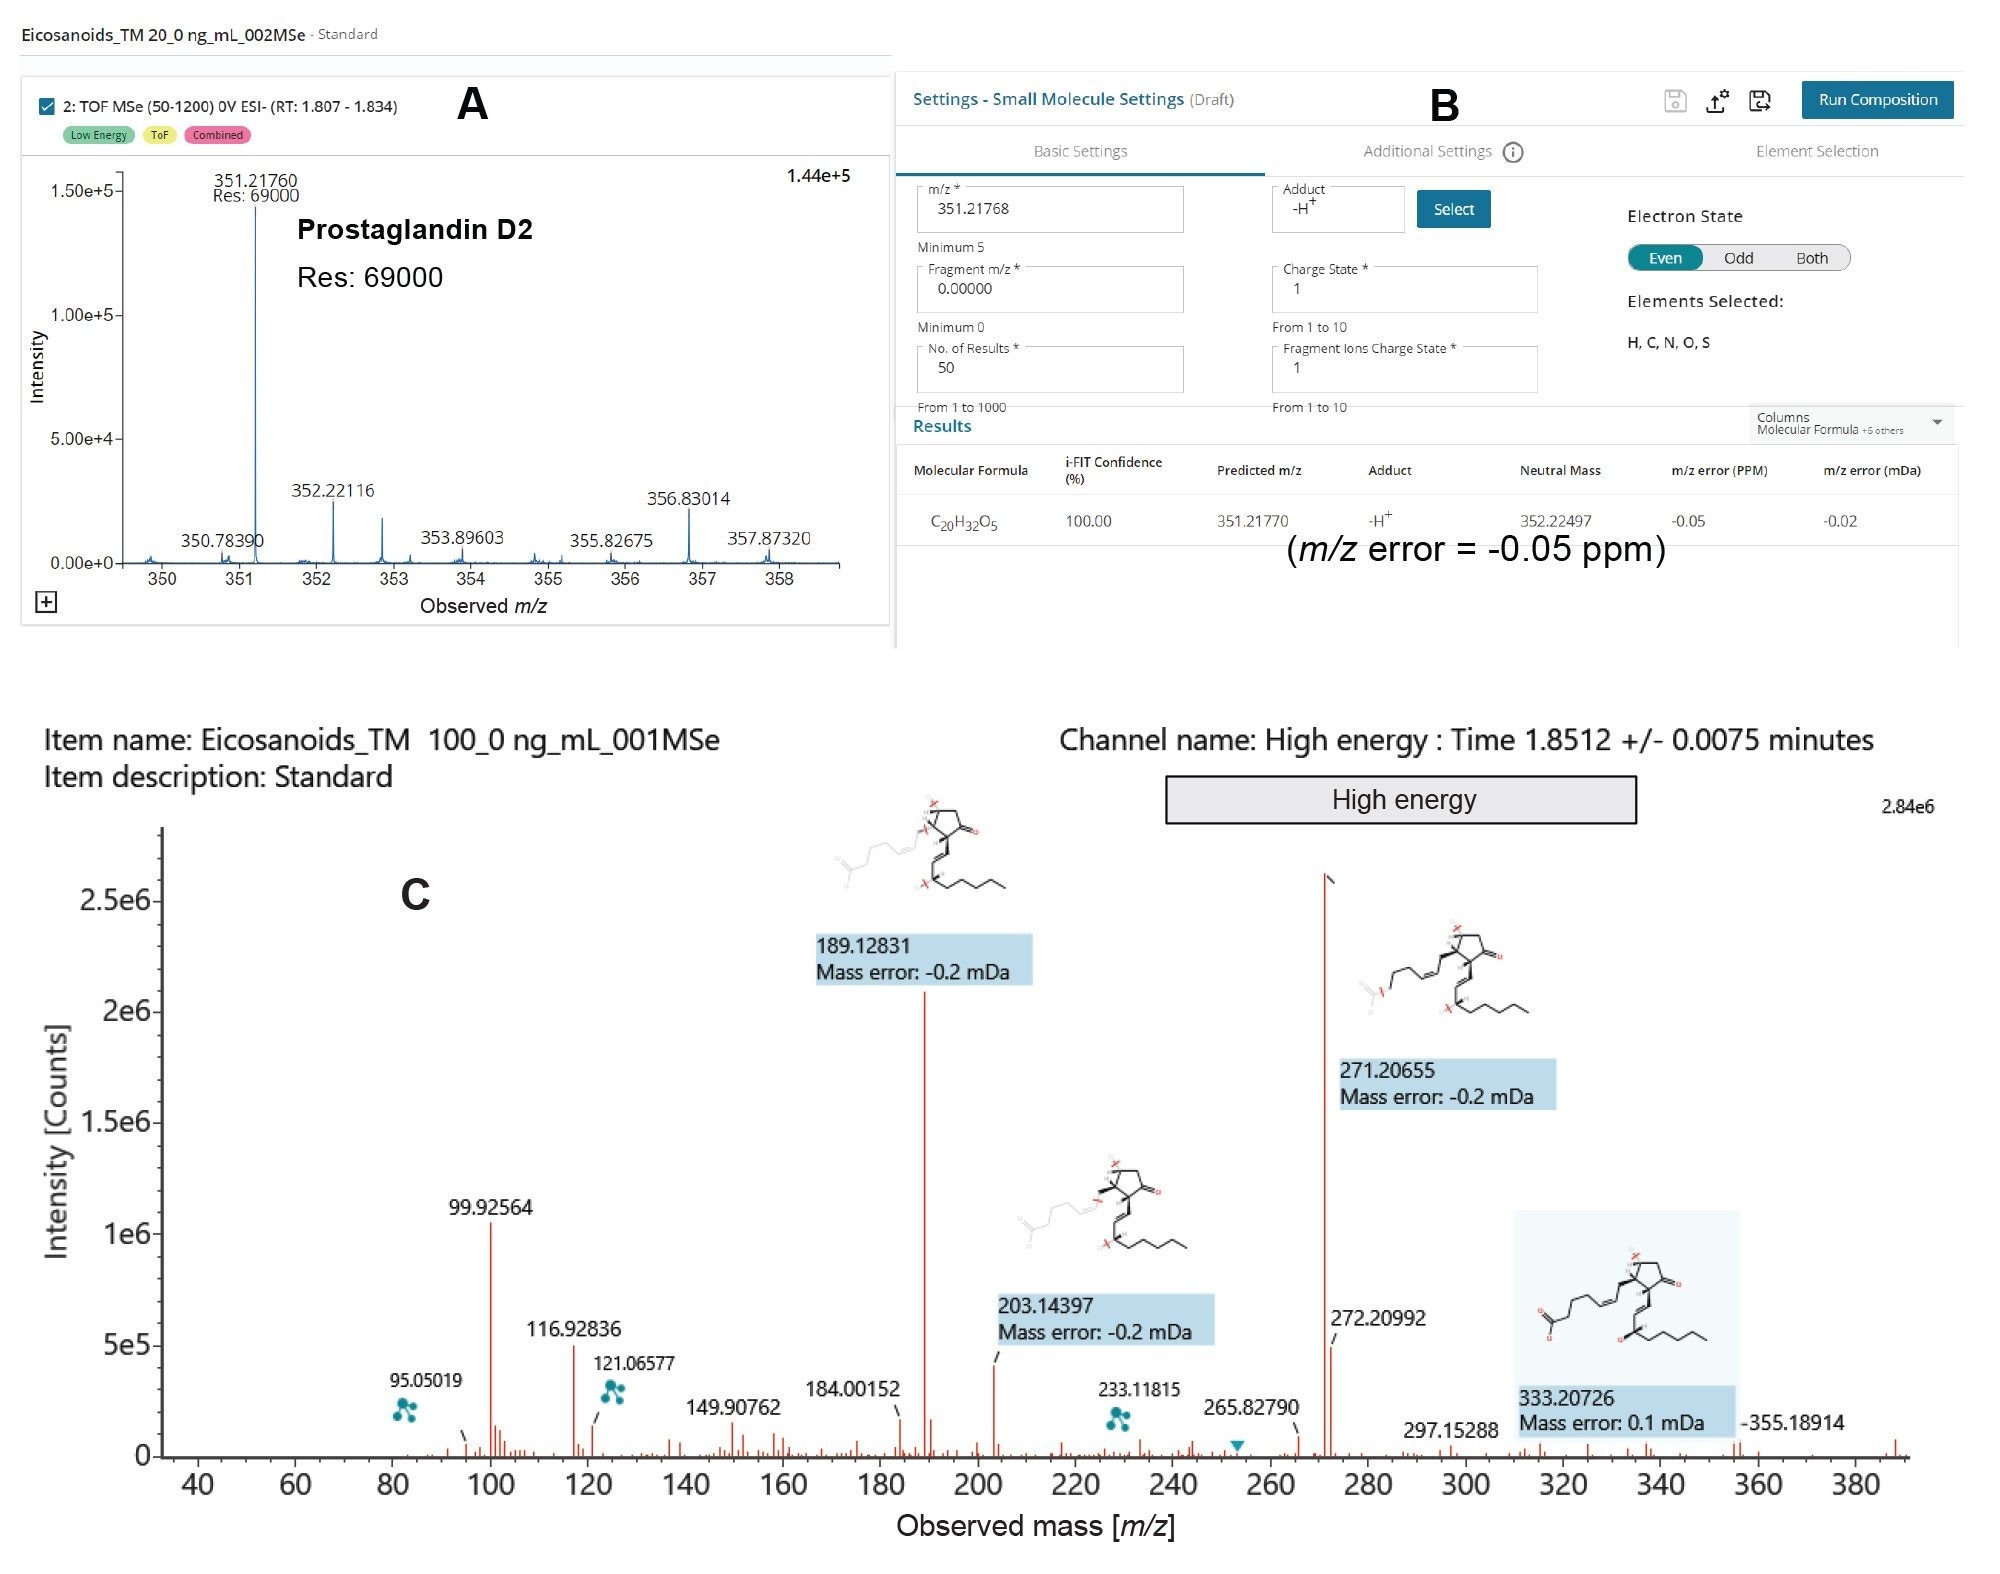
A QTOf instrument’s high mass accuracy falls within a few parts per million of the true, calculated, monoisotopic value which permits us to determine empirical formulas according to mass defect. LC-MS Toolkit is an application within waters_connect and was used to assess mass resolution and mass accuracy of the target compounds in the analysis. Figure 4 shows the resolution observed for PGD2 (C20H32O5) is (69000 FWHM) which signifies a high m/z precision. A high i-FIT confidence score was determined using Elemental Composition in LC-MS Toolkit because of low mass errors. The theoretical m/z [M-H] adduct for PGD2 is 351.2770. The high energy spectrum for PGD2 shows a very low mass error for the fragments which enables accurate structural elucidation.
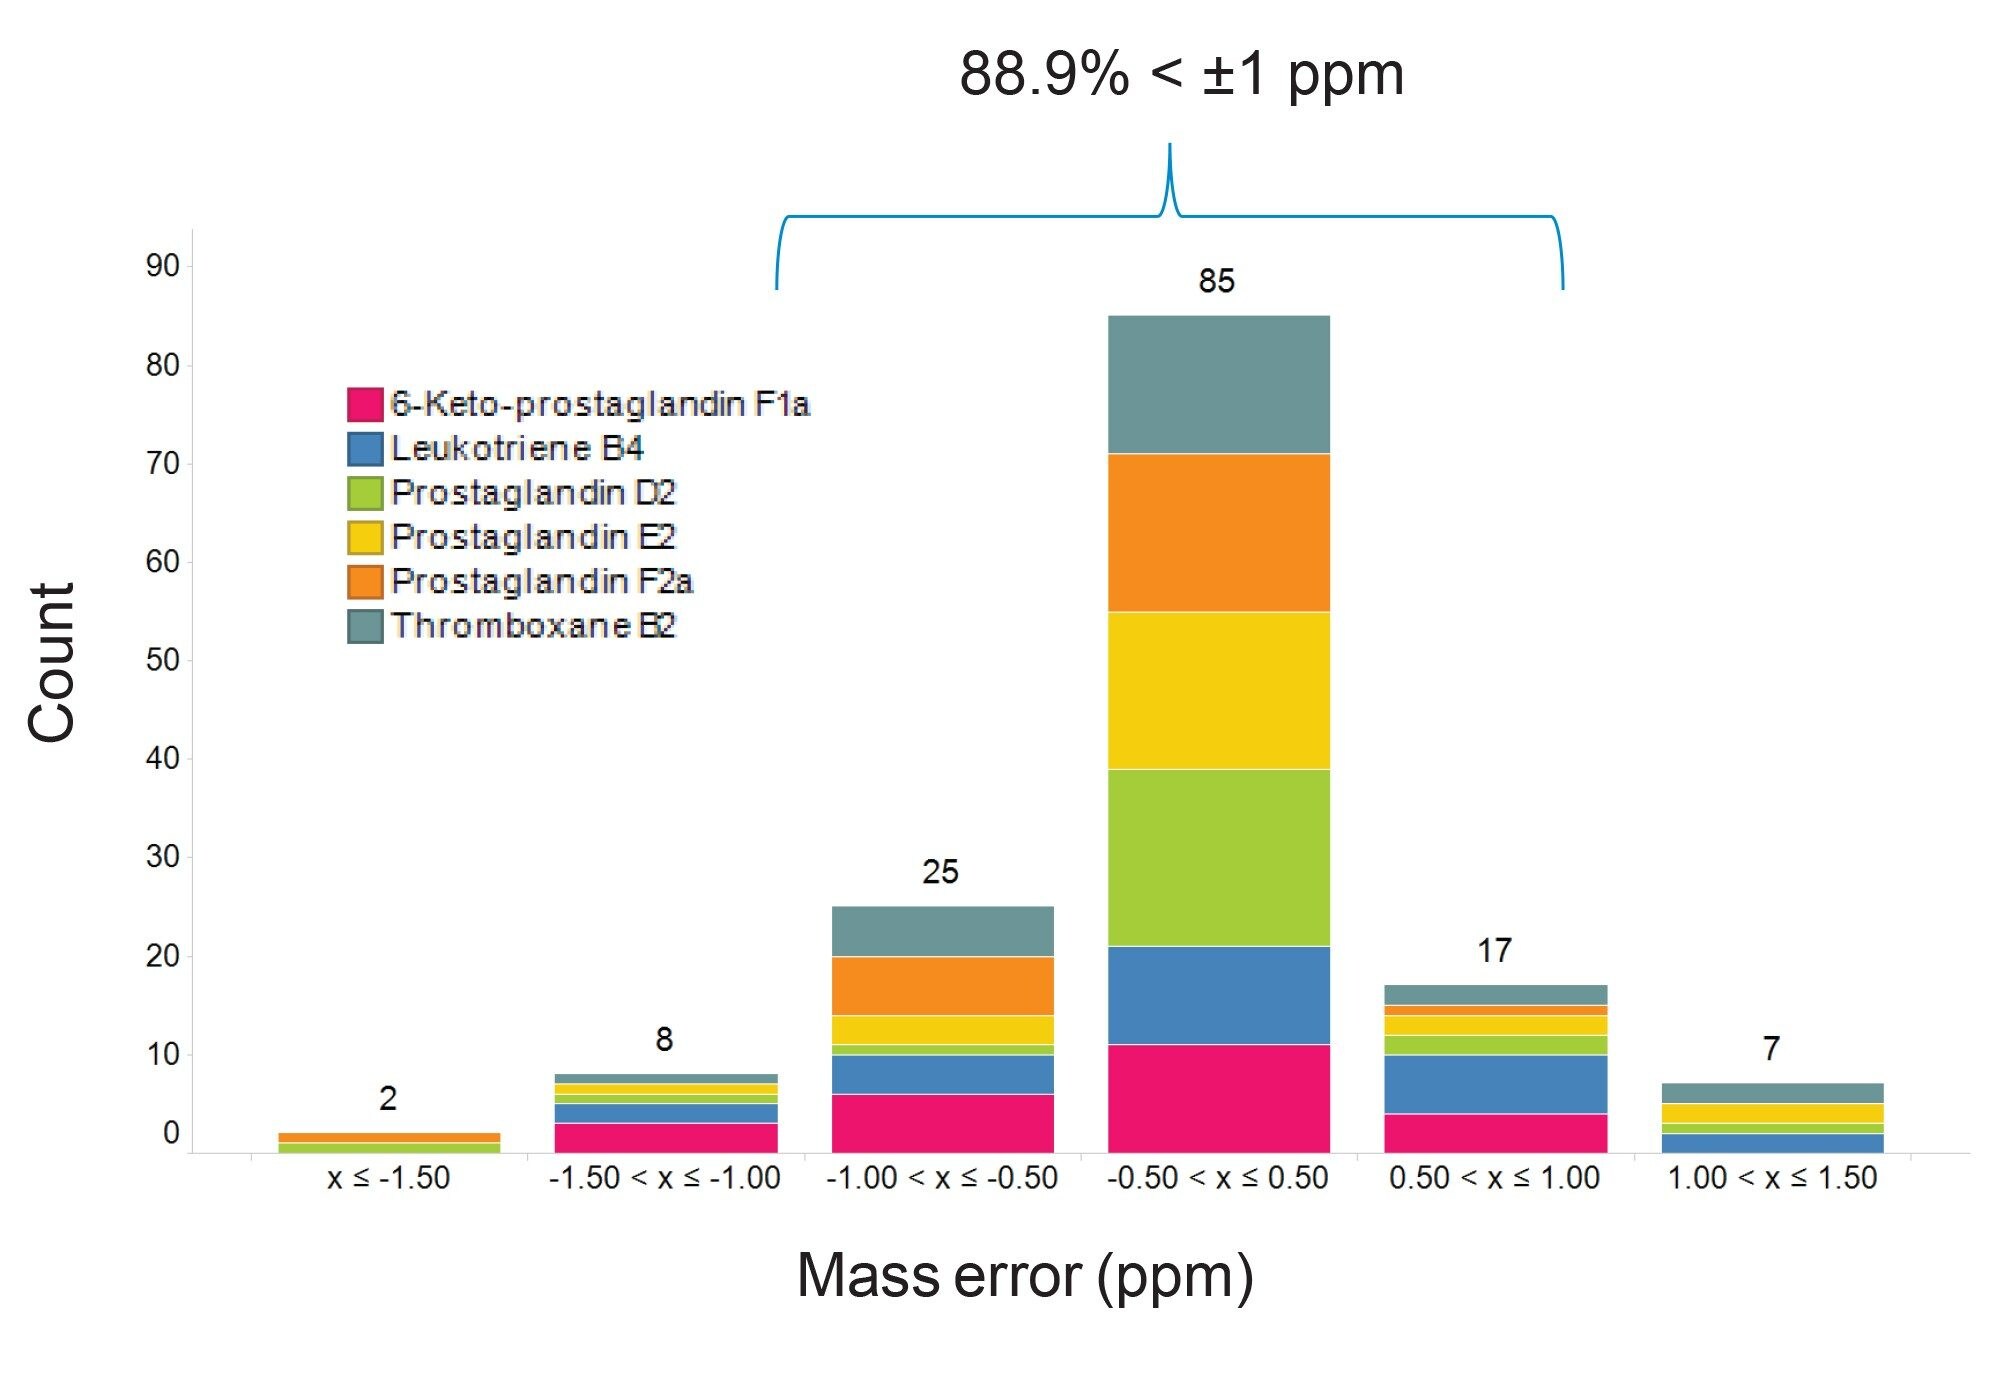
Mass error values across the analysis were typically less than 1 ppm and the RMS error less than 1 ppm for all compounds as shown in Figure 5. This high mass accuracy allows for the application of tighter database search windows further reducing the likelihood of false positive identification.
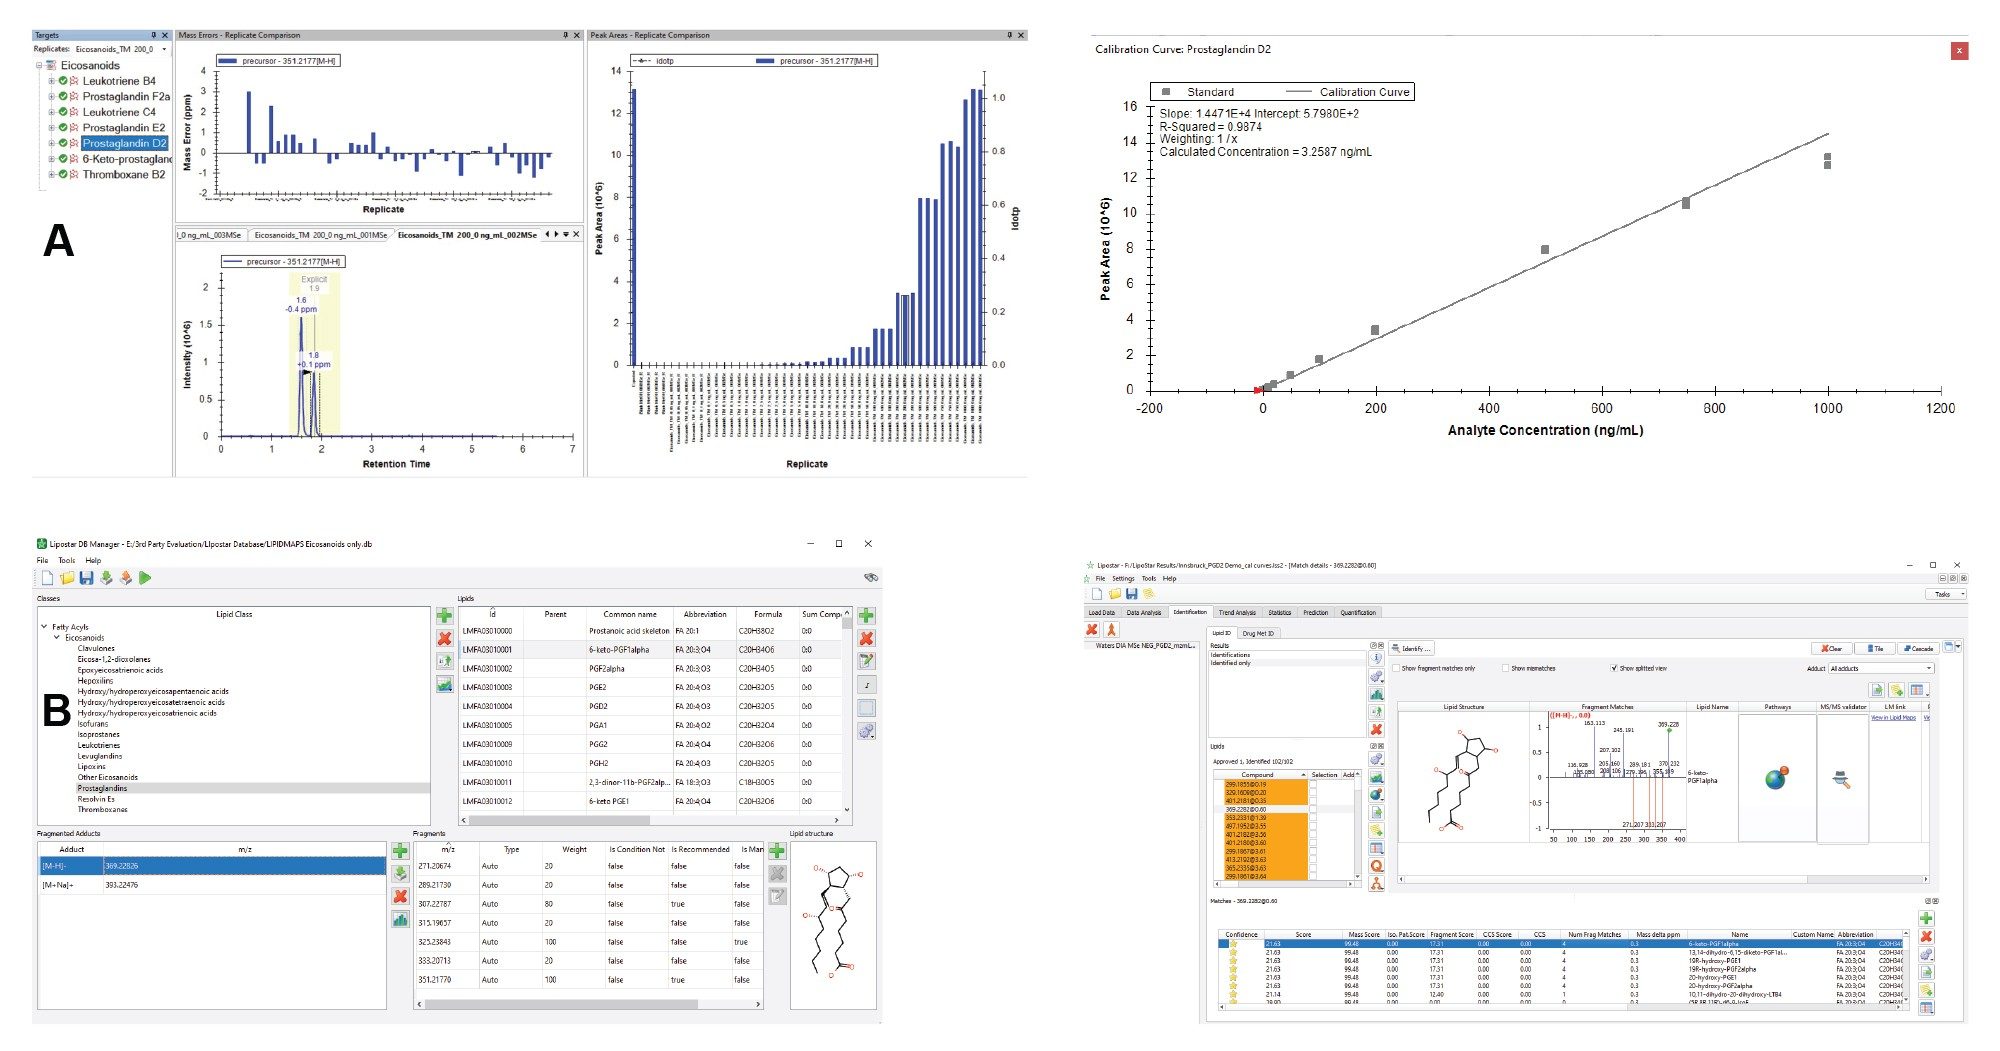
Third-party software
Many labs have informatics and data pipelines already in place, so for added flexibility it is possible to convert data into the widely used format, mzML, for data processing in popular third-party software. Figure 6 shows how the mzML files can be processed using Skyline. DDA and MSe data can be uploaded and processed in Skyline as mzML files, using a simple template containing m/z values. Calibration curves were generated following the simple tutorials available on the Skyline website. Lipostar 2 uses a rule-based fragmentation approach in the DB Manager module to aid the identification of lipids. Figure 6 (B) shows the Lipostar Database with an example of the expected fragments for 6-ketoPGF1α and how the compound is identified based on the mass accuracy fragmentation and retention time.
Conclusion
Calibration curves using the Xevo MRT QTof coupled to UltraPerformance LC demonstrate a high dynamic range and linearity covering four orders of magnitude. This highly sensitive instrument is able to match the LODs and LOQs of tandem quadrupole instruments for most of this class of compounds such as Leukotriene B4 (LTB4) and Prostaglandin F2a. For LTB4 the LOD and LOQ were <0.05 ng/mL (<0.00015 ng on column) and 0.1 ng/mL (0.0003 ng on column) and for Prostaglandin D2 (PGD2) the LOD and LOQ were 0.1 ng/mL (0.0003 ng on column) and 0.5 ng/mL (0.0015 ng on column). Peak area reproducibility was good with triplicate injections of a low (5 ng/mL), mid (50 ng/mL), and high (500 ng/mL) concentration sample using 3 µL showing excellent reproducibility at different concentrations CVs <3.5%.
The mass resolution of PGD2 was 69000 FWHM which signifies a high m/z precision. The excellent mass accuracy and low RMS error across the analysis observed for both the precursor and fragments ion (typically ≤ ±1.0 ppm) allows for more confident identification of eicosanoid species compared to tandem quadruple instruments.
Furthermore, the benefits of high mass accuracy, high mass resolution, and sensitivity can be combined with fast data acquisition, enabling high-throughput methods and the ability to scale the analysis to handle large cohort studies if needed.
Data compatible with third-party software such as Skyline and Lipostar makes this workflow highly flexible. Calibration curves, LOD, LOQ, and mass error tables can be easily generated by following simple tutorials.
References
- Kidd BL, Urban LA. Mechanisms of inflammatory pain. Br. J. Anaesth. 87(1), 3–11, 2001.
- Ricciotti E, FitzGerald GA. Prostaglandins and inflammation. Arterioscler. Thromb. Vasc. Biol. 31(5), 986–1000, 2011.
- Tans, R., Bande, R., van Rooij, A., Molloy, B. J., Stienstra, R., Tack, C. J., Wevers, R. A., Wessels, H. J. C. T., Gloerich, J., & van Gool, A. J. (2020). Evaluation of cyclooxygenase oxylipins as potential biomarker for obesity-associated adipose tissue inflammation and type 2 diabetes using targeted multiple reaction monitoring mass spectrometry. Prostaglandins Leukotrienes and Essential Fatty Acids, 160. https://doi.org/10.1016/j.plefa.2020.102157.
- Billy J. Molloy, Targeted UPLC-MS/MS Analysis of Oxylipins, Waters application note, 720007030. 2020.
- Schmidt R, Coste O, Geisslinger G. LC–MS/MS-analysis of prostaglandin E2 and D2 in microdialysis samples of rats. J. Chromatogr. B Analyt. Technol. Biomed. Life Sci. 826(1–2), 188–197 (2005).
- Gandhi, A. S., Budac, D., Khayrullina, T., Staal, R., & Chandrasena, G. (2017). Quantitative analysis of lipids: A higherthroughput LC-MS/MS-based method and its comparison to ELISA. Future Science OA, 3(1). https://doi.org/10.4155/fsoa-2016-0067.
- Laura Goracci, Sara Tortorella, Paolo Tiberi, Roberto Maria Pellegrino, Alessandra Di Veroli, Aurora Valeri, and Gabriele Cruciani (2017) LipoStar, a Comprehensive Platform-Neutral Cheminformatics Tool for Lipidomics, Analytical Chemistry 2017 89 (11), 6257–6264, DOI: 10.1021/acs.analchem.7b01259.
- A. Lister, Chapter 7 - Validation of HPLC Methods in Pharmaceutical Analysis, Separation Science and Technology, Vol. 6, Academic Press, 2005, https://doi.org/10.1016/S0149-6395(05)80051-0.
720008647, December 2024