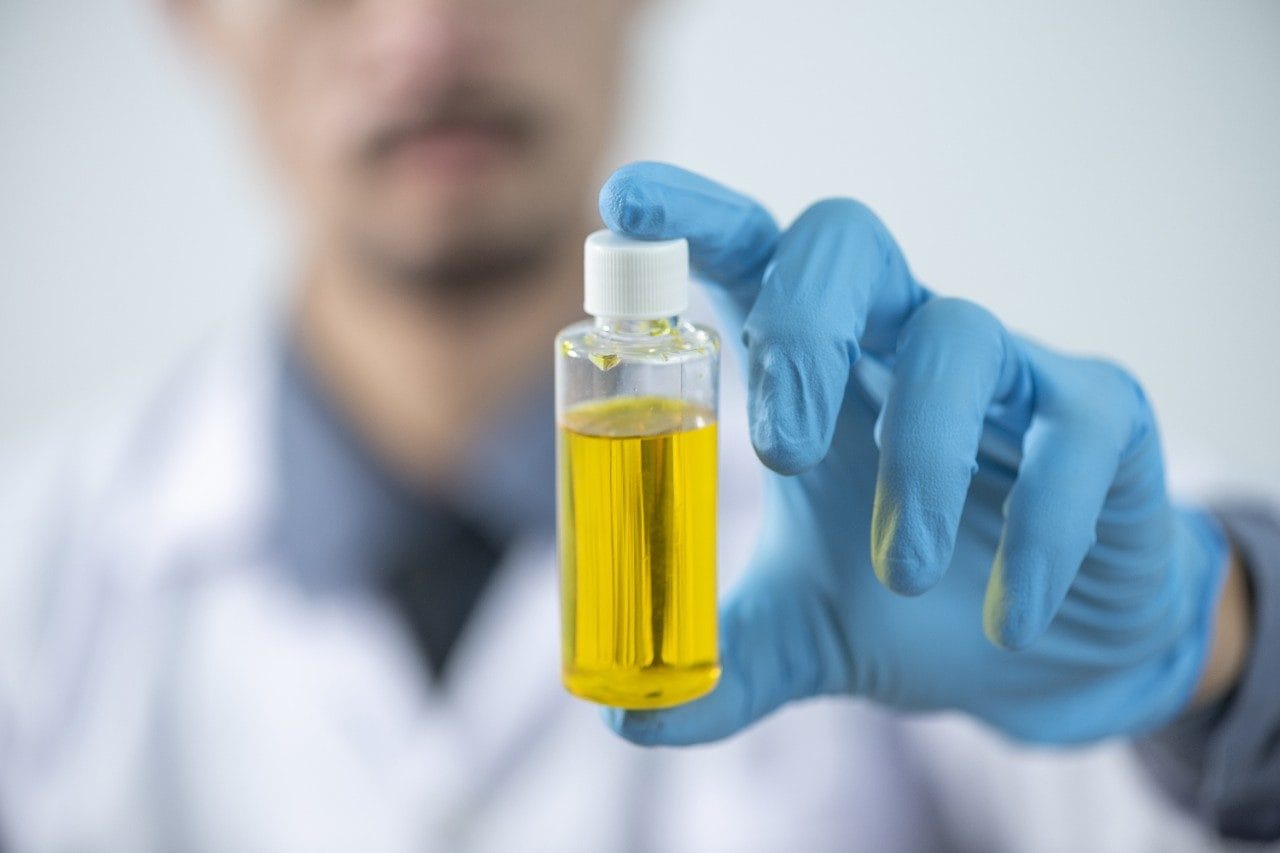
Ethanol is becoming an increasingly important alternative fuel on a worldwide scale due to social, environmental, political and economic factors. Production from fermentation alone in the U.S. has increased from 1.6 billion gallons in 2000 to 3.4 billion gallons in 2004.1 To ensure use as a fuel product, the ethanol is denatured by the addition of alkanes before shipment. ASTM2 method D5501-04, “Determination of Ethanol Content of Denatured Fuel Ethanol by Gas Chromatography,” details the analysis.
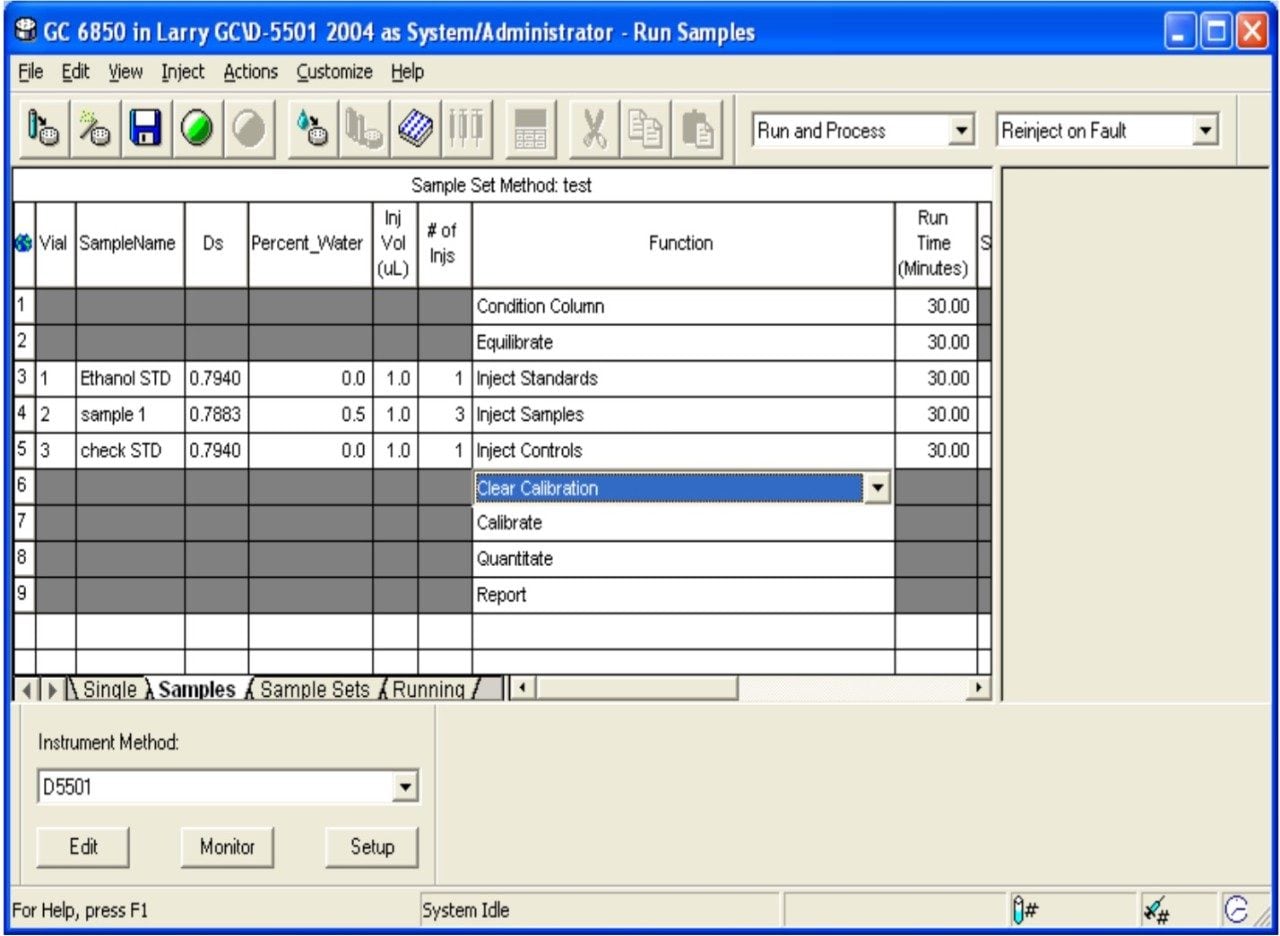
Producer labs and analysts are busy monitoring the lengthy ethanol fermentation process. Using Waters Empower 2 Software to streamline the final denatured ethanol analysis can save time. When an analyst can automate GC column conditioning and equilibration, data processing and calculations according to ASTM D5501-04 recommendations and print a report by filling in a small amount of information and pressing a Run button, that analyst is available to do other work in the lab or plant. Record keeping is easier with Empower as well. The sample identifiers that a lab uses, such as, sample name, batch, lot number, are trackable, traceable and searchable.
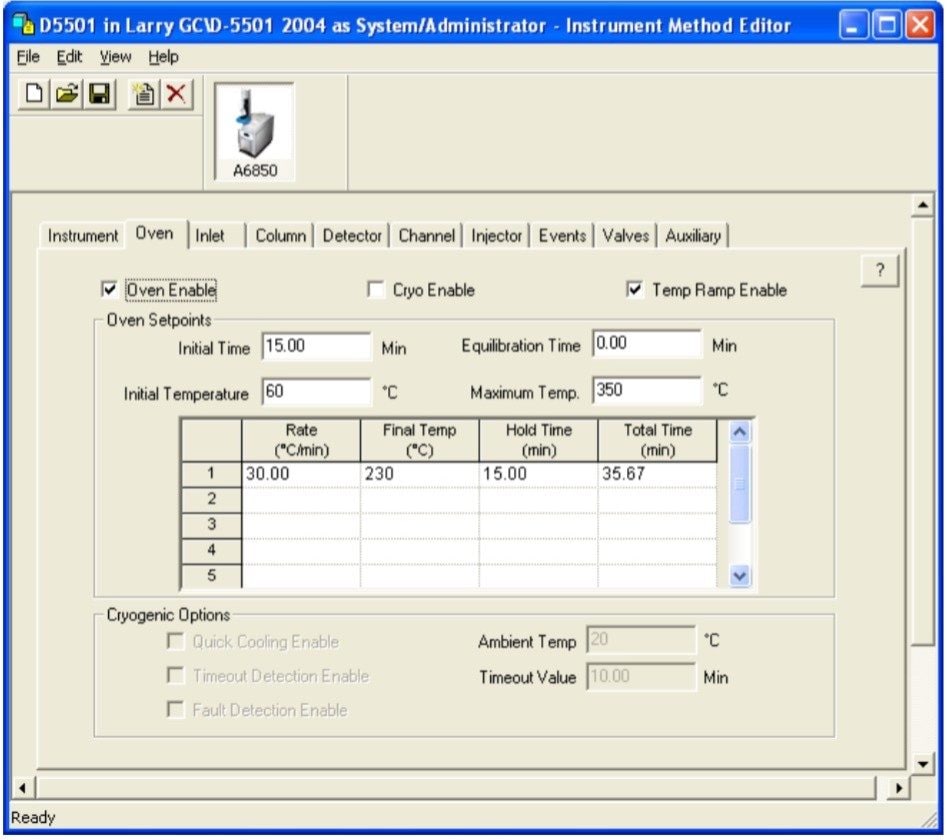
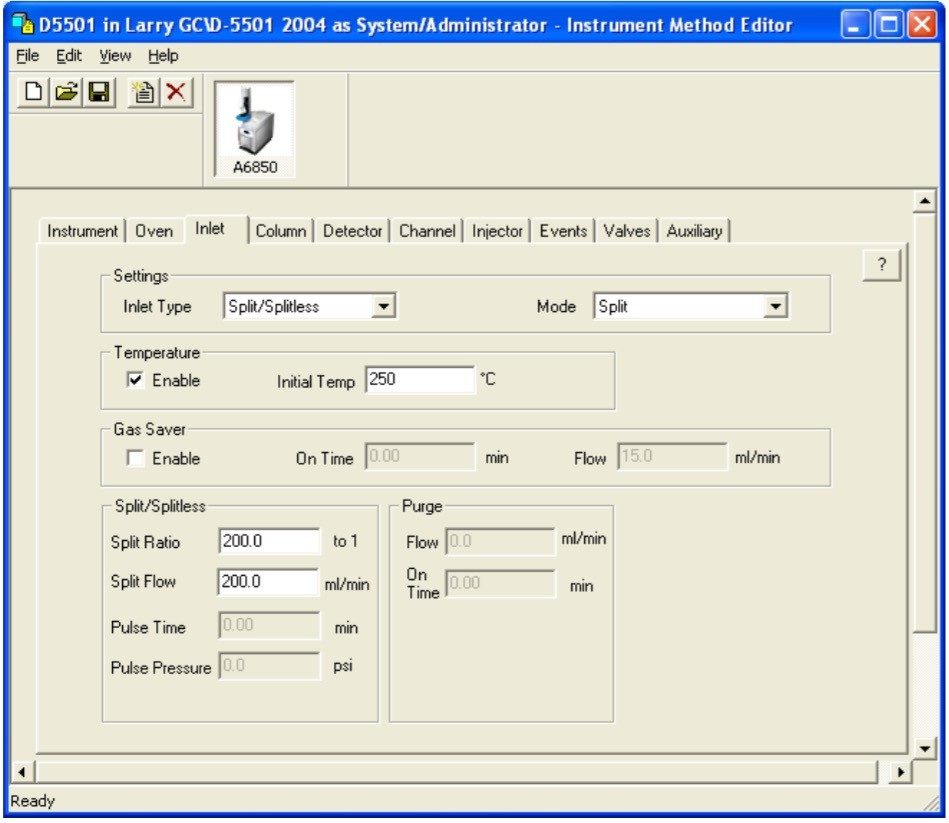
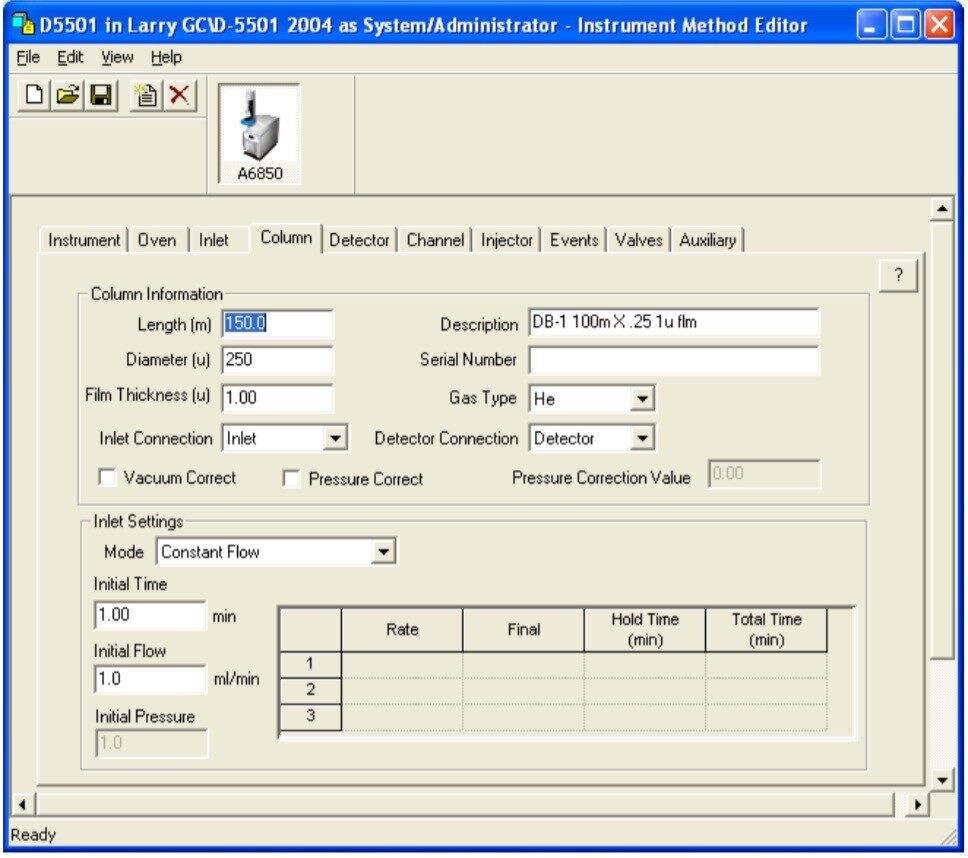
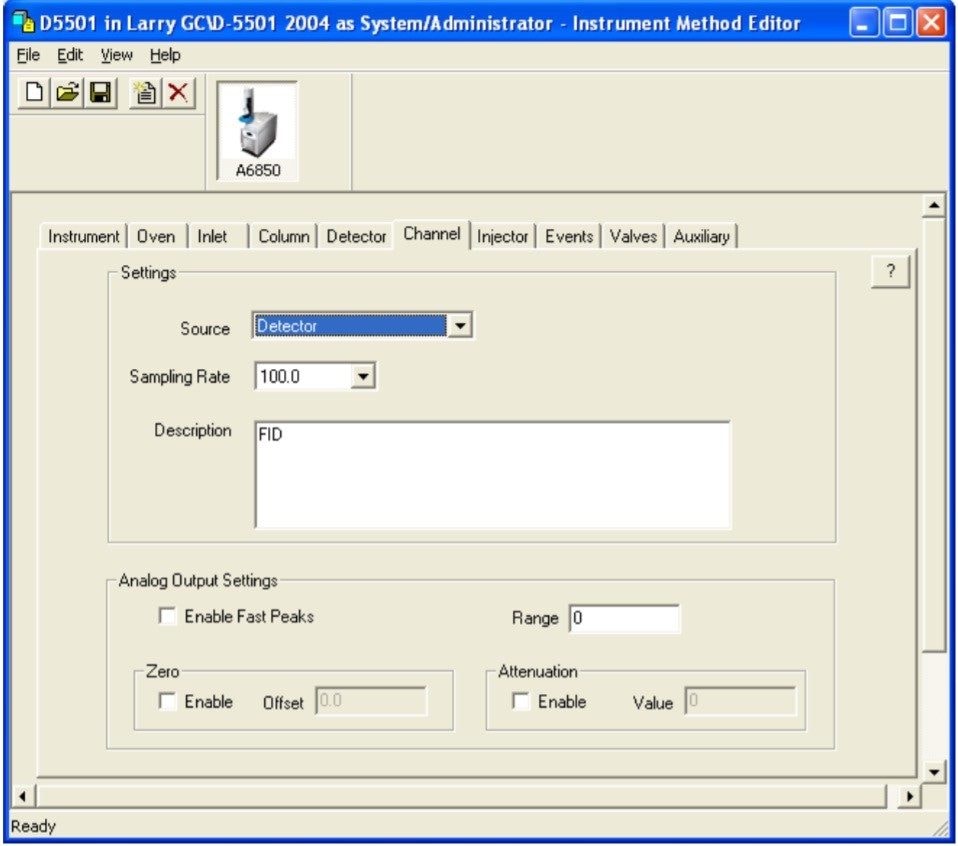
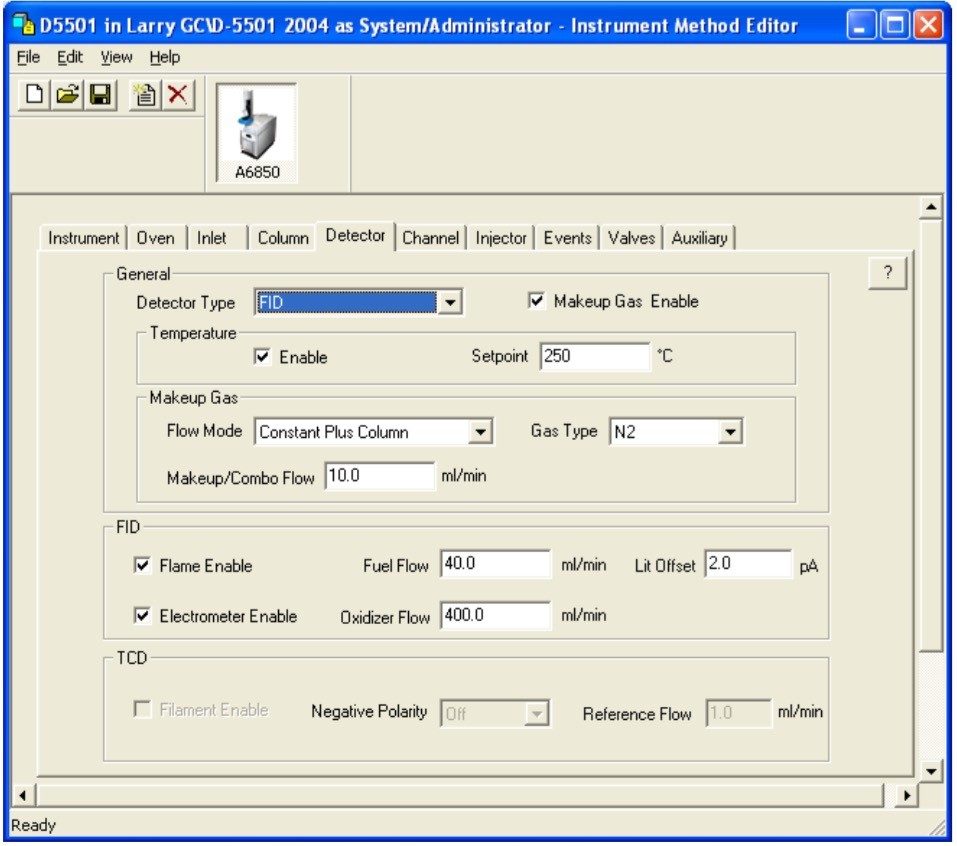
This application note briefly describes the use of Empower 2 Software for denatured fuel ethanol analysis and reporting. The analytical system was comprised of an Agilent 6850 GC with an FID detector and a client server running Empower 2.