In this application note, two polymersamples with different structural features were analyzed. The minimal quantity of sample and solvent and reduced time required to obtain in-depth characterization of samples using the ACQUITY APC System and the OMNISEC REVEAL advanced detector are advantageous to researchers and manufacturers seeking to fully understand their samples.
Size-exclusion chromatography (SEC), also known as gel permeation chromatography (GPC) is a well-known and widely used technique for polymer and macromolecular analysis. As the technique has become more pervasive, there has been a push toward greater efficiency, by way of increased resolution, reduced run times, and minimal solvent and sample consumption. The development of Waters ACQUITY Advanced Polymer Chromatography (APC) System has addressed these issues through the use of novel, sub-3-µm particles. The ACQUITY APC System has been purposely built to maintain resolution while handling the strong solvents typically employed in polymer chromatography, as well as the large back-pressures generated. These features provide more efficient polymer analyses, but the technique still relies on the need for column calibration to obtain relative molecular weight values.
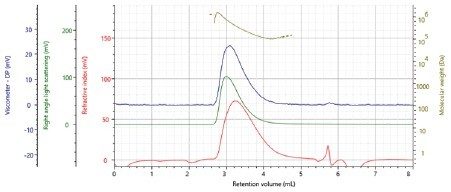
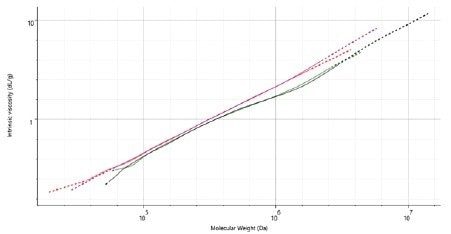
With SEC a concentration detector is always used, typically a refractive index (RI) detector. Multi-detector SEC measurements expand on this by adding detectors such as light-scattering (LS) or viscometry. LS can measure absolute molecular weight, independent of a molecules shape, structure, chemistry, or conformation. A viscometer allows the measurement of intrinsic viscosity (IV), which is used to study conformation and branching, which can expose structural changes that the polymer may undergo.
Malvern Panalytical recently introduced a version of the OMNISEC REVEAL advanced detector system that through collaboration with Waters, has been optimized for integrated use under APC conditions.
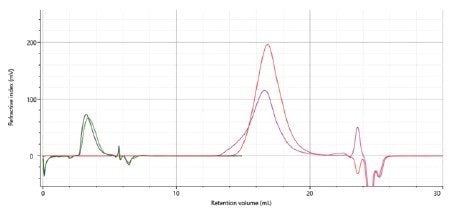
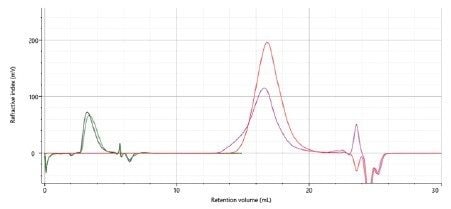
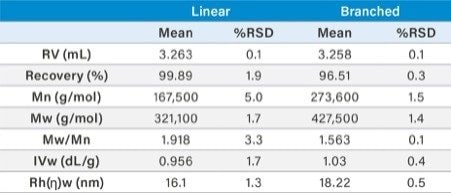
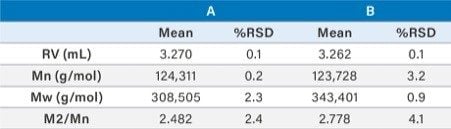
In this application note, two polymer samples with different structural features were analyzed. The goal of this experiment was to obtain enough characterization data to differentiate between linear and branched polystyrene samples – all in a matter of minutes.
A linear polystyrene (Sample A), and a branched polystyrene (Sample B) were prepared in THF at a concentration of 1.31 and 1.92 mg/mL, respectively.
LC system: |
ACQUITY APC |
Detection: |
OMNISEC REVEAL with RI, LS (RALS 90° angle, LALS 7° angle) and viscometer |
Vials: |
Waters Vials with pre-slit septa |
Column: |
ACQUITY APC XT, 150 mm: 45 Å, 125 Å, and 450 Å, in series |
Column temp.: |
40 °C |
Sample temp.: |
40 °C |
Injection volume: |
19 μL sample A, 14 μL sample B |
Flow rate: |
1.0 mL/min |
Mobile phase: |
THF (unstabilized) |
ACQUITY APC operation: |
Standalone ACQUITY Console Software |
OMNISEC operation, data collection and processing: |
Malvern Panalytical OMNISEC software |
The two polystyrene samples, A and B, were analyzed in THF at a flow rate of 1.0 mL/min using a set of three 150 mm ACQUITY APC XT columns: 45, 125, and 450 Å, in series. The column and detector temperatures were set to 40 °C. 19 and 14 µL injections were made for samples A and B, corresponding to mass loadings of 24.9 µg and 26.9 µg respectively; much less than a typical GPC/SEC analysis which might use 300 to 500 µg per injection.
Regular GPC/SEC analysis requires more sample per injection because the column volumes are much larger, which results in broad peaks as compared to the sharper peaks generated with APC columns. To compare the efficiency of the ACQUITY APC-OMNISEC REVEAL system to that of typical GPC/SEC analysis, samples A and B were also analyzed using two 30-cm mixed-bed analytical GPC/SEC columns. The RI chromatograms from both GPC/SEC and the ACQUITY APC- OMNISEC REVEAL system for samples A and B are overlaid below in Figure 2. The difference in mobile phase and analysis time required is visibly obvious, and the smaller sample peaks produced using the ACQUITY APC-OMNISEC REVEAL system indicate less sample was used. Even with the reduced signal intensity, the sensitivity of the OMNISEC REVEAL detectors eliminated any potential compromise in signal quality. While more than 20 mL of solvent is required to produce the broad peaks for samples A and B eluting from the pair of 30-cm mixed-bed analytical columns, the samples elute from the three APC XT Columns in less than 6 mL.
The triple detector chromatograms for samples A and B, including RI, RALS, and IV detector signals, are presented in Figures 3 and 4. The data show good signal-to-noise for all detectors, as well as quality chromatography, exemplified by the return to baseline after the peak for all detector signals. The molecular weight of each sample is plotted over the top of each peak, indicating a gradual decrease in molecular weight with later elution volume, and thus molecular size.
Samples A and B both eluted with similar peak shapes from about 2.75 to 4.5 mL. A calibration curve analysis method using only RI detection determined that these two samples have a similar molecular weight, based on their comparable retention volume. The addition of light scattering and viscometer detection offer further insight into the molecular structure of the samples. The molecular characterization data for sample A and sample B is summarized in Table 1.
The similar retention volume (RV) for samples A and B is consistent with the comparable hydrodynamic radius (Rh) values observed. In fact, the samples are so similar in size that a conventional calibration analysis (Table 2) yields a relative molecular weight of around 340,400 Da for sample B, which is only slightly larger than that of sample A, and in line with the Rh change. This highlights the advantages of light scattering detection.
In fact, the light scattering data reveals that samples A and B have significantly different Mw values, 321,000 Da and 427,500 Da, respectively, which is interesting considering their similar molecular size. This discrepancy is resolved when the intrinsic viscosity (IV) values of the samples are considered.
The IV values are almost the same – 0.956 dL/g for sample A and 1.03 dL/g for sample B – yet the two samples have vastly different molecular weights. Since sample B has the higher molecular weight, it possesses more mass within the same molecular volume. Not only does this mean the molecular density of sample B is greater than that for sample A, but also that for any given molecular weight, the IV for that slice of sample B will be less than that of sample A.
This relationship between IV and Mw is illustrated in a Mark-Houwink plot, which positions a sample’s IV on the Y-axis against its molecular weight on the X-axis. When the plots of multiple samples are overlaid, slight variations in structure between two samples become notable. The Mark-Houwink plots for two injections each of samples A and B are shown in Figure 5.
Polymers with consistent structures throughout their molecular weight range have Mark-Houwink plots that appear as straight lines, and samples with similar structures will have plots that overlay. Samples with different molecular densities will appear stacked, with the densest material situated lowest in the plot (as molecular density is inversely related to IV).
From the data in Figure 5, it is clear from the red and purple plots that sample A is linear in nature, as there is a consistent relationship between IV and Mw. The lower molecular weight portion of sample B, in green and black, displays the same type of linear profile up until 400,000–500,000 Da. At this point, the plot for sample B exhibits some curvature downward as it deviates from the linear plot of sample A. This change means that sample B has a lower IV than sample A, indicating it has a denser molecular structure. The most common molecular feature that leads to this dense structure is branching.
The Mark-Houwink plot, combined with the numerical data differences between samples A and B, provide evidence that sample A is linear polystyrene and sample B is branched polystyrene.
This provides an excellent demonstration of the advantages of advanced detection. Sample A is a linear polystyrene (and matches the conventional calibration standards), therefore its relative and absolute Mw are in agreement. However, in the branched sample B, the two disagree because conventional calibration does not account for the changes in molecular structure.
The combination of the Waters ACQUITY APC System with the advanced detectors of OMNISEC REVEAL allowed the structural differentiation of polystyrene samples A and B discussed herein. The samples were characterized individually, and while both have similar retention volumes, the data obtained by the light scattering and viscometer detectors provided further insight. The differences that were imperceptible based on retention volume, hinted at in the numerical data, became fully illustrated in the Mark-Houwink plot. The minimal quantity of sample and solvent and reduced time required to obtain in-depth characterization of samples using the ACQUITY APC-OMNISEC REVEAL system are advantageous to researchers and manufacturers seeking to fully understand their samples.
The authors gratefully acknowledge Malvern Panalytical for providing the data presented in this application note.
720006485, February 2019