• Application Note

Development of a Quantitative UPLC-MS/MS Assay for the Simultaneous Quantification of Acetylcholine, Histamine, and their Metabolites in Human Cerebrospinal Fluid (CSF) Using a CORTECS UPLC HILIC Column to Improve Peak Resolution, Sensitivity, and Speed of Analysis

Development of a Quantitative UPLC-MS/MS Assay for the Simultaneous Quantification of Acetylcholine, Histamine, and their Metabolites in Human Cerebrospinal Fluid (CSF) Using a CORTECS UPLC HILIC Column to Improve Peak Resolution, Sensitivity, and Speed of Analysis

  • Mary E. Lame
  • Erin E. Chambers
  • Kenneth J. Fountain
  • Waters Corporation

Abstract

The method described herein demonstrates the simultaneous quantification of ACh, HA, and their metabolites in human CSF. This application uses a single-step sample preparation, dilution of a 20-µL sample, followed by HILIC UPLC-MS/MS analysis. Using a sub-2-µm particle size, the high efficiency CORTECS UPLC HILIC Column provided resolution from endogenous matrices, increased analyte senstivity, and a short analysis time of 2.5 minutes, thereby resulting in a fast, sensitive, selective, and accurate method that meets the demands of high-throughput bioanalytical drug discovery.

Benefits

  • Resolution of the CORTECS UPLC HILIC Column provides simultaneous quantification of ACh, HA, and their metabolites
  • Total run time of 2.5 minutes meets high throughput screening demands
  • Simple sample preparation (<15 minutes) in a 96-well format
  • High sensitivity achieved with the Xevo TQ-S MS facilitates use of smaller sample volumes and higher dilution volumes than previously reported

Introduction

Biochemical biomarkers, derived from bodily fluids, are often employed in drug discovery and development as a useful way of identifying disease or effectiveness of drug treatment. Acetylcholine (ACh) and Histamine (HA) are highly polar neurotransmitters and are present in almost all mammalian tissues. They play a role in sleep regulation, memory and learning, and immune responses.1-3  A decrease in ACh levels in the brain is a known contributor to memory dysfunction, and is in particularly short supply in people with Alzheimer’s Disease. Thus, increased release of ACh is extensively researched in treatments of these cognitive disorders.

Histamine is derived from the decarboxylation of the amino acid, histidine. Histamine is either stored or rapidly inactivated by its primary degradative enzymes, histamine-N-methyltransferase, or diamine oxidase, and metabolized to two major metabolites, tele-Methylhistamine (t-mHA) and tele-methylimidazoleacetic acid (t-MIAA). Brain histamine is involved in a wide range of physiological functions, such as regulation of sleep-wake cycle, arousal, appetite control, cognition, learning, and memory.2,3 It is known that metabolites of histamine are increased in the cerebrospinal fluid of people with schizophrenia.4,5 Thus, the concentrations of HA, t-mHA, and t-MIAA in CSF could be used as indicators of brain histaminergic activity. Given the physiological importance of both ACh as well as HA and their metabolites, the ability to measure changes in their physiological concentrations as a function of disease progression or drug treatment make them of great interest as biochemical biomarkers in drug discovery and development.  

Figure 1. Structures of ACh, HA, and their respective metabolites. 

The development of targeted assays for ACh, HA and their respective metabolites, is a persistent challenge due to the demand for high sensitivity, selectivity, and fast sample analysis times. Additionally, simultaneous measurement requires a broad quantitative dynamic range due to the vast difference in endogenous circulating concentrations between ACh, HA, and their metabolites. While there are a number of analytical methodologies for quantifying these analytes (GC-MS, HPLC-EC, and LC-MS)6-8 there are few in which ACh, HA and their metabolites have been quantified simultaneously either in rodent brain microdialysate or in CSF matrices.9 Reversed-phase (RP) liquid chromatography combined with MS detection is limited by method sensitivity due to potential co-elution with matrix-suppressing components and poor MS ionization under higher aqueous elution conditions.10 Hydrophilic interaction liquid chromatography (HILIC) is increasingly becoming the technique of choice for these challenging polar analyte separations to improve chromatographic retention of polar species, orthogonal selectivity to reversed-phase chromatography for mixtures of polar and ionizable compounds, and increased mass spectrometry response. 

The method described herein demonstrates the simultaneous quantification of ACh, HA, and their metabolites in human CSF in a 96-well format. This application uses a single-step sample preparation, dilution of a 20-µL sample, followed by HILIC UPLC-MS/MS analysis. Using a sub-2-µm particle size, the high efficiency CORTECS UPLC HILIC Column provided resolution from endogenous matrices, increased analyte sensitivity, and a short analysis time of 2.5 minutes, thereby resulting in a fast, sensitive, selective, and accurate method that meets the demands of high-throughput bioanalytical drug discovery.

Experimental

Sample preparation

20 µL of artificial CSF (aCSF) standard, aCSF quality control (QC), or human CSF (containing 4 mM eSerine) QC samples were transferred to a 1-mL 96-well plate. 100 µL of acetonitrile containing 1 ng/mL each of d4-acetylcholine, d4-histamine, d3-tele-methylhistamine, and d3-tele-methylimidazolacetic, which were used as internal standards (ISTD), was added to the samples. The plate was covered and vortexed. The samples were then centrifuged for five minutes at 4000 rpm, and 10 µL of sample was analyzed by UPLC-MS/MS. 

UPLC conditions

System:

ACQUITY UPLC

Column:

CORTECS UPLC HILIC 1.6 μm, 2.1 mm x 100 mm (p/n 186007106)

Mobile phase A:

100 mM ammonium formate, pH 3

Mobile phase B:

Acetonitrile

Gradient:

Start at 90% B, linear ramp to 60% B at 0.75 minute, hold for 0.25 minute, then ramp to 30% B in 0.25 minute, and hold for 0.65 minute. Return to initial conditions at 1.9 minutes.

Flow rate:

0.5 mL/min

Column temp.:

45 °C

Sample temp.:

6 °C

Injection volume:

10 μL

Run time:

2.5 minutes

Collection plates:

Waters ACQUITY 1-mL collection plates

MS conditions

Mass spectrometer:

Xevo TQ-S

Ionization mode:

ESI positive

Capillary voltage:

3.0 kV

Desolvation temp.:

550 °C

Cone gas flow:

150 L/h

Desolvation gas flow:

900 L/h

Collision cell pressure:

3.58 X 10 (-3) mbar

Collision energy:

Optimized by component, see Table 1

Cone voltage:

Optimized by component, see Table 1

Data management

Chromatography:

MassLynx Software

Quantification:

TargetLynx Software

Results and Discussion

Mass spectrometry

Detection and quantification of ACh, HA, and their respective metabolites was achieved by ESI-MS/MS operating in the positive ion mode on a Waters Xevo TQ-S Mass Spectrometer. The multiple reaction monitoring (MRM) transitions chosen for ACh, HA, their respective metabolites, and corresponding deuterated stable isotope-labeled forms (used as Internal Standards) were automatically optimized using the MassLynx IntelliStart Software, as shown in Table 1. The short dwell times of 25 ms for each MRM transition, and fast scan time of the MS system allowed for the simultaneous acquisition of all compounds with >/= 10 data points for each. 

Table 1. MS conditions for ACh, Ch, HA, t-mHA, and t-MIAA, and their respective deuterated stable isotope-labeled ISTDs.

UPLC separation

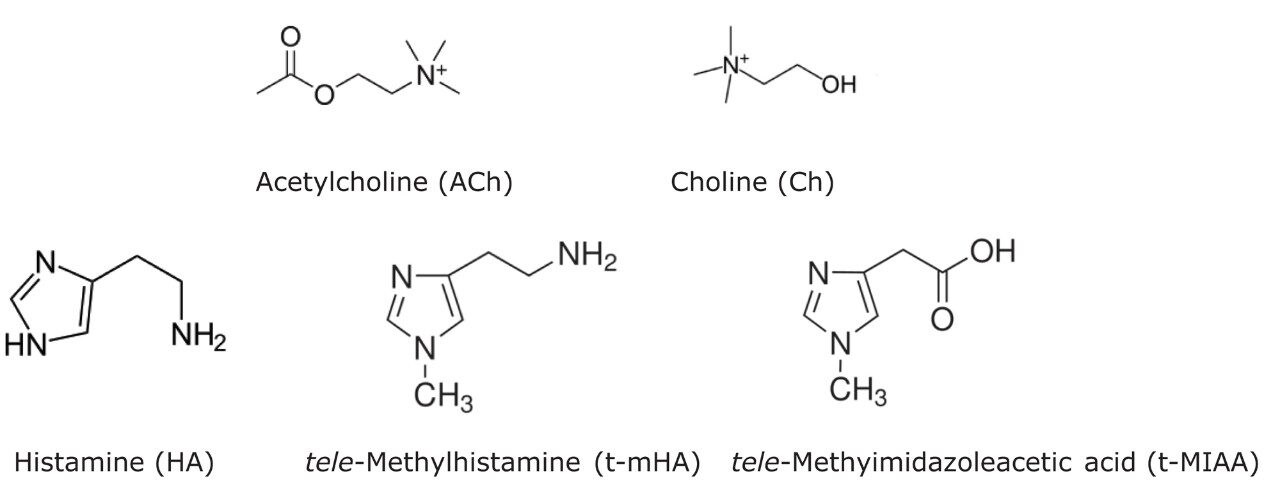
ACh, Ch, HA, t-mHA, and t-MIAA are highly polar, low molecular weight compounds present at relatively low concentrations, making them difficult to detect by standard reversed-phase (RP) chromatography. Additionally, quantitative analysis of these endogenous analytes in biological matrix is often difficult due to matrix-induced interferences and ion suppression from co-elution with related molecules, such as salts or other low molecular weight endogenous components.9

In this application, chromatographic separation of ACh, HA, and their respective metabolites was achieved utilizing a sub-2-µm CORTECS UPLC HILIC Column on an ACQUITY UPLC System. The optimum ammonium formate concentration (mobile phase A) was determined to be 100 mM, pH 3, while mobile phase B consisted of acetonitrile. An optimum flow rate of 0.5 mL/min using a gradient from 90% to 30% B was employed  with a cycle time of 2.5 minutes at a column temperature of 45 °C. 

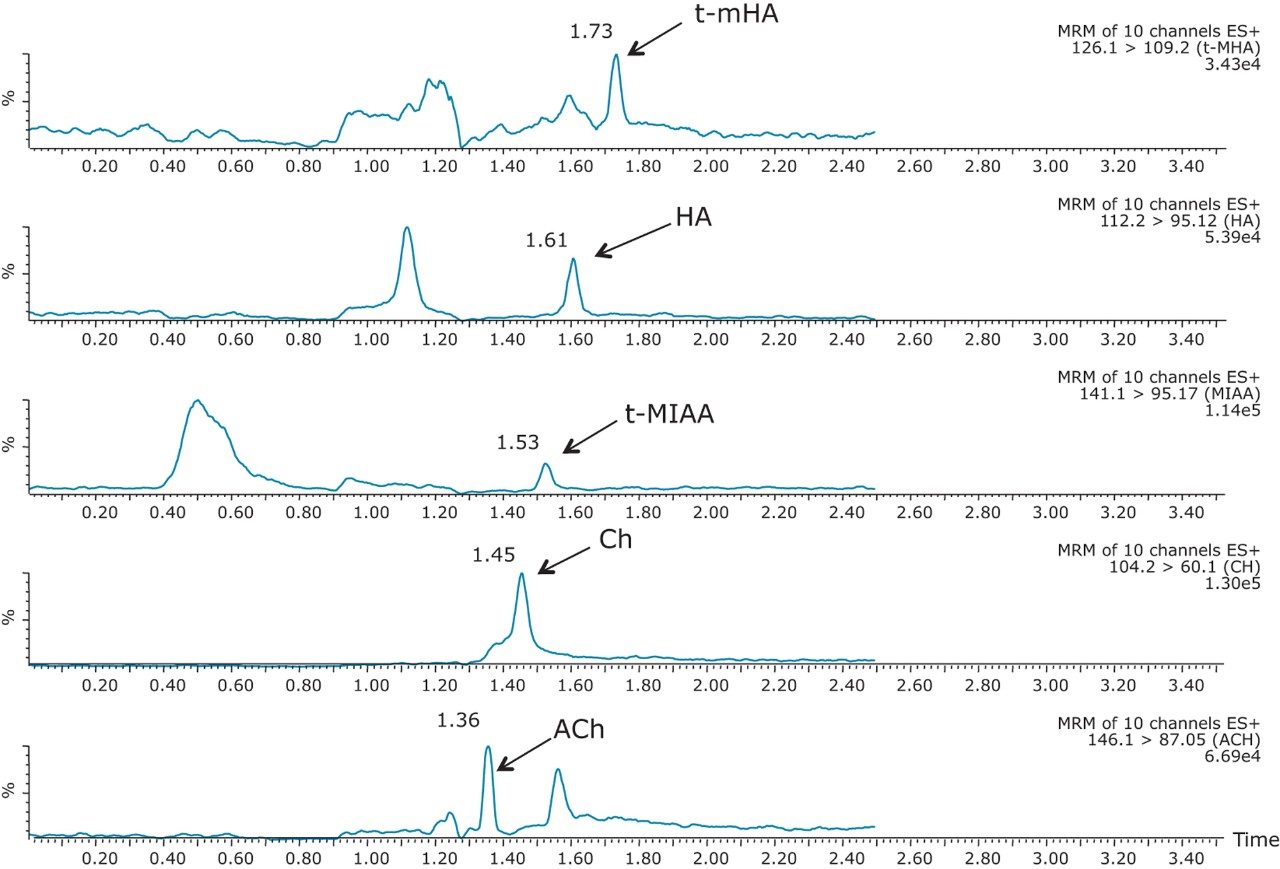
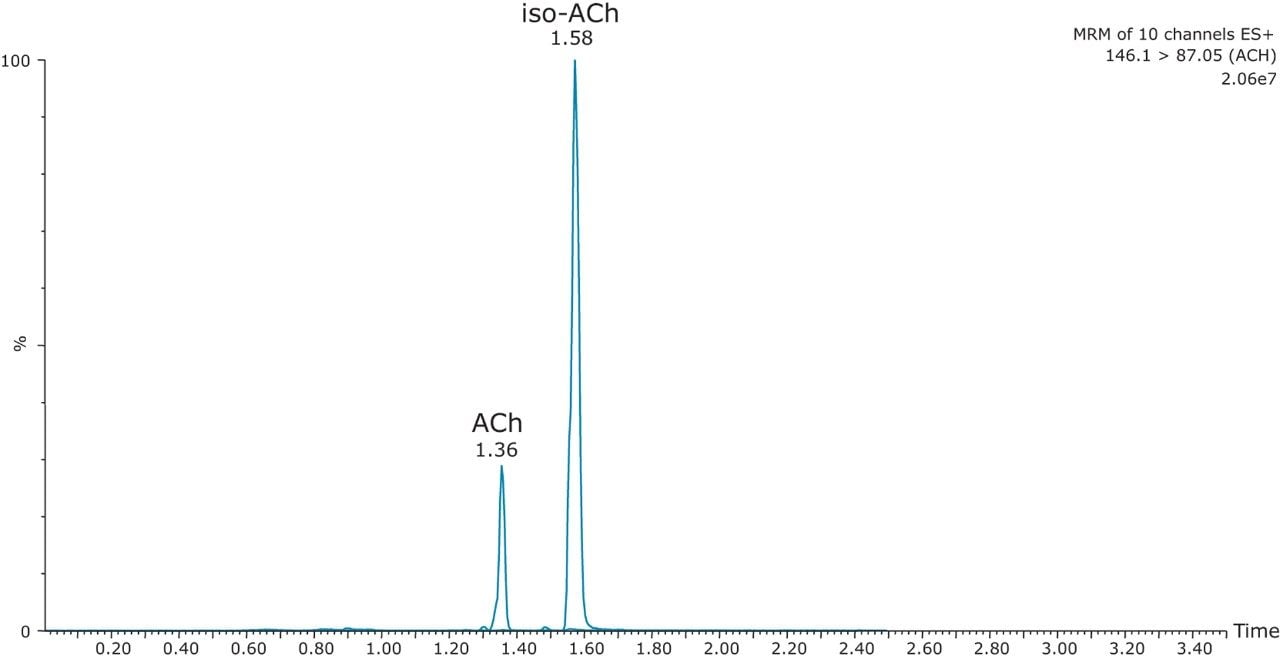
The mobile-phase additive concentration greatly influenced the specificity, sensitivity, and the ability to chromatographically resolve the analytes of interest from both mobile phase and endogenous matrix interferences. The higher buffer concentration of 100 mM (rather than 20 to 50 mM) greatly improved peak widths for the later eluting analytes. Specifically, peak tailing of t-MIAA was significantly reduced with the use of a high mM concentration of ammonium formate. Chromatographic retention and performance for the lower limit of quantification control (LLQC) samples of ACh, Ch, and their respective metabolites is shown in Figure 2. ACh, HA, their metabolites, as well as an isobar of ACh, Iso-ACh (3-carboxypropyl) trimethylammonium), eluted between 1.35 and 1.75 minutes, with peak widths less than 3.7 seconds at base. 

Figure 2. Representative chromatograms of ACh, Ch, HA, t-mHA, and t-MIAA in aCSF at LLQC concentrations (16 pg/mL for ACh/t-mHA, 62 pg/mL for HA, 35 pg/mL for t-MIAA, and 140 pg/mL for Ch).

Iso-ACh ((3-carboxypropyl)trimethylammonium) was included in the analysis due to its presence at high concentrations in the brain, and it is reported to be a substrate in the production of g-betaine hydroxylase, an enzyme in the biosynthesis of carnitine.11 Because ACh and Iso-ACh are isobaric, it is important to ensure chromatographic resolution for accurate quantification of ACh in CSF. An extracted human CSF sample (Figure 3) highlights the presence of a high endogenous concentration of Iso-ACh. ACh was spiked into human CSF at a concentration of 1000 pg/mL to demonstrate the chromatographic separation and concentration differences between ACh and Iso-ACh.

Figure 3. Representative chromatogram of ACh and Iso-ACH in human CSF (ACh overspike of 1000 pg/mL).

Sample preparation

Artificial CSF (aCSF) was chosen as an alternative matrix to prepare standard curves to quantify all analytes. Use of aCSF as a surrogate matrix was a more practical alternative, since it was readily available and not as cost prohibitive as human CSF. Overspiked human CSF QC samples for ACh, HA, t-mHA, and aCSF QCs for Ch and t-MIAA were prepared to ensure aCSF was a suitable matrix for accurate quantification of all analytes. QC samples were prepared in aCSF for Ch and t-MIAA, since the endogenous basal levels were present in high ng/mL concentrations in human CSF, making quantification by standard addition difficult within the correct assay range for the other analytes measured. Additionally, since Ch was present in high ng/mL concentrations in human CSF, sample dilution with aCSF was required for accurate quantification within the dynamic range of the assay. 

All human CSF QCs and human CSF samples contained a final concentration of 4 mM of the stabilizing agent eserine to prevent enzymatic conversion of ACh to Ch and acetate, as described by Zhang, Tingley, Tseng, et al. Standard curves, human CSF QCs, aCSF QCs, and samples were prepared in a 1-mL 96-well plate. A one-step sample dilution was performed with the addition of acetonitrile (1:5) containing the ISTDs described in the experimental section. The 96-well format allowed for sample preparation in <15 minutes, facilitating the high throughput of analysis required for discovery and development quantitative analysis.

Linearity, precision, and accuracy

Deuterated stable isotope-labeled standards (ISTDs) for ACh, HA, t-mHA, and t-MIAA were used for quantitative analysis. The d4 ACh IS was used for Ch quantification. Standard curves (1/x weighting) for ACh, Ch, HA, t-mHA, and t-MIAA were linear (>0.99) across their quantitative dynamic range. Dynamic ranges, linearity, average QC accuracy, and lower limit of quantitation control (LLOQ) are shown in Table 2. A representative standard curve for ACh is shown in Figure 4. 

Table 2. Analytical performance of the UPLC-MS/MS assay for ACh, Ch, HA, t-mHA, and t-MIAA.
Figure 4. Representative standard curve for ACh prepared in aCSF.

QC samples were prepared in pooled human CSF and aCSF to assess intra-sample precision and reproducibility. Basal levels of ACh, HA, and t-mHA were determined by analyzing un-spiked human CSF. The QC concentrations were then determined by subtracting average basal levels from the CSF source to provide the corresponding QC level. Representative results from overspiked human CSF QC samples for ACh, HA, and t-mHA analyses, as well as aCSF QC samples for Ch and t-MIAA analysis are shown in Tables 3 and 4. Following qualification of aCSF and human CSF calibrators, the endogenous basal concentrations of each analyte in human CSF were determined using the aCSF standard curves. A summary of all mean determined basal levels of ACh, Ch, HA, t-mHA, and t-MIAA is shown in Table 5. Accuracy and precision values met the FDA regulatory criteria for LC-MS/MS assays.12,13

Table 3. Representative ACh, HA, and t-mHA results from the analyses of QC samples prepared in human CSF.
Table 4. Representative t-MIAA and Ch results from the analyses of QC samples prepared in aCSF.
Table 5. Summary of measured mean endogenous basal levels in human CSF for ACh, Ch, HA, t-mHA, and t-MIAA, respectively.

Conclusion

  • A fast, simple, sensitive, and selective analytical scale UPLC method was developed for separation and simultaneous quantification of ACh, HA, and their metabolites in human CSF.
  • The 96-well format allowed for sample preparation in <15 minutes, providing high throughput required for discovery and development analysis.
  • Resolution and sensitivity of the CORTECS UPLC HILIC Column improved separation and resolution from endogenous matrix components allowing for analysis times of 2.5 minutes.
  • The high sensitivity of the Xevo TQ-S MS facilitated the use of small sample volumes (20 μL) and a 5X dilution to achieve detection limits as low as 10 pg/mL with a broad quantitative dynamic range of 10 to 30,000 pg/mL.
  • QC samples for all analytes easily passed FDA regulatory criteria, with % CVs of 0.3% to 10.1%, and an accuracy range of 94.7% to 113.7% for all analytes tested, indicating a very reproducible and accurate method.
  • The method described herein shows promise for highly selective and sensitive quantification of multiple neurological biomarkers in the discovery and developmental stages of pharmaceutical drug development.

References

  1. Jia JP, et al. Differential acetylcholine and choline concentrations in the cerebrospinal fluid of patients with Alzheimer’s disease and vascular dementia. Chin Med J (Engl). 2004; 117(8): 1161-4.
  2. Vohora D, Bhowmik M. Histamine H3 receptor antagonists/inverse agonists on cognitive and motor processes: relevance to Alzheimer’s disease, ADHD, schizophrenia, and drug abuse. Front Syst Neurosci. 2012; 6: 72.
  3. Jadidi-Niaragh F, Mirshafiey A. Histamine and histamine receptors in pathogenesis and treatment of multiple sclerosis. Neuropharmacology. 2010; 59(3): 180-9.
  4. Ito C. The role of the central histaminergic system on schizophrenia. Drug News Perspect. 2004; 17(6): 383-7.
  5. Alvarez EO. The role of histamine on cognition. Behav Brain Res. 2009; 199(2): 183-9.
  6. Prell GD, Green JP. Measurement of histamine metabolites in brain and cerebrospinal fluid provides insights into histaminergic activity. Agents Actions. 1994; 41: C5-8.
  7. Huang T, et al. Detection of basal acetylcholine in rat brain microdialysate. J Chromatogr B Biomed Appl. 1995; 670(2): 323-7.
  8. Bourgogne E, et al. Simultaneous quantitation of histamine and its major metabolite 1-methylhistamine in brain dialysates by using precolumn derivatization prior to HILIC-MS/MS analysis. Anal Bioanal Chem. 2012; 402(1): 449-59.
  9. Zhang Y, et al. Development and validation of a sample stabilization strategy and a UPLC-MS/MS method for the simultaneous quantitation of acetylcholine (ACh), histamine (HA), and its metabolites in rat cerebrospinal fluid (CSF). J Chromatogr B Analyt Technol Biomed Life Sci. 2011; 879(22): 2023-33.
  10. Grumbach ES, Diehl DM, Neue UD. The application of novel 1.7 microm ethylene bridged hybrid particles for hydrophilic interaction chromatography. J Sep Sci. 2008; 31(9): 1511-8.
  11. Zhu Y, et al. In vivo microdialysis and reverse phase ion pair liquid chromatography/tandem mass spectrometry for the determination and identification of acetylcholine and related compounds in rat brain. Rapid Commun Mass Spectrom. 2000; 14(18): 1695-700.
  12. Viswanathan CT, et al. Quantitative bioanalytical methods validation and implementation: best practices for chromatographic and ligand binding assays. Pharm Res. 2007; 24(10): 1962-73.
  13. Bansal S, DeStefano A. Key elements of bioanalytical method validation for small molecules. AAPS J. 2007; 9(1): E109-14.

* To watch summaries of other application notes, visit: www.waters.com/MTS

720004722, October 2013

Back To Top Back To Top