Most biotherapeutics today are produced by recombinant DNA technology using a well-selected host cell system. Host cells express a large number of their own proteins that can easily contaminate the recombinant protein drug. Even after sophisticated purifications steps, low levels (1 to 100 ppm) of host cell proteins (HCPs) may still remain in the final purified biopharmaceutical product. Because HCPs can sometimes trigger an unpredictable immunogenic response, regulatory guidelines stipulate that they need to be identified and quantified to protect patient safety.
The presence or absence of HCPs in protein drugs can determine whether or not a biopharmaceutical is accepted by the regulatory agencies. For example, in 2008, the European Medicines Agency (EMA) approved a recombinant form of human somatropin only after the manufacturer added additional purification steps to remove the HCPs responsible for immunogenic response in patients.1 The same agency rejected an interferon biosimilar in 2006 because of insufficient validation for immunogenicity testing.
All analytical methods employed for measuring HCPs face significant challenges due to the wide dynamic range of the protein concentration (four to five orders of magnitude). Some widely used analytical methods, such as process-specific ELISAs and western blots,2 require prior knowledge regarding the nature of HCP contaminants. In addition, process specific immunoassays are both time consuming (e.g., six months), and expensive to develop (more than $100K), and are not readily adapted to fully evaluate biopharmaceutical products from different cell types and purification schemes.
Two-dimensional gel electrophoresis coupled to fluorescent staining,3,4 another popular method for HCP analysis, is only semi-quantitative, has limited dynamic range (two to three orders of magnitude) and requires additional, confirmatory techniques (e.g., mass spectrometry) for HCP identification. Although commercial ELISA kits are developed for generic application to the monitoring of HCPs, they are less specific than the process-specific immunoassays, and cannot offer a complete coverage for all the existing HCPs in the samples.5,6
An organization that can demonstrate that it is capable of accurately identifying and monitoring the HCPs in its biotherapeutics is more likely to overcome regulatory hurdles in the acceptance of its products.
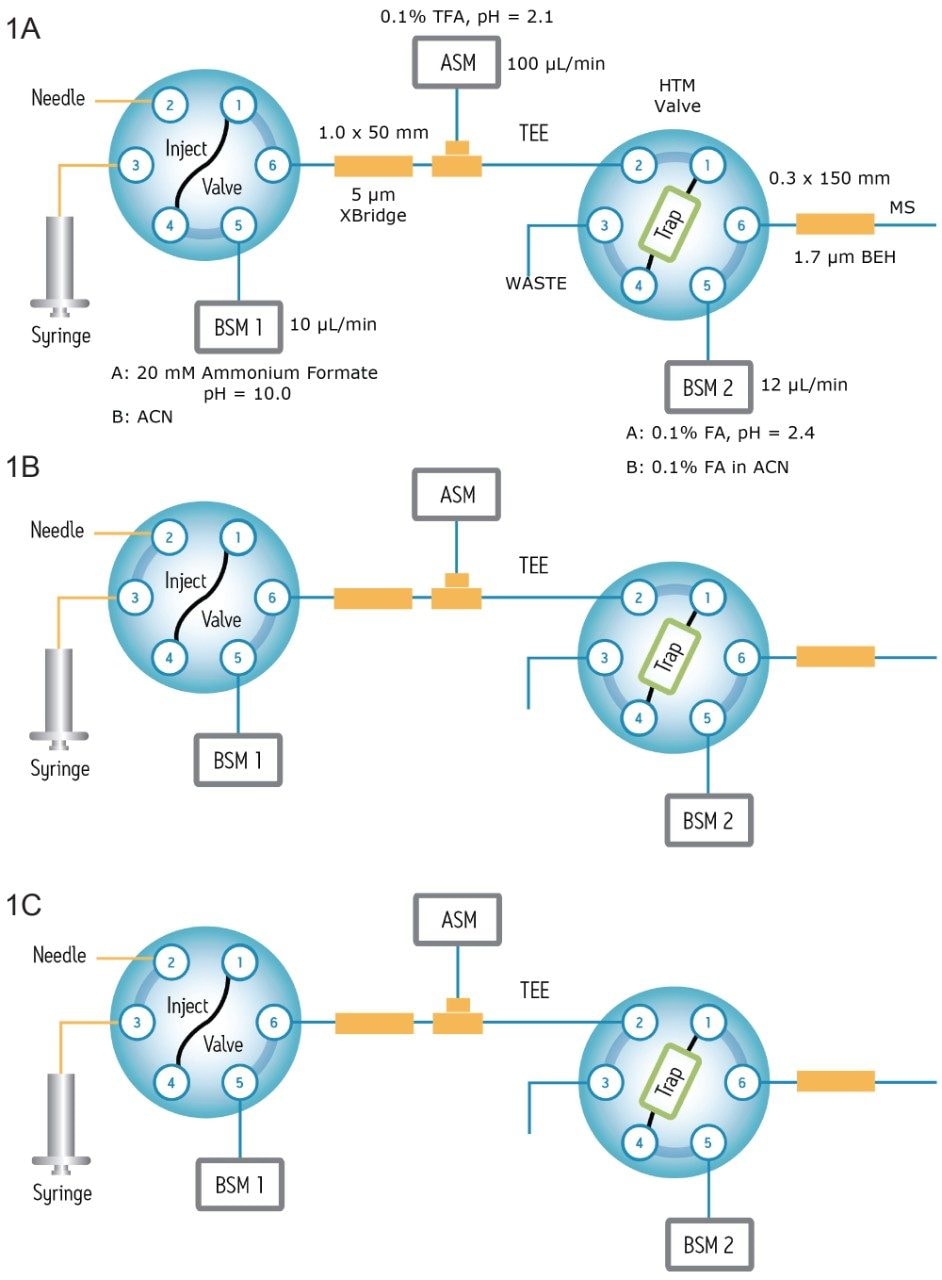
In this application note, a generic UPLC-MS assay that offers comprehensive HCP identification and quantification for biotherapeutic protein samples is described. The assay applies an on-line two-dimensional LC approach for peptide separations and a high-resolution and high-mass-accuracy mass spectrometer for protein identification and quantification.
In contrast to the traditional 2D-chromatography setup schemes that are based on strong cation exchange (SCX) and low pH reversed-phase7 separation, the 2D method employed here couples a high pH reversed-phase (RP) separation to a low pH RP separation to achieve maximum chromatographic separation and to cope with the complexity and the wide dynamic range that are encountered in the HCP samples.
In addition, a multiplexed data acquisition method (MSE) is employed in the mass spectrometric analysis so low-abundance HCP peptides can be reproducibly sampled and identified without bias.
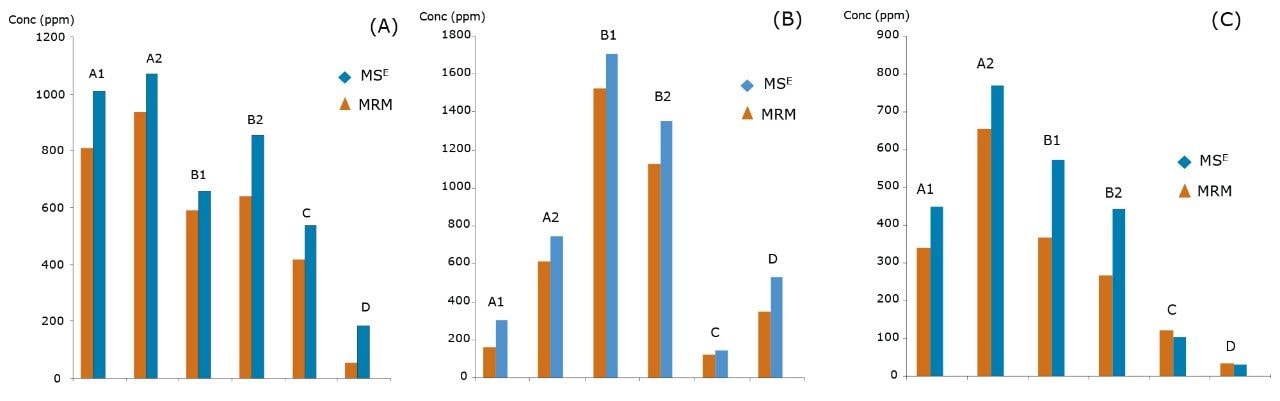
Furthermore, a fast quantitative assay has been developed based on multiple reaction monitoring (MRM) principles to provide a high-throughput method for monitoring HCP variation in samples from a variety of manufacturing/purification conditions.
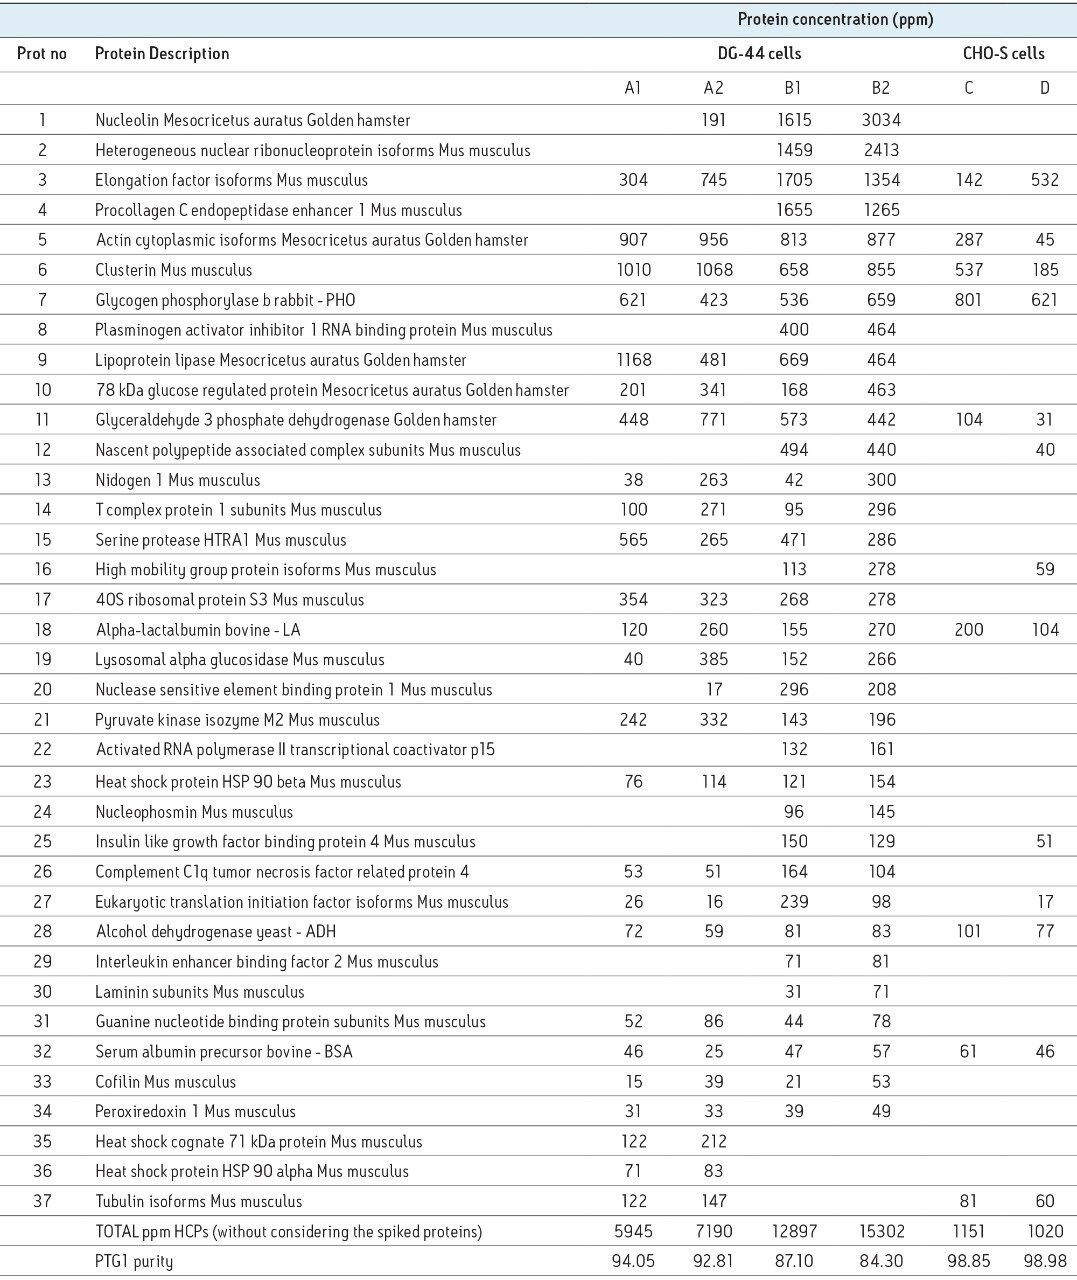
In this application note, we evaluate the performance of the assay using monoclonal antibody samples derived from different purification methods.