Automated Software Tools to Localize the Site of Biotransformation
This is an Application Brief and does not contain a detailed Experimental section.
Abstract
To automate the determination of the site of metabolism of a drug compound using exact mass product ion information and innovative software tools.
Benefits
MSE data contains both precursor and product ion information for every detectable species in the sample and allows automatic comparison of the product ion spectra between metabolite and parent.
Introduction
An example of this occurs in the early stages of drug discovery when efficient localization of the site of metabolism can provide medicinal chemists with the critical information needed to design better drug candidates in a meaningful and short timeframe.
In this technology brief, we demonstrate a single injection UPLC/MSE approach to generate a comprehensive dataset and the use of software tools to automatically localize biotransformations.
Results and Discussion
Human liver microsomes spiked with 10 µM nefazodone were incubated for 0 and 60 min at 37 °C. Samples were quenched with one volume of acetonitrile + 0.1% formic acid and centrifuged. Supernatants were analyzed in positive ion mode using a UPLC/MSE acquisition method.
5 µL of sample was injected onto an ACQUITY UPLC BEH Column (1.7 µm, 2.1 x 50 mm), and run with a 2 min gradient at a flow rate of 0.7 mL/min. The mobile phase consisted of 0.1% ammonium hydroxide (A) and methanol (B).
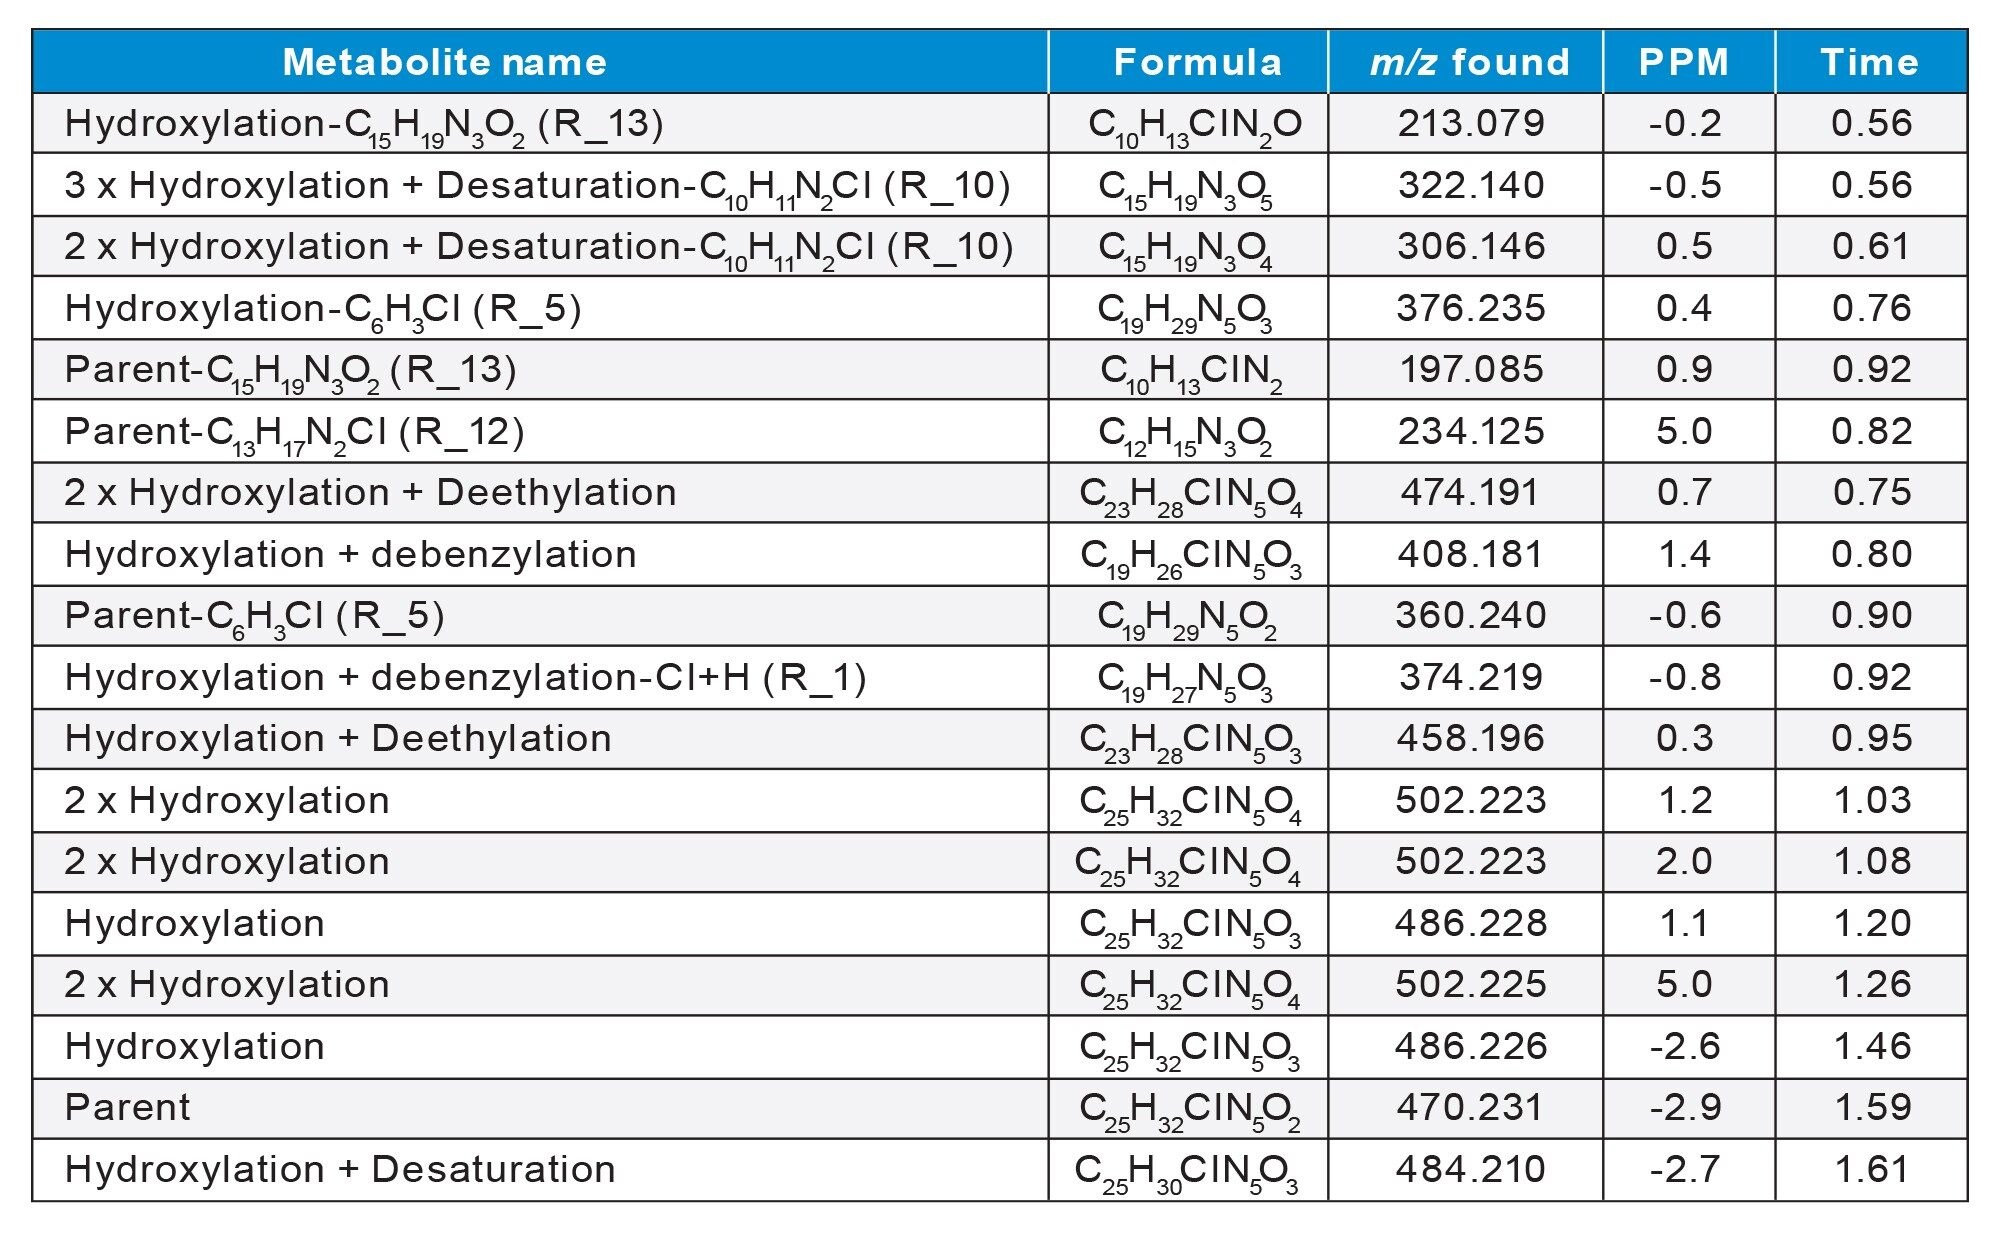
MSE data were processed and analyzed using MetaboLynx XS v2.0 Software. The first step in identification of metabolites was the interrogation of full scan exact mass information. The built in chemical intelligence in MetaboLynx XS v2.0 Software automatically predicts parent-specific metabolism, while maintaining vigilance in the search for unexpected metabolites. The results for human microsomal Met ID are shown in Table 1. Table 1 shows that two hydroxylation (+15.9949 Da) metabolites have been detected. Confirmation of this assignment and elucidation of their structure require additional information. Features were aligned to remove unrelated background and co-eluting fragment ions, which provided clean and accurate fragment spectra. It was possible to confirm the biotransformation, and infer at which point modification in the structure occurred.
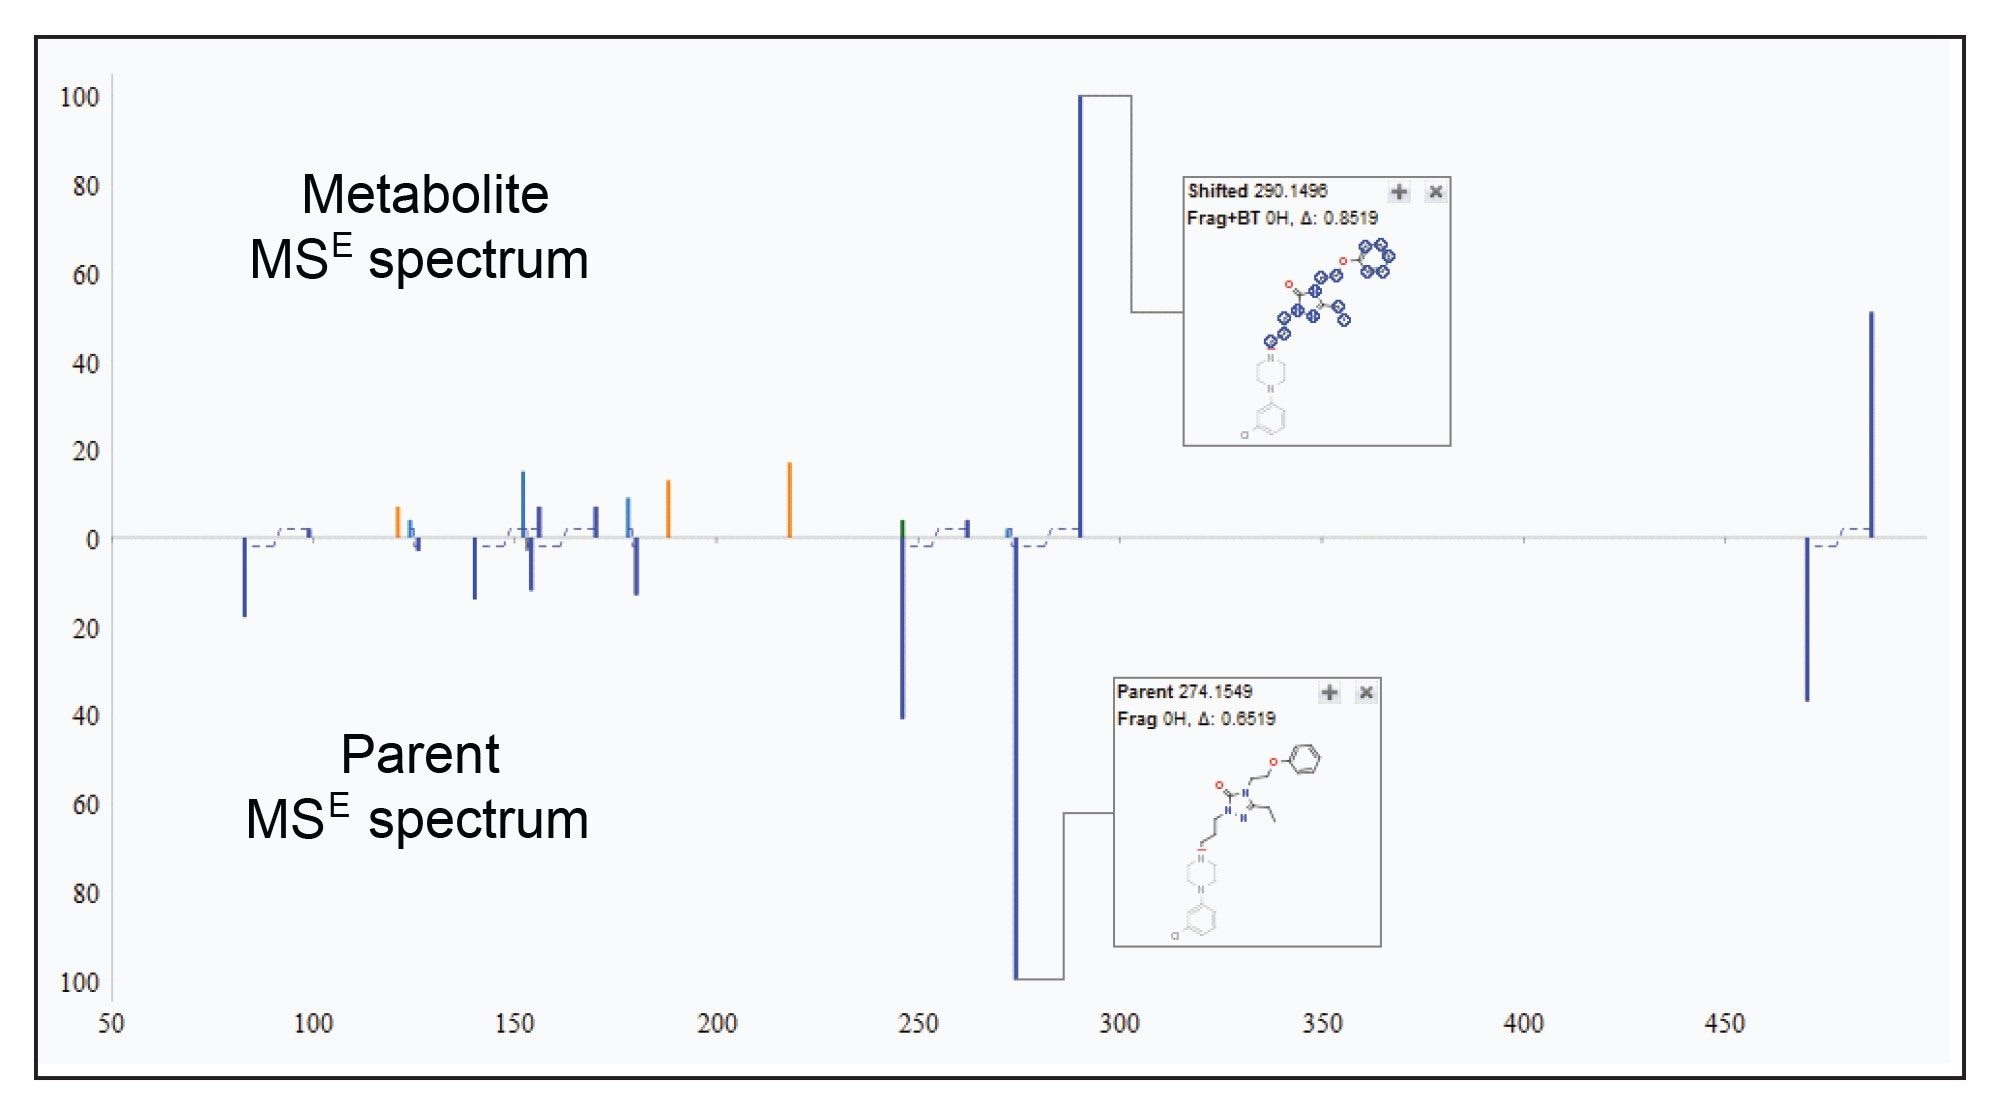
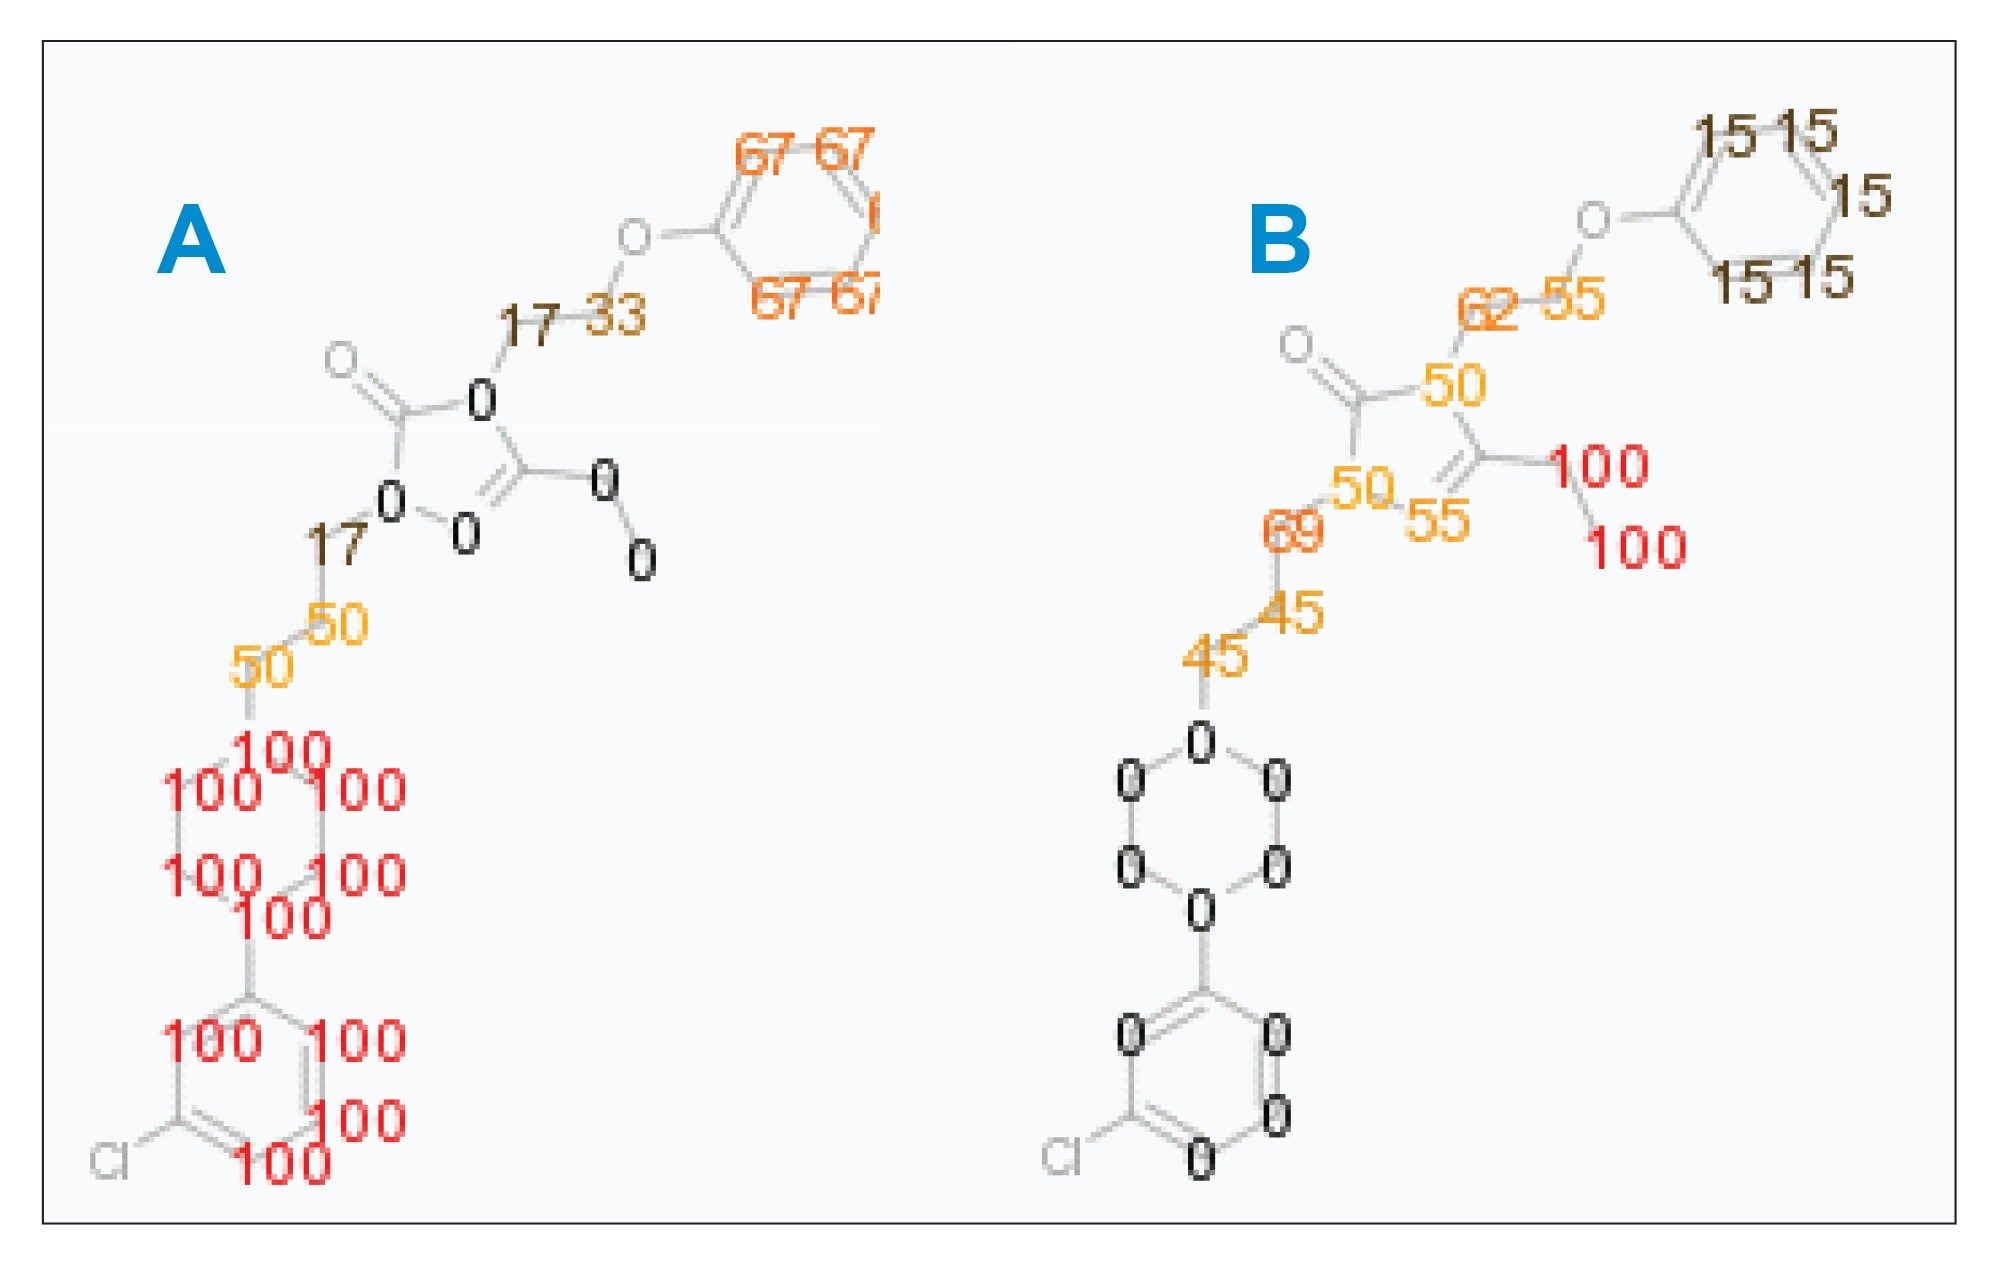
MSE data from the parent compound and the metabolite were automatically compared to determine the site of metabolism in a fully interactive spectral viewer, as shown in Figure 1. This information is displayed as a heat map, as shown in Figure 2, with scoring ranging from 0 to 100. A score of 100% (red) confirms that every identified fragment supports the fact that the biotransformation occurred at that specific site, while a score of 0% (black) indicates that none of the data support an assignment in this region of the molecule.
Figure 2 shows this scoring for the two detected hydroxylations of nefazodone. The heat map shows the biotransformation occurring on different parts of the molecule. The earlier eluting metabolite is designated as an aromatic hydroxylation, the later as an aliphatic hydroxylation.
Conclusion
We have demonstrated the use of a generic MSE data acquisition and automated methodology for the determination of metabolic soft spots. These tools, in addition to the existing metabolite identification workflow, continue to redefine the quality and quantity of information, which is easily accessible from a single acquisition. This method can facilitate a more efficient transfer of knowledge among disparate groups, and can ultimately drive the drug discovery process forward.
References
- Kalgutkar AS, Vaz AD, Lame ME, Henne KR, Soglia J, Zhao SX, Abramov YA, Lombardo F, Collin C, Hendsch ZS, Hop CE. Bioactivation of the Nontricyclic Antidepressant Nefazodone to a Reactive Quinone-Imine Species in Human Liver Microsomes and Recombinant Cytochrome P450 3A4. Drug Metab Dispos. 2005 Feb;33(2):243–53. Epub 2004 Nov 2.
Featured Products
720003918, March 2011