• Application Note

Structural Analysis of the Amyloidogenic Immunoglobulin Light Chains Directly From Serum by Online Immunoaffinity Isolation

Structural Analysis of the Amyloidogenic Immunoglobulin Light Chains Directly From Serum by Online Immunoaffinity Isolation

  • H. Robert Bergen Ill
  • Roshini S. Abraham
  • Stephen Naylor
  • Mayo Foundation
Plasma in the hands of a nurse in surgical operation room

For research use only. Not for use in diagnostic procedures.

Abstract

This application note demonstrates structural analysis of the amyloidogenic immunoglobulin light chains directly from serum by online immunoaffinity isolation.

Introduction

Primary systemic amyloidosis (AL) is characterized by the overproduction of immunoglobulin light chain proteins by a monoclonal, terminally differentiated B-lymphocyte, or plasma cell clone. The free immunoglobulin light chain gets deposited in an abnormal conformation as amyloid in a variety of organs in the body. The mechanism of amyloid formation is not well understood, but appears to be associated with some form of cleavage of the immunoglobulin light chain with subsequent aggregate formation.1 The nature of these aggregates is not well understood, but appears to involve some form of beta-sheet structure, which makes the protein insoluble. The fibrils are 8-10 nm in diameter. The modified proteins (amyloid fibrils) are deposited in diverse tissues, but involvement of the heart, liver, kidney, lung, skin, tongue, thyroid, and intestine are common. Restrictive cardiomyopathy is the presenting feature in one third of cases and the cause of death in 50% of AL patients.2 Interestingly, it is usually fragments of intact proteins and not the wholeintact precursor proteins, which comprise the deposit.3 These light chain fragments are formed by proteolytic cleavage of the precursor light chains by some unknown mechanism. 

Current diagnostic methods include staining of tissue biopsies or immuno-detection of cytoplasmic light chains in bone marrow biopsies. These methods give no information on the morphology of the light chains, however. In an effort to elucidate the structural basis of the immunoglobulin light chain that forms amyloid, in this disease, we developed an online assay for kappa and lambda light chains utilizing an immunoaffinity cartridge specific for each protein's constant region. The immunoaffinity cartridge effluent is coupled to an electrospray ionization-mass spectrometer for final analysis. Starting with 25 µL of serum, light chain is purified, desalted and analyzed in a completely automated procedure. Our initial results indicate that both kappa and lambda free light chains can be easily detected and characterized. These results demonstrate the diagnostic power of this on-line platform technology for the analysis of components from complex mixtures. Although no treatment currently causes the mobilization of amyloid from affected tissue, treatments which can lower the supply of precursor molecules can result in regression of deposits.4 This diagnostic platform will be useful in providing structural details of the amyloidogenic precursor molecules that comprise the amyloid deposits. Details of the analysis will be presented.

Experimental

Sample and Sample Preparation

Serum samples are filtered through a 25 mm syringe filter (Acrodisc 0.8/0.2 µm Supor, Pall Corp. Ann Arbor, Ml) prior to use and then diluted 1:1 with phosphate buffered saline, pH 7.4. Forty microliters of this diluted serum was injected.

Equipment

A Micromass Quattro LC Mass Spectrometer operated in positive ion mode was equipped with a standard ZSpray source. The source temperature and desolvation temperature were 90 °C and 150 °C respectively. A cone voltage gradient of 68 V at 1000 m/z and 88 V at 2500 m/z and capillary voltage of 3.3 kV was utilized. Cone gas flow was 57 L/hr and desolvation gas flow was 410 L/hr. Two-second continuous scans from 600 to 2200 amu with a two-second interscan delay were utilized. Scans containing the eluted light chains were summed and processed.

The chromatography system was a Waters Alliance HT System (50 µL/min; isocratic, A: Phosphate Buffered Saline) with auxiliary fluid delivery using a Waters 600 pump (50 µL/min; isocratic, B: 100 mM glycine, pH 2.5) and two LC-10ADvp pumps with a SCL-10Avp Controller (50 µL/min; C: 98/2 water/acetonitrile with 0.2% formic acid, D: 5/95 water/acetonitrile with 0.2% formic acid). The Waters Alliance HT System was controlled by Micromass MassLynx Software(v. 3.4). 

Three automated two-position valves (Rheodyne L.P., Rohnert Park, CA) were controlled with the contact closure outputs of the Waters 2790 Separations Module.

Event sequence of online analysis of immunoglobulin light chains from human serum.
Table 1. Event sequence of online analysis of immunoglobulin light chains from human serum.

Procedure

Affinity column preparation

Polyclonal antibodies specific to free kappa and free lambda light chains (gift from Dr. A. R. Bradwell and The Binding Site, Ltd., Birmingham, England) were coupled to POROS AL media utilizing the "bulk" method as per the manufacturer's instructions. Approximately 2 mg of protein were coupled to 25 mg of affinity resin. Individual microbore guard columns (1 x 20 mm PEEK, Upchurch Scientific, Oak Harbor, WA) were packed with the anti-free kappa light chain or anti-free lambda light chain POROS media (~17 µL bed volume). Binding buffer was 10 mM phosphate pH 7.4, 150 mM NaCl. Elution buffer was 0.1M glycine pH 2.5. Bound light chain was washed with binding buffer for six minutes prior to elution with elution buffer (step gradient) for three minutes.

Protein trap/desalting column

A 1 x 20 mm PEEK microbore guard column packed with 40 µm CA silica (Bakerbond Prepscale WP Butyl (C4), J.T. Baker Research Products, Mallinckrodt Baker, Inc., 222 Red School Lane, Phillipsburg, NJ) was utilized to desalt the immuno-purified light chain prior to MS analysis. Elution of the desalted protein from this trap was via an organic gradient utilizing the C/D pumps. The gradient program was 2% D for three minutes (de-salts bound light chain), two minute linear gradient to 95% (elutes light chain), three minutes at 95% D, one minute linear gradient to 2% C (return to starting conditions).
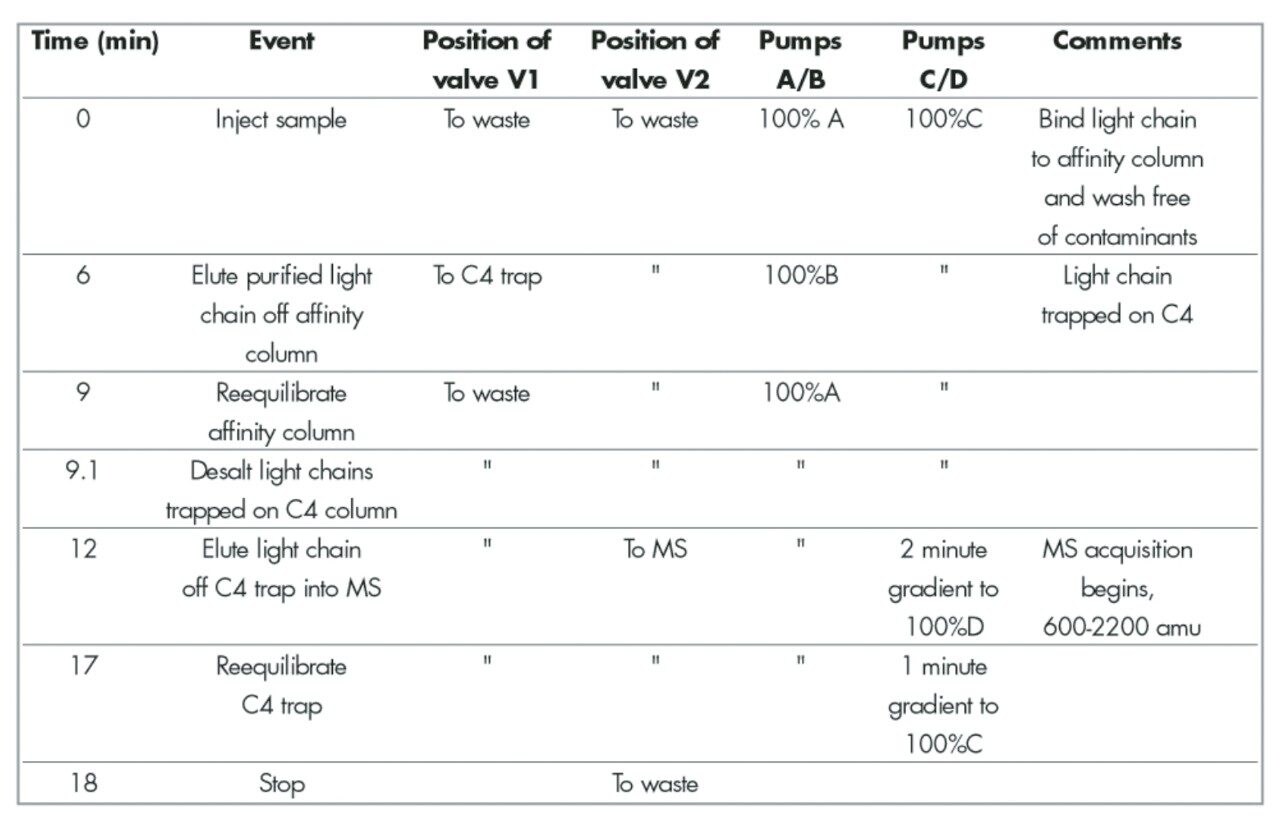
Event sequence

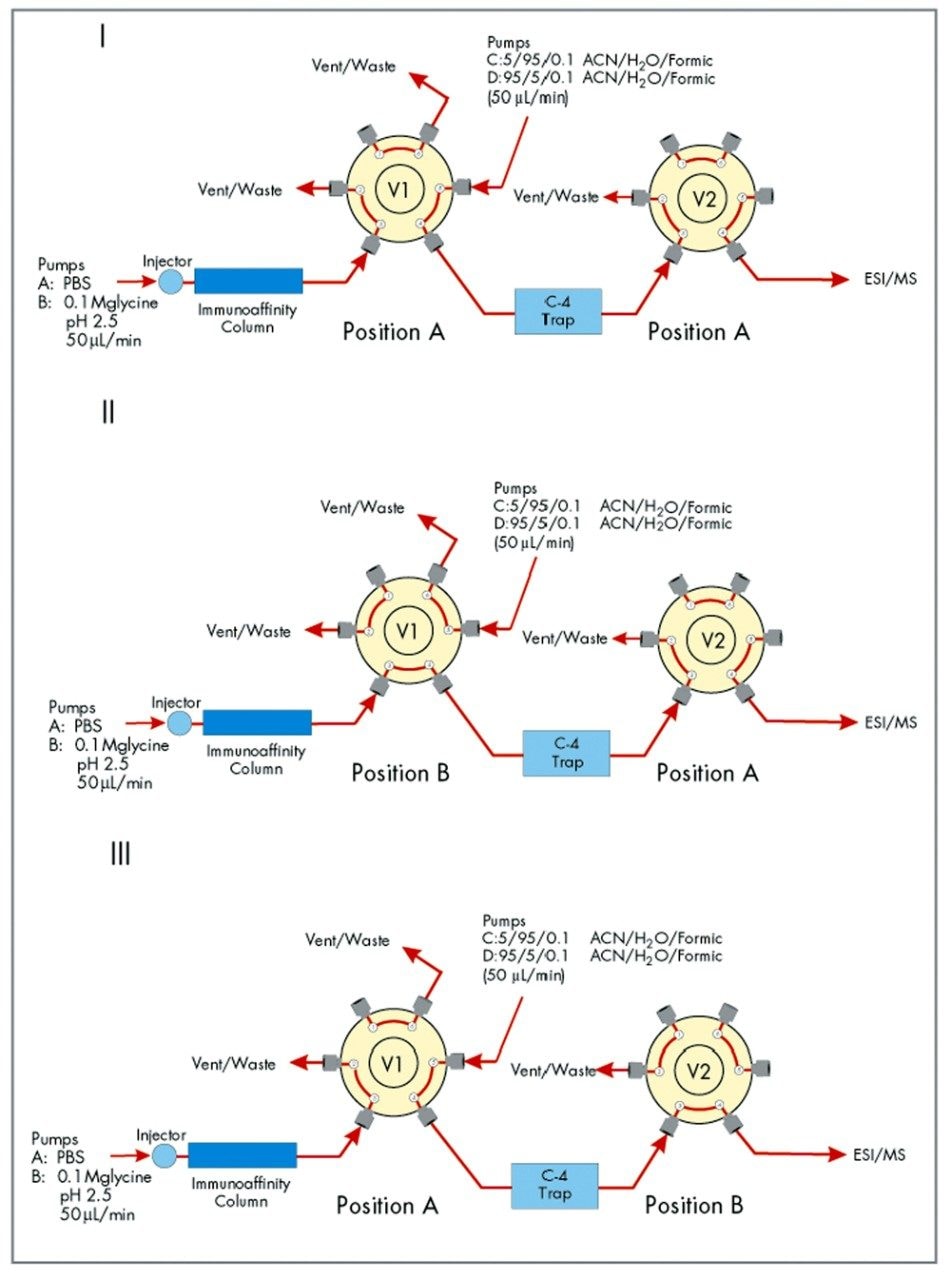
One two-position valve is positioned prior to the affinity column and is plumbed to switch between binding buffer (A: PBS) and elution buffer (B: 0.10 M glycine, pH 2.5). Another two-position valve V1 is plumbedto allow effluent from the affinity cartridge to flow to waste during the binding and washing periods and to the C4 trap during elution of bound light chain. The valve V2 is used as a divert valve to divert buffer salts from the ESI source.

Briefly, at time zero a sample is injected. Light chain binds to the affinity cartridge while valve V1 diverts unbound serum components to waste leaving light chain bound to the affinity cartridge. At t=6 minutes valve V1 diverts affinity column effluent onto the C4 trap. The light chain bound is released by switching to elution buffer B (6–9 minutes) and the eluted light chain is trapped on the C4 cartridge. Valve V1 returns (9 minutes) to its original position diverting the affinity cartridge effluent to waste allowing pumps C/D to pump across the C4 trap. Valve V2 diverts the first three minutes of the organic gradient (100% C, 9.1–12 minutes) to waste preventing any buffer salts from entering the source. At t=12 minutes valve V2 takes effluent from the C4 trap into the ESI source. A two minute gradient to 100% D (12–14 minutes) elutes light chain (~16 minutes) from the C4 trap. The gradient stays at 100% D (14–17 minutes) before coming back to 100% C (17–18 minutes).

Results and Discussion

The schematic of Figure 1 indicates how the columns, valves, pumps and MS are connected. Micromass Masslynx Software controls the Waters Alliance HT HPLC System directly. Contact closure outputs from the 2790 Separations Module are utilized to control the valves and to initiate the organic gradient which elutes light chains off the C4 reversed phase trap. An example of the multiply charged spectra of a free kappa and free lambda light chains are shown in Figure 2. Transformation of spectra like those in Figure 2 by MaxEnt processing result in a true mass scale spectra as shown in Figure 3 and Figure 4. No mathematical artifacts are generated by the MaxEnt processing.

Schematic of online analysis of immunoglobulin light chains.
Figure 1. Schematic of online analysis of immunoglobulin light chains. I) Binding of light chains to immunoaffinity column and washing bound light chains. II) Elution of purified light chains from immunoaffinity column and trapping on C-4 reversed phase trap. Ill) Elution of desalted purified light chains from C-4 reversed phase trap.
The multiply charged spectra of a typical free kappa and a typical free lambda light chain.
Figure 2. The multiply charged spectra of a typical free kappa and a typical free lambda light chain are shown. The kappa light chain in this spectra is predominately a monomer (Mr = 23,580) while the lambda light chain in this spectra is predominately a dimer (Mr = 45,550).
Four examples offree lambda light chains.
Figure 3. Four examples of free lambda light chains. The multiply charged spectra were converted to a relative mass scale using MaxEnt. These four patients indicate the extent of heterogeneity. Monomers, dimers and truncations are readily identified.

The free kappa light chain spectras show that monomers are the predominant form (Figure 4). The monomeric masses vary from 23,445 to 23,620 amu (175 amu) with an average mass of 23,546 amu. The presence of dimers is clearly seen at masses almost double. In all instances, the masses of the dimers are less by 220-250 amu indicative of some cleavage concomitant with dimer formation. Additionally, truncations are seen at 8,935, 9,310 and 10,695 amu which correspond to masses which can be found in the constant region of the kappa light chain. The anti-free kappa light chain antibodies are specific for the constant region of the kappa light chains and would bind to portions of the constant region during the immunoaffinity purification process.

Examples of free kappa light chains obtained from patient serum by online analysis of diluted serum.
Figure 4. Examples of free kappa light chains obtained from patient serum by online analysis of diluted serum. MaxEnt was used to transform the multiply charged spectra to a relative mass scale. The presence of monomers as well as dimers and truncated species are readily apparent.

The free lambda light chain samples examined do not show any identifiable trends. Monomers, dimers and truncated species all exist and are patient dependent (see Figure 3). The dimers are 0, 240 and 750 amu less than the mathematical doubling of the monomer molecular weights. Additionally, one patient shows a predominant monomeric form at 20,0195 amu, a dimer at 45,340 amu and a truncated form at 9,310 amu as the major light chain form present.

Conclusion

The immunoaffinity cartridge specific for the constant region of kappa or lambda light chain regions successfully purified monomers, dimers and truncated forms of kappa or lambda light chains online from patient serum. The method is rapid (<20 minutes) and specific. Unlike immunodetection techniques, the addition of mass spectral analysis allows for detailed scrutiny of the actual protein composition.

The patients analyzed to date show a great deal of heterogeneity associated with this type of amyloidosis. Monomers, dimers and truncated species are evident to varying degrees in a manner that seems to be patient specific. Dimer masses may or may not correspond fo a theoretical doubling of the monomeric mass indicating that dimer formation is sometimes associated with monomer cleavage. Kappa light chain dimers appear to follow a trend of losing either 240 amu or 500 amv. This pattern may correlate to the loss of the same moiety from one or both monomeric units of the dimer. Lambda light chain dimers do not appear to follow anyparticular trend as the dimer masses showed 0 amu, 240 amu or 750 amu lower masses than the theoretical doubling of the monomeric masses. Interestingly, the losses do appear to be integer multiples of a mass corresponding to approximately 240–250 amu. Thus one explanation could be that dimer formation is sometimes accompanied by concomitant loss of an unidentified moiety with mass of 240–250 amu.

One lambda light chain amyloid patient (patient 006) showed two monomeric species that differ by 160 amu which may correspond to a glycosylation site.

The masses that we have identified as truncated species at 9310, 10,215 and 12,580 amu in lambda light chain samples and 8935, 9310 and 10695 amu in kappa light chain patients correspond to masses that are associated with truncations of the corresponding light chain. Since these species contain epitopes that bound to the anti-light chain constant region antibodies contained in the immunoaffinity cartridge we feel confident that sequence analysis will confirm their identity.

In summary, this new online assay has proven robust and effective in confirming, identifying and characterizing the amyloidogenic precursors of patients diagnosed with primary amyloidosis. The speed (<20 minutes) and simplicity (filter and dilute serum) marks this as an excellent candidate for screening and characterization of primary amyloidosis patients. Evidence for truncated light chains and light chain dimers that indicate cleavage concomitant with dimer formation will have a significant impact on elucidating the etiology of this lethal disease.

References

  1. Gillmore, JD, Hawkins, PN, Pepys MB, Amyloidosis: A Review of Recent Diagnostic and Therapeutic Developments, British J. of Haematology, 99(2):245–256, 1997.
  2. Kyle RA, Greipp PR, O'Fallon M, Primary Systemic Amyloidosis: Multivariate Analysis for Prognostic Factors in 168 Cases. Blood, 68:220–224, 1986.
  3. Glenner GG, Amyloid Deposits and Amyloidosis: The Beta-Fibrilloses. I and Il, New England J. of Medicine, 302:1283- 1292 and 1333–1343, 1980.
  4. Hawkins PN, Persey AM, Vigushin DM, Richardson S, Seymour A, Homgren G, Steen L, Woo P, Hall A, Pepys MB, SAP Scintigraphy and Turnover Studies Demonstrate Regression of Amyloidosis, Nuclear Medicine Communications, 14:259–260, 1993.

720000732, March 2004

Back To Top Back To Top