Streamlined LC-MS/MS Data Processing with waters_connect™ for Quantitation: Application to Free Inositol Analysis in Foods
Jinchuan Yang, Stephanie Harden, Paul Rainville
Waters Corporation, United States
Published on February 16, 2026
Abstract
Liquid chromatography coupled with triple quadrupole mass spectrometry (LC-MS/MS) has been increasingly adopted by routine food testing labs for its superior analytical performance in terms of sensitivity, selectivity, specificity, accuracy, and throughput. However, the main barriers to adopting LC-MS/MS technology include the expertise and time required to interpret and process the exponentially larger data sets. waters_connect for Quantitation Software platform hosts a suite of browser-based applications for chromatographic data management. Among these, the MS Quan Application is specifically designed to streamline LC-MS/MS data processing and review. The aim of this work is to demonstrate the key advantages of MS Quan for data processing and review in LC-MS/MS analysis of free inositols in foods. LC-MS/MS data from a previous study, generated using an Arc™ Premier System coupled with a Xevo™ TQ-S cronos triple quadrupole Mass Spectrometer and an ACQUITY™ UPLC™ BEH™ Amide Column, were processed and reviewed with MS Quan. Key features of MS Quan, such as batch-level overview, task-oriented workflow, and exception-focused review, are demonstrated in the context of analyzing free inositols in foods.
Benefits
- Consolidated display of LC-MS/MS results for an entire batch on a single screen for rapid review
- Streamlined data processing and review of individual injections on a single screen, eliminating the need to switch between different screens
- Automated flagging of results that fall outside predefined normal ranges for thorough review
Introduction
LC-MS/MS is a powerful analytical technology that provides excellent analytical performance in terms of sensitivity, selectivity, specificity, accuracy, and throughput as compared to LC analysis coupled with conventional optical detection techniques, such as ultra-violet spectrometry, fluorescence spectrometry, or differential refractive index detection. LC-MS/MS analysis is less susceptible to sample matrix interference and is therefore often preferred for complex and challenging samples. On the other hand, however, LC-MS/MS often generates exponentially larger data sets, which require significant expertise and time to process. This challenge becomes even greater when many analytes are included in the analysis, and data processing can become the primary bottleneck in the entire LC-MS/MS analysis. The waters_connect for Quantitation Software platform was developed to address this challenge. This software hosts a suite of browser-based applications for chromatographic data management. Among these, MS Quan is an application specifically designed to streamline LC-MS/MS data processing and review.1 Previously, we developed an LC-MS/MS method for analyzing free inositol stereoisomers in a variety of foods.2 In this study, we focus on data processing and reviewing using MS Quan within waters_connect for Quantitation platform, demonstrating the capabilities of this powerful software for LC-MS/MS data processing and review in the analysis of free inositol stereoisomers in food samples.
Experimental
LC-MS/MS analysis of free inositols in foods was conducted on an Arc Premier System coupled with a Xevo TQ-S cronos triple quadrupole Mass Spectrometer, using an ACQUITY UPLC BEH Amide Column (1.7 μm, 2.1 mm x 150 mm, p/n: 186004802, Waters). Instrument control and data acquisition were managed by MassLynx™ 4.3 Software. The raw LC-MS/MS data and the processing method were uploaded to waters_connect for Quantitation platform. Full details regarding chemicals, standards, food samples, preparation of reagents, calibration standard solutions, samples, and LC-MS/MS analysis conditions can be found in a previously published study.2
Data Processing and Review
Method
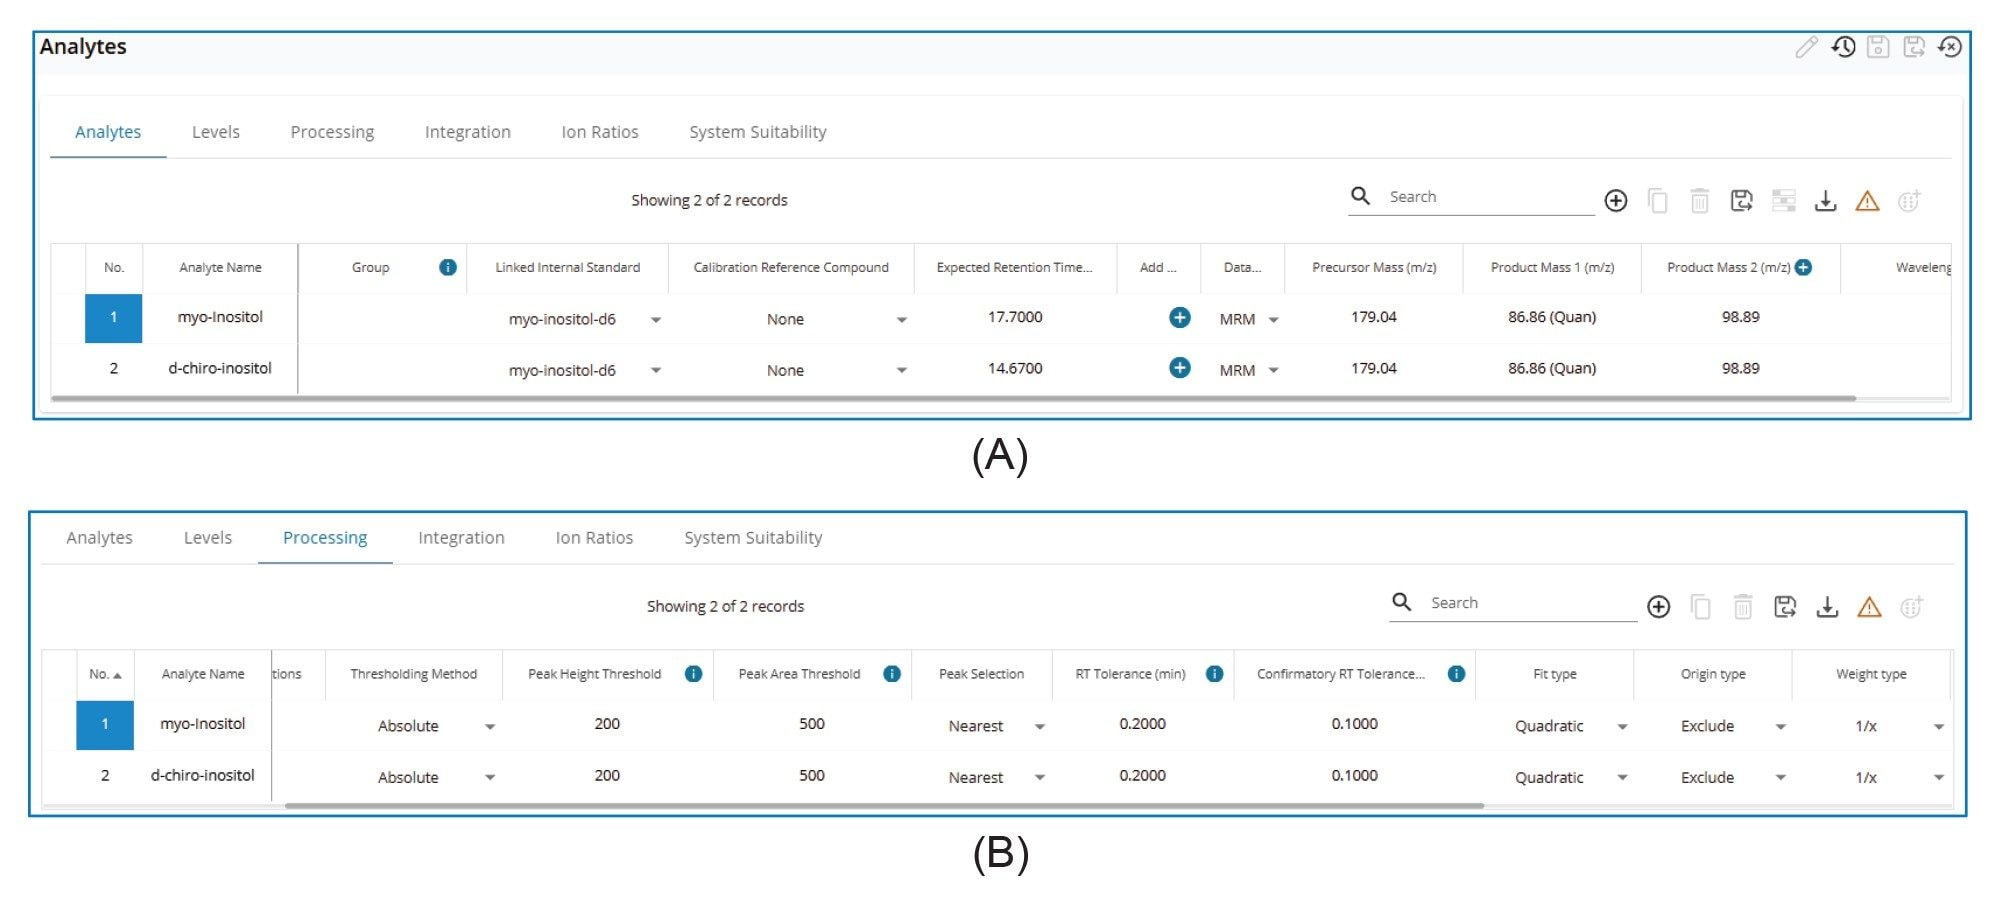
The LC-MS/MS processing method imported from MassLynx Software was used as the method template. Data processing parameters, including Expected retention time, Peak height threshold, Peak area threshold were reviewed and adjusted as needed to ensure proper data process. Figure 1 shows selected screenshots of the method.
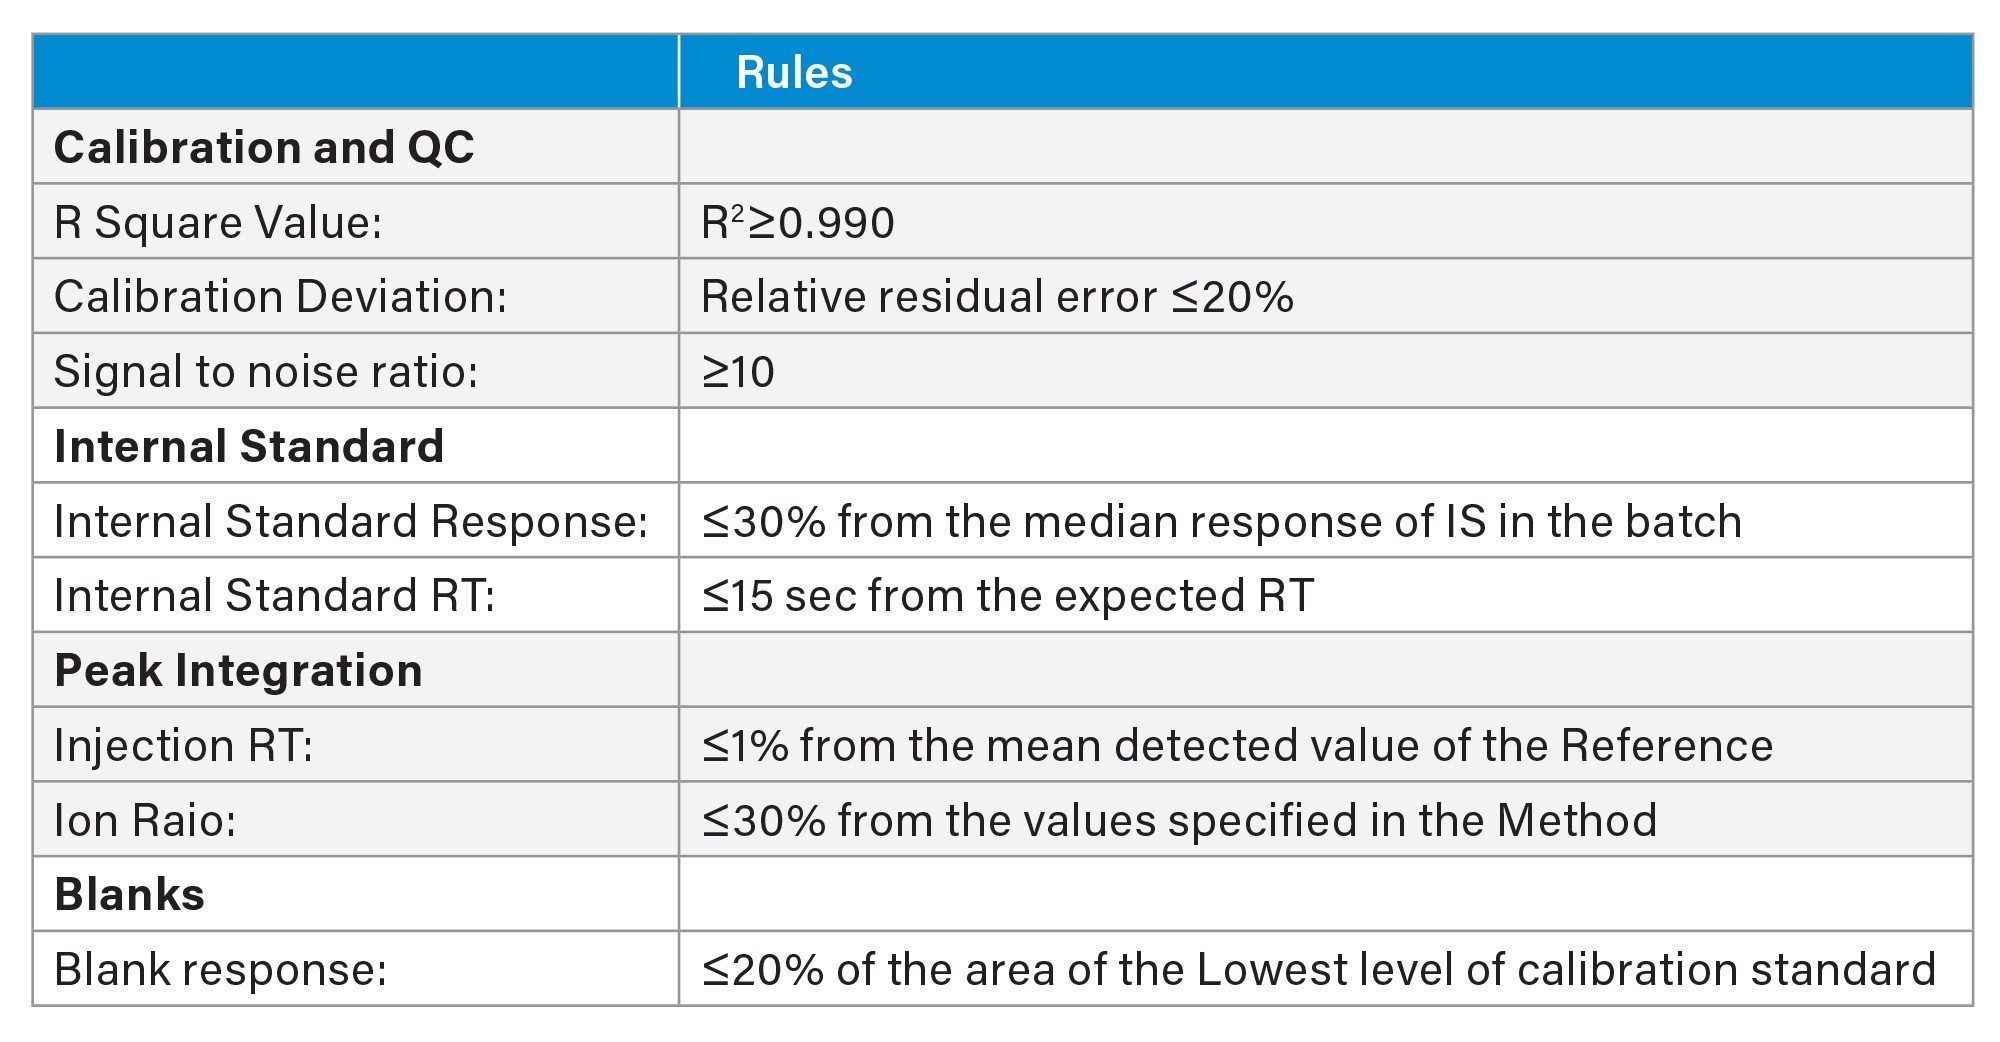
Rule Set
The Rule Set consists of user definable criteria established to flag abnormal results and prevent any improperly processed data from being overlooked. Details of the Rule Set applied in the LC-MS/MS analysis of free inositols in foods are provided in Table 1.
Overviews
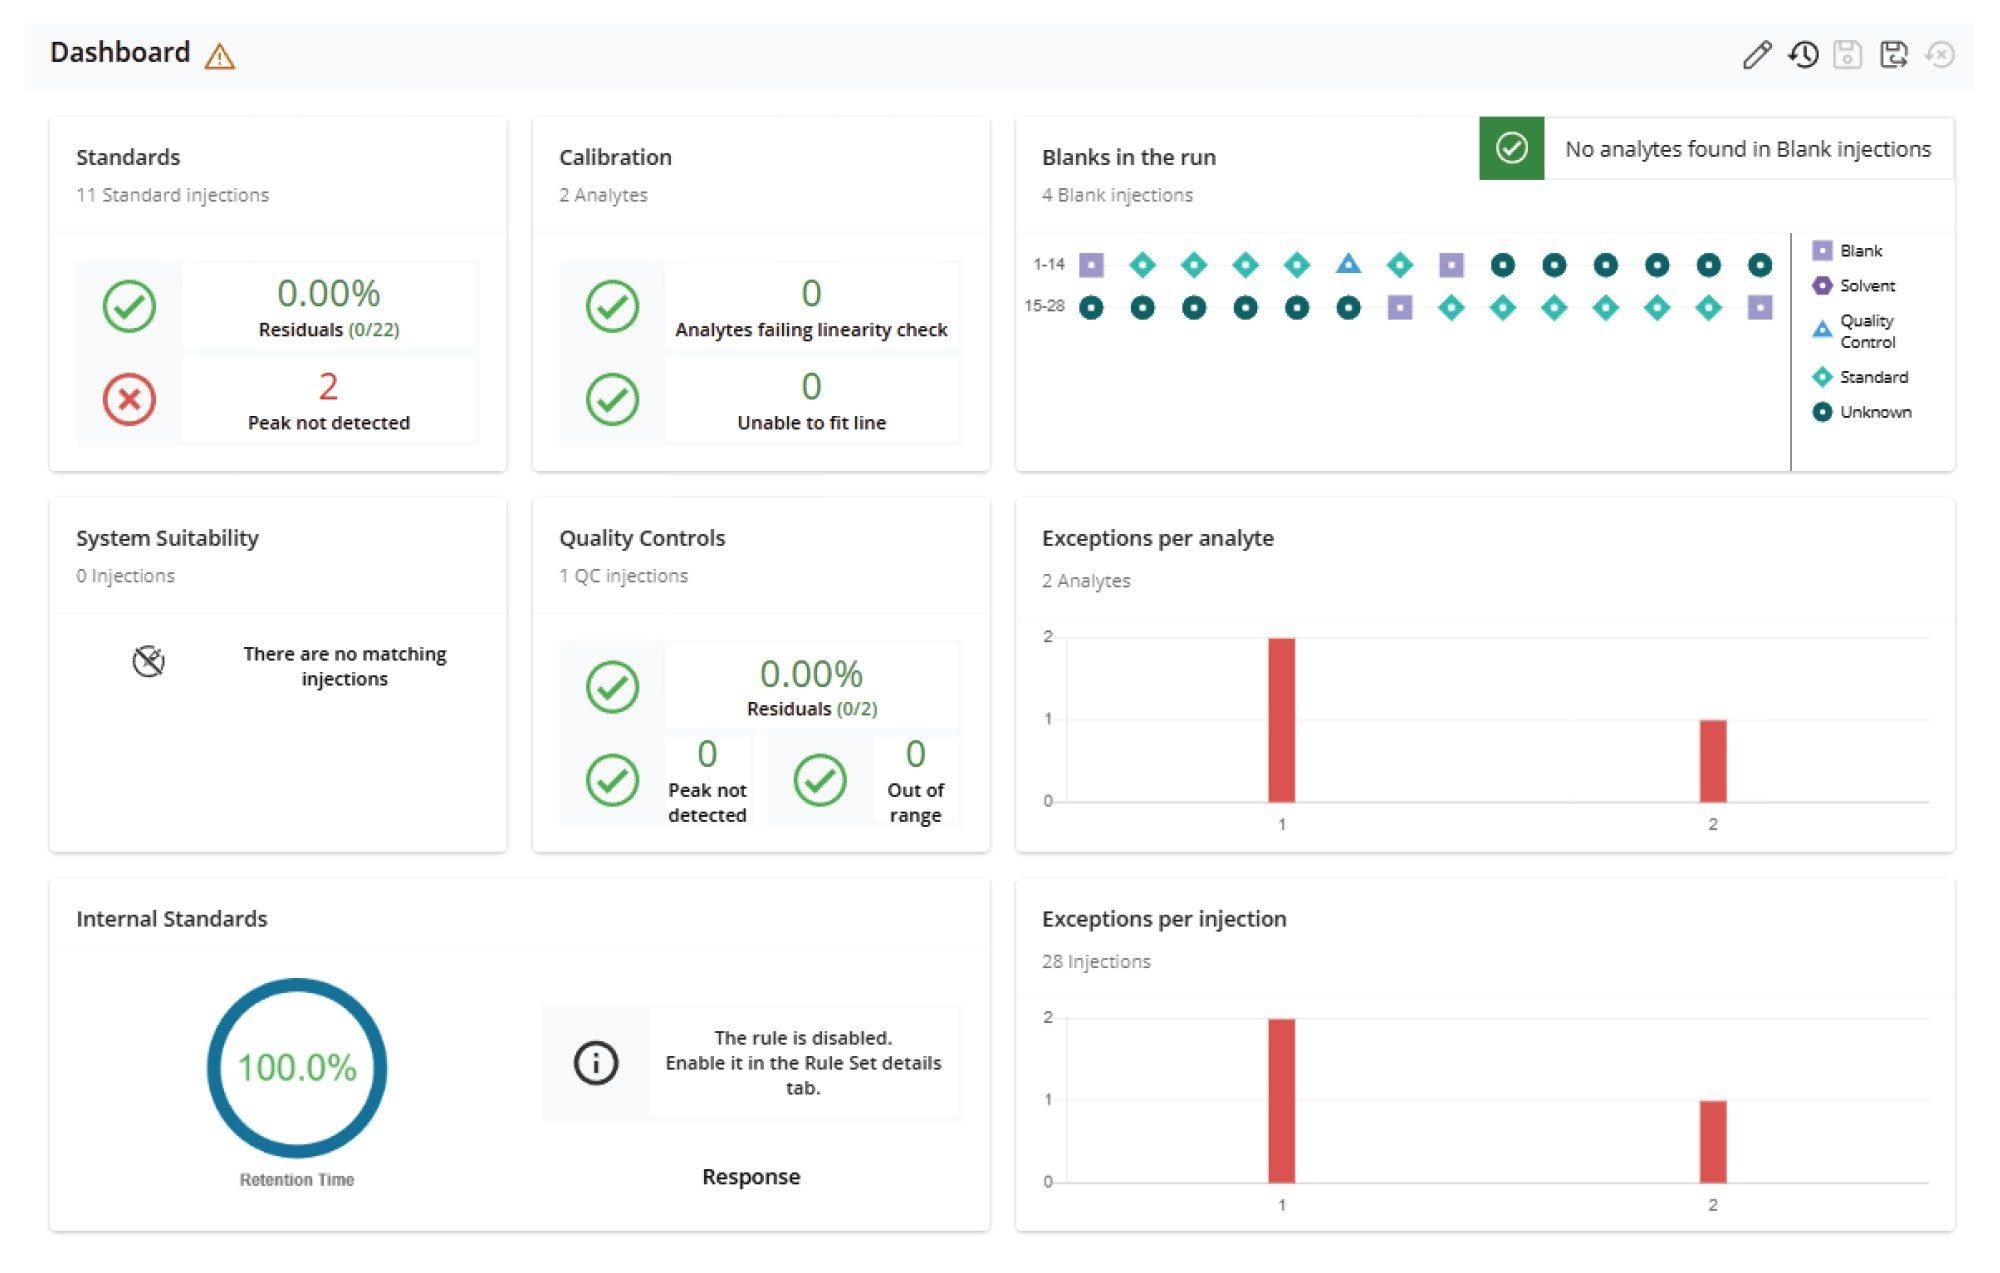
Dashboard
The Dashboard Overview (Figure 2) presents a high-level summary of the quality of processed results for all injections in a sample set.
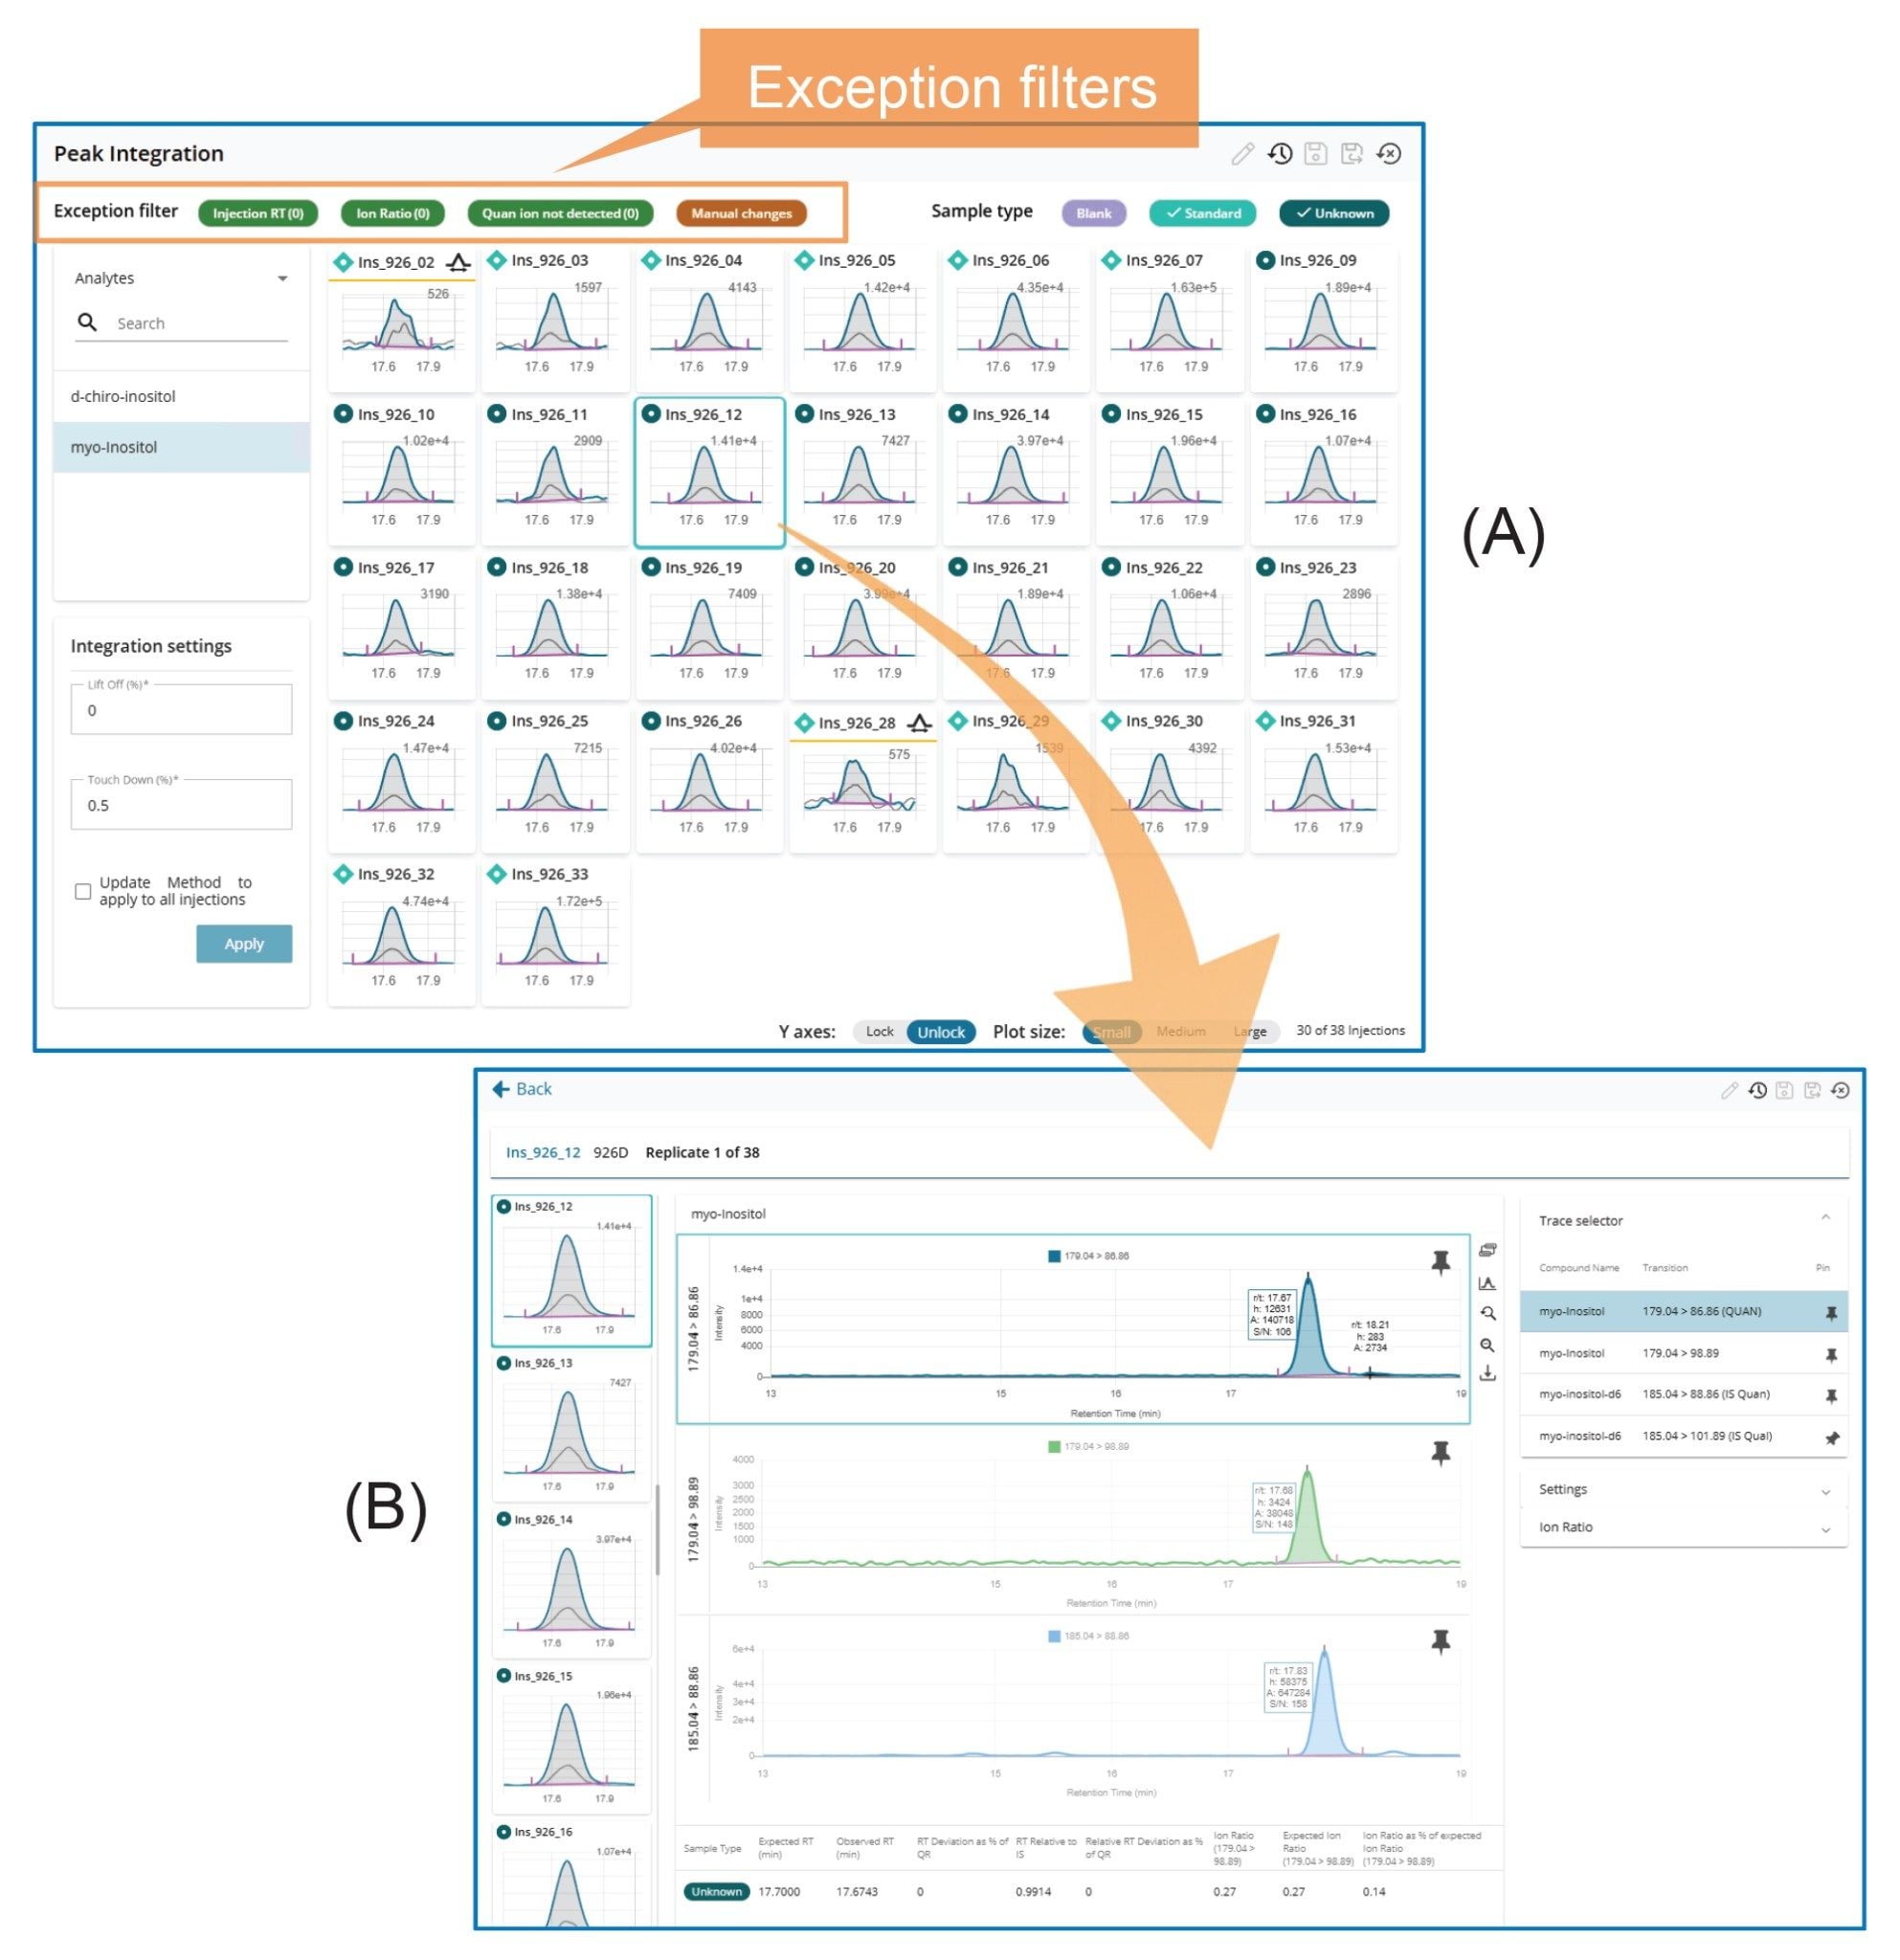
Peak Integration
The Peak Integration Overview (Figure 3A) displays all integrated peaks within a sample batch, including calibration standards, blanks, and samples. This enables a rapid, batch-level side-by-side review of integrated peaks across all injections. Further review of individual injections (Figure 3B) can be performed by simply (mouse) clicking on the corresponding chromatograms, as illustrated in Figure 3.
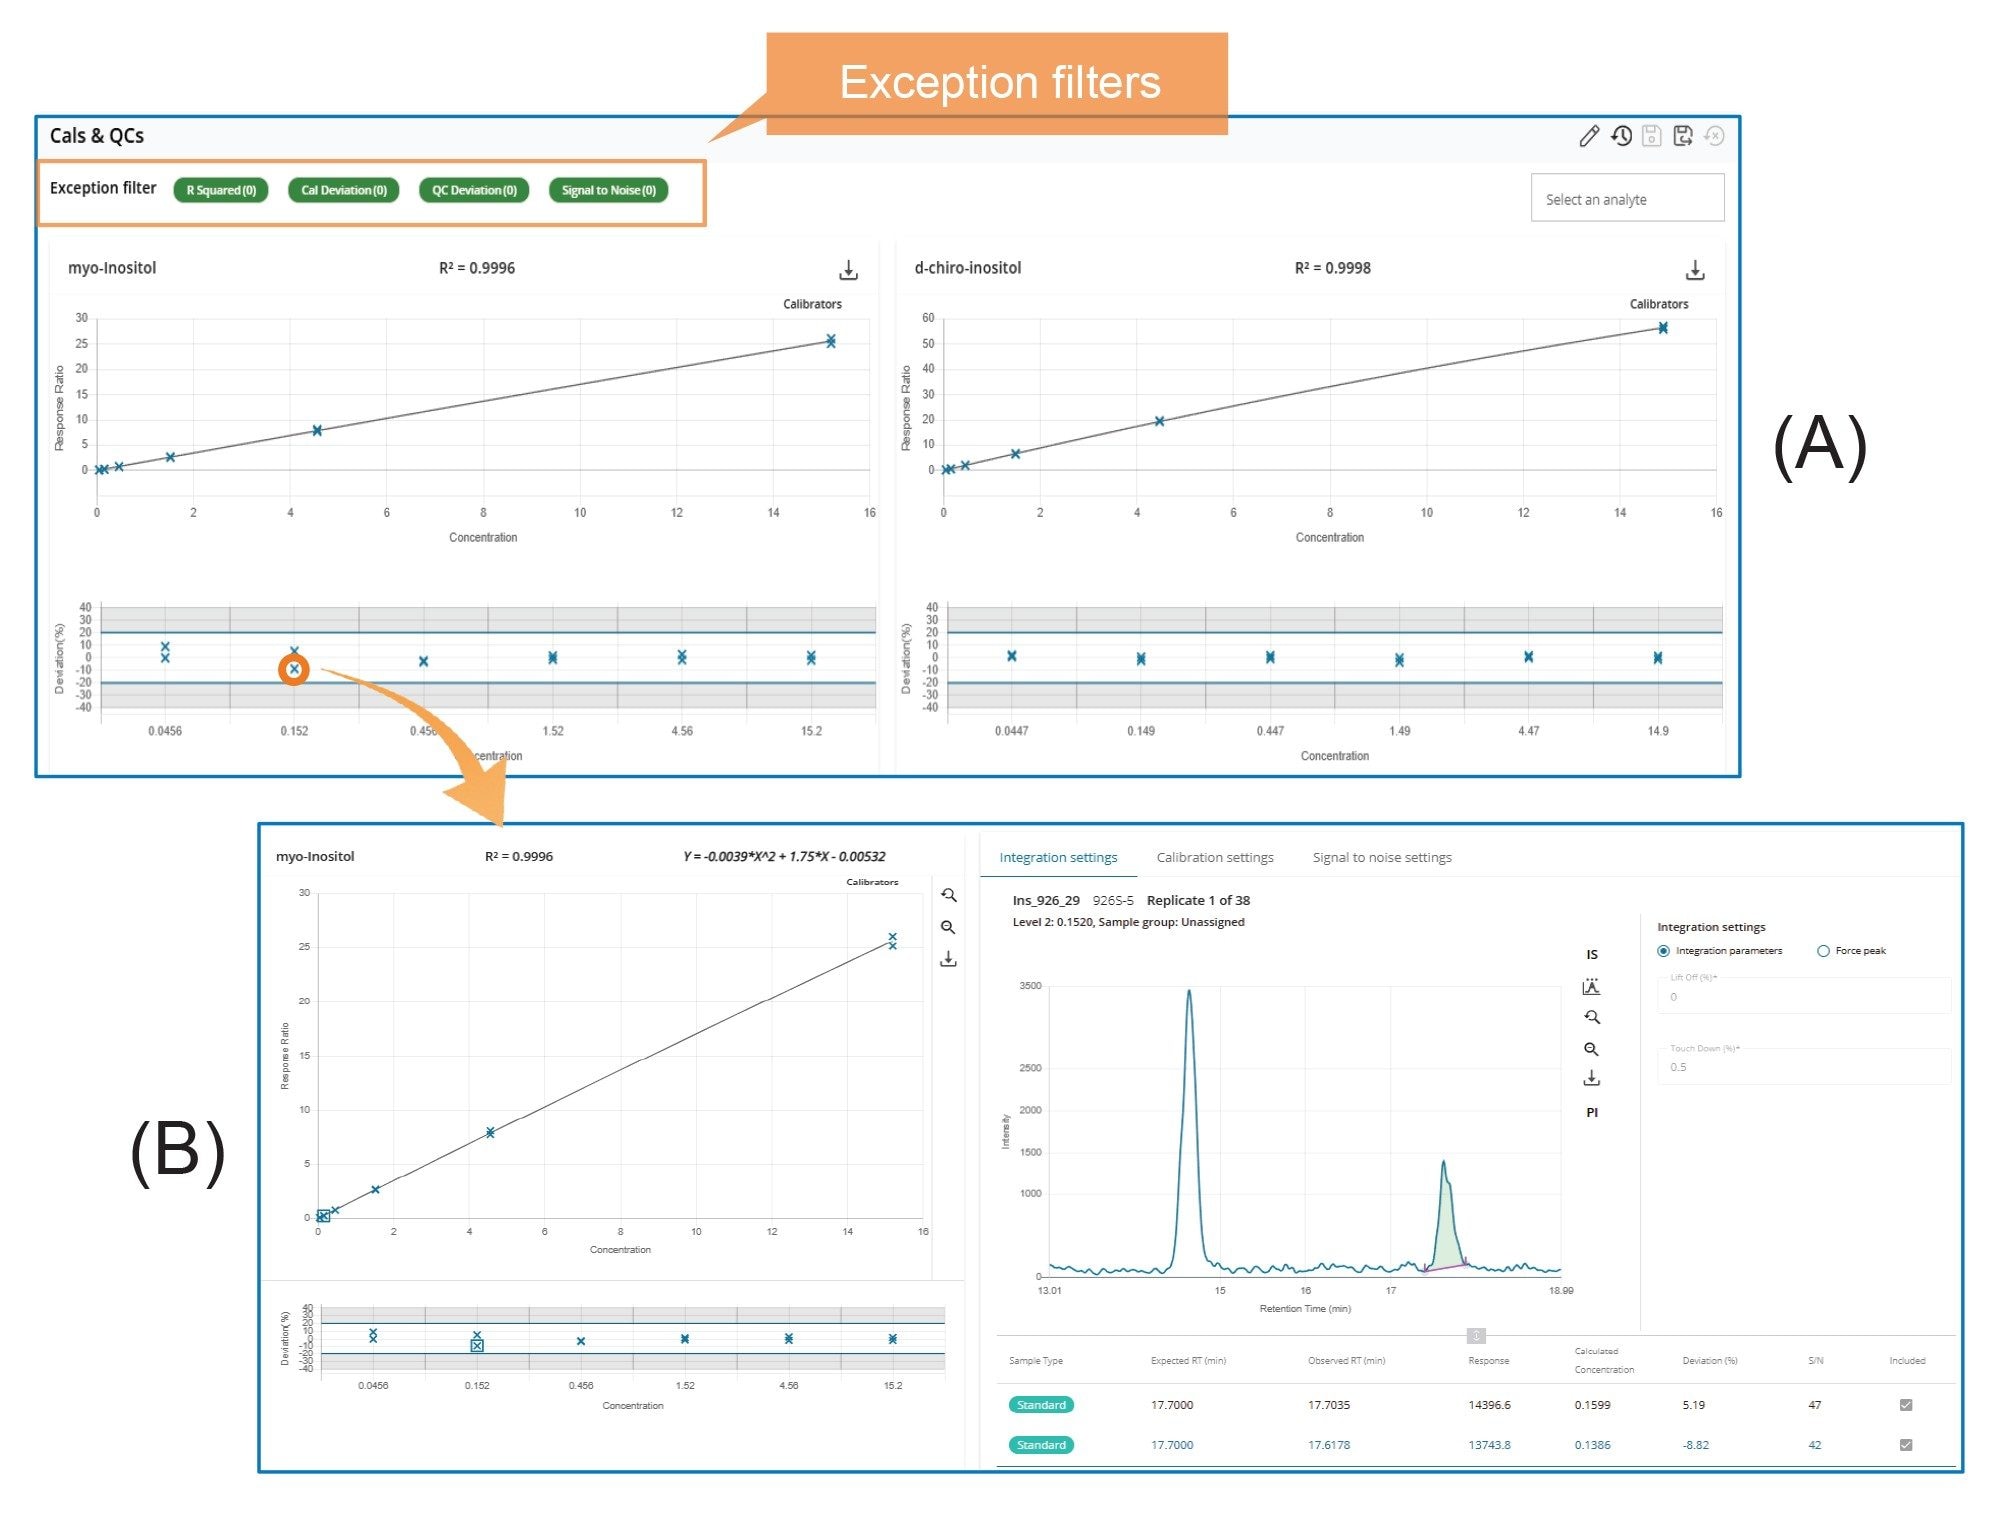
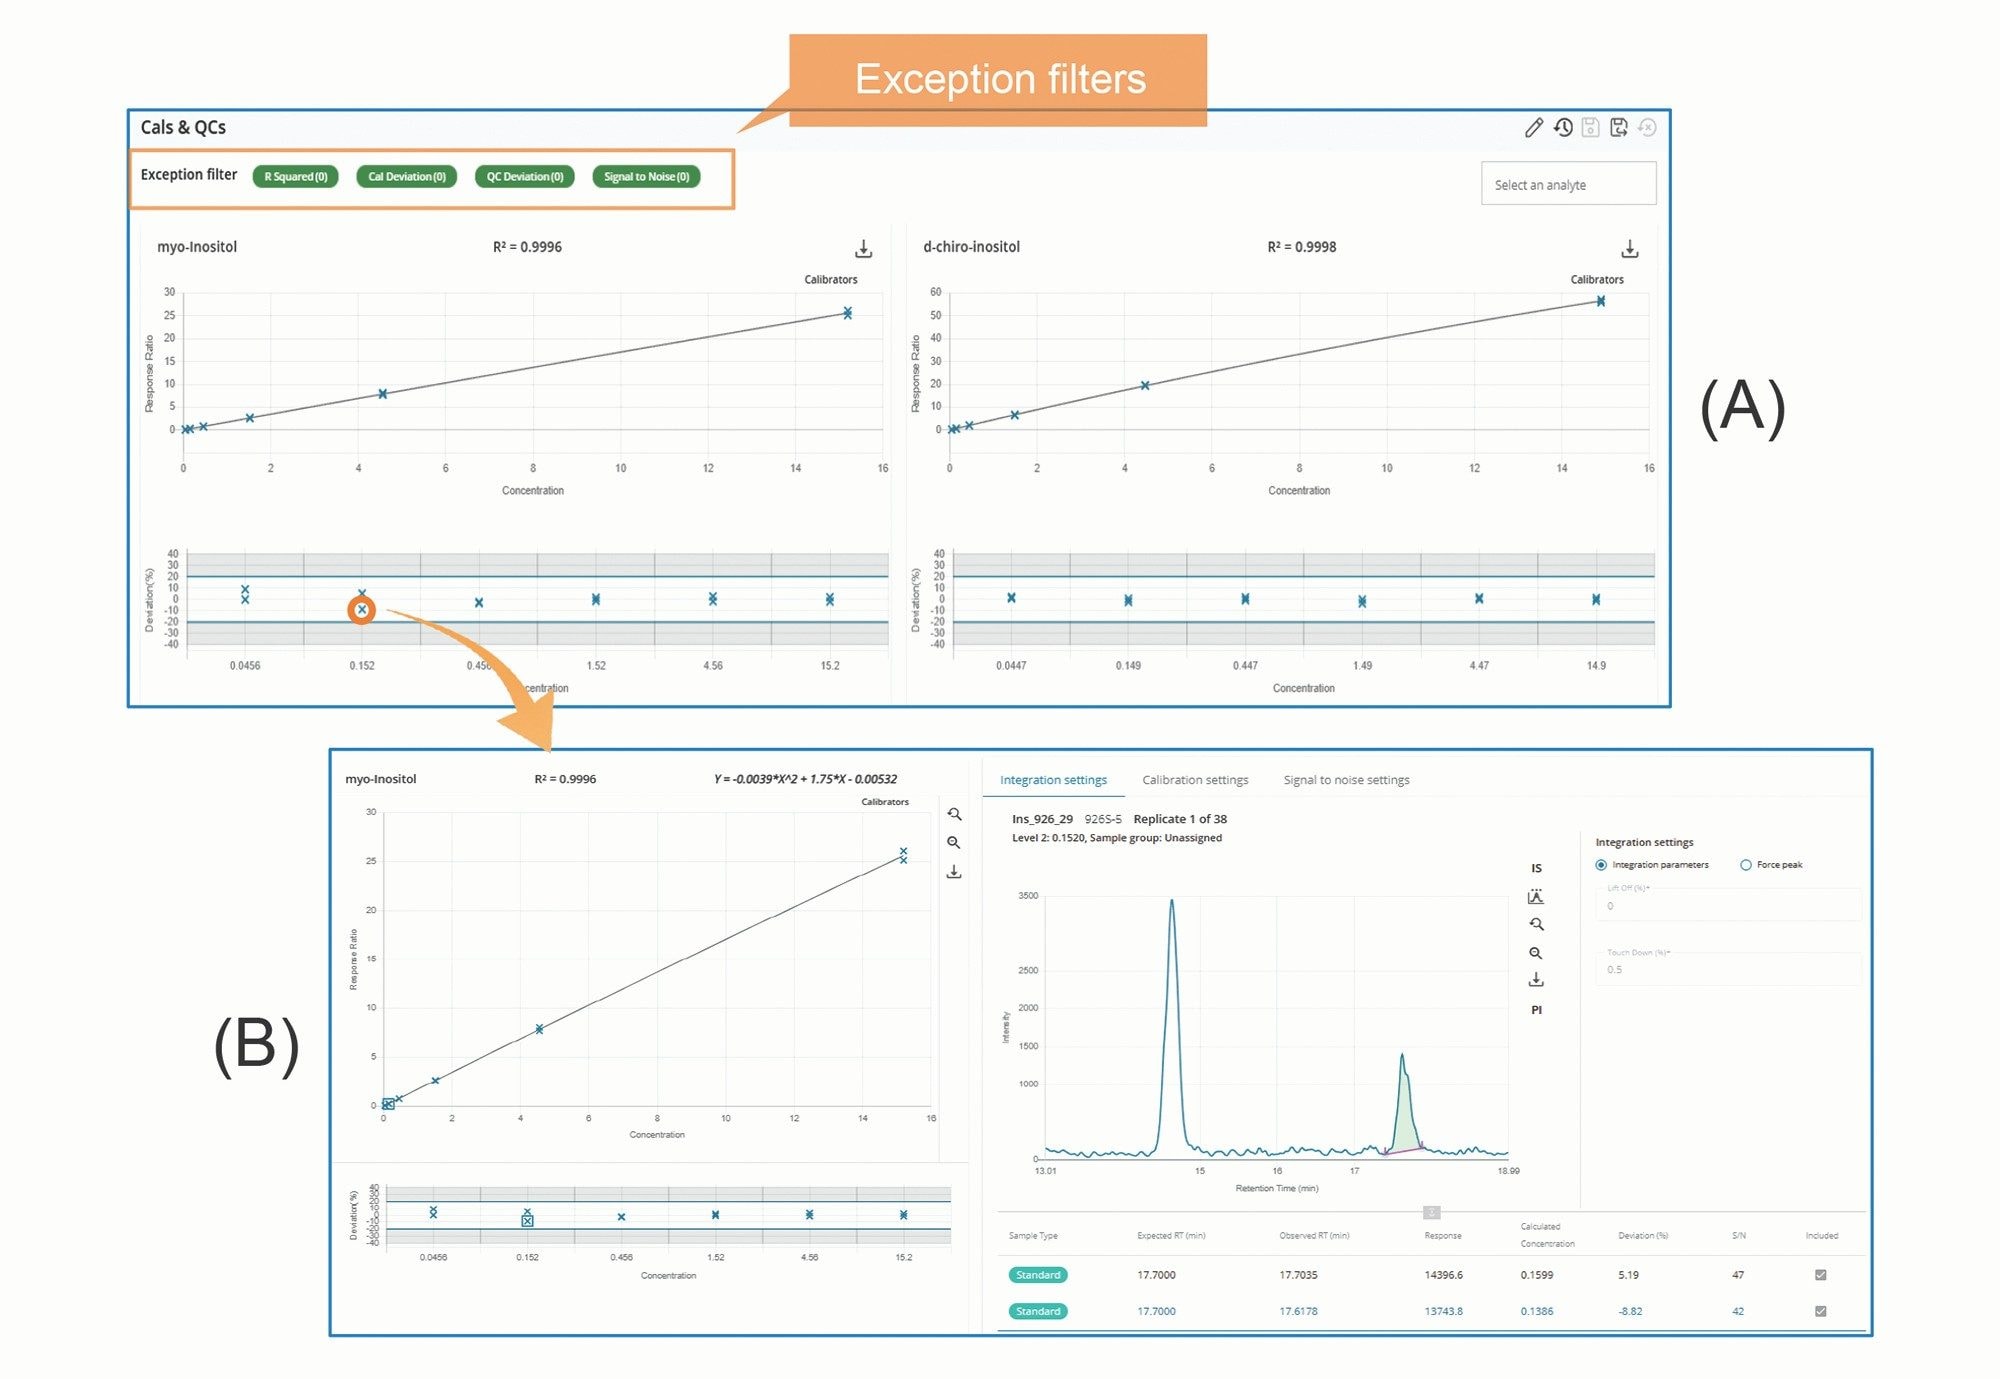
Calibration
Figure 4A presents screenshots of the Calibration and QC Overview. Further review of individual calibration data points (Figure 4B) can be performed by (mouse) clicking the corresponding data point in the plots, as illustrated in Figure 4.
Internal Standards
Figure 5A displays trend plots for the responses and retention times of internal standards in all injections. A detailed review of data from individual injections can be performed by (mouse) clicking on the corresponding data points within the trend plots (Figure 5B).
Results and Discussion
MS Quan streamlines LC-MS/MS data processing and review through features such as batch-level overviews, task-oriented workflows, and exception-focused reviews.1 All injections within a sample batch (or set) can be viewed on a single screen using various layouts, such as Dashboard, System Suitability, Calibration and QCs, Blanks, Internal Standards, Peak Integration, and Unknowns layout. Each layout is designed to facilitate specific data processing tasks. For example, Figure 2A shows a screenshot of the Peak Integration Overview layout, which displays all integrated peaks in enlarged retention time windows side-by-side on a single screen. This layout design enables rapid review and comparison of integrated peaks across all injections. Another example is the Calibration & QCs Overview layout (Figure 3A), where calibration plots for all analytes, along with their residual plots and QC plots, are presented side-by-side for quick assessment of calibration and QC results. Similarly, Figure 4A shows the Internal Standard Overview layout, which presents trend plots for responses and retention times of internal standards across all injections within a sample batch on a single screen. These trend plots make it easy to identify any emerging pattern in response or retention time within the batch.
Furthermore, a detailed review of any individual injection can be performed by clicking on the corresponding data point or chromatogram on the Overview screens. This opens the individual injection review page, where chromatograms, results, and processing parameters are conveniently arranged on a single screen (see Figures 2–4). Depending on the task, the screen displays task-specific results and processing method parameters. This task-oriented layout significantly simplifies data review and processing by eliminating the need to navigate between multiple screens for method parameters, results, and peak integration, a common issue encountered in many existing software.
The third key feature of MS Quan is its use of a Rule Set to automatically flag results that fall outside user predefined normal ranges (Exceptions) for thorough review and verification. All exceptions are clearly marked and can be easily accessed by applying the Exception filters on the Overview pages (see Figures 2-4). This functionality allows reviewers to quickly identify exceptions and conduct detailed evaluations to verify results, minimizing the risk of errors caused by improper processing.
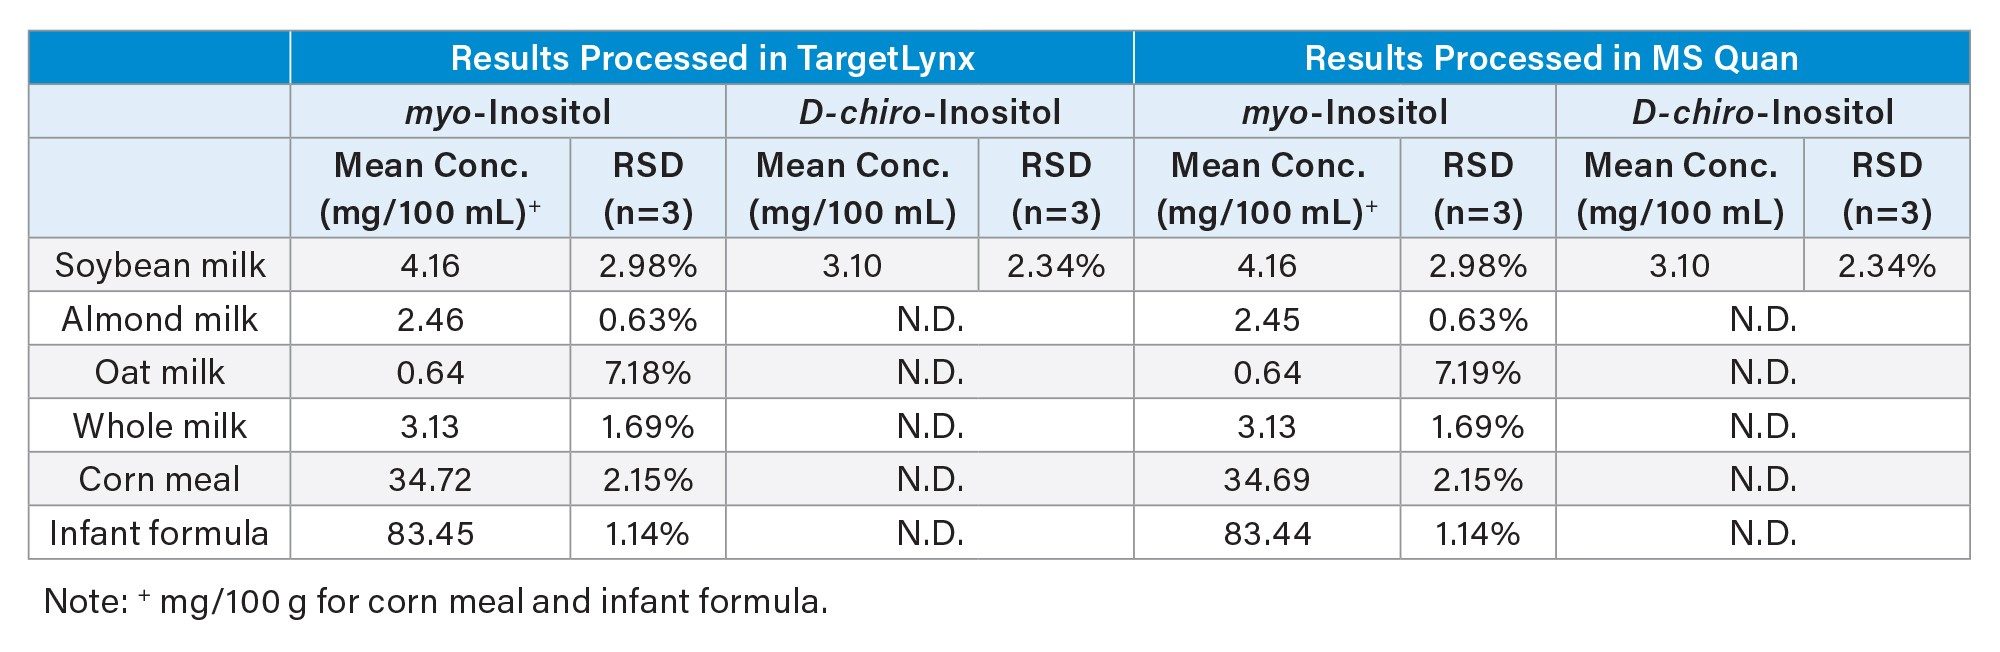
The raw data from the LC-MS/MS analysis of free inositol in foods were processed using MS Quan within waters_connect for Quantitation platform, and the results were compared with those obtained in TargetLynx™ Software (see Table 2). Identical results were obtained for all samples, except for random errors (less than 0.17% in relative difference). These minor discrepancies are likely caused by small differences in peak integration parameters, which result in small differences in the peak start and end points. The calibration equations were obtained exactly the same in both software (data not shown). Paired t-test confirmed that there was no statistically significant difference between these two sets of results (at α=0.05).
Conclusion
MS Quan in waters_connect for Quantitation platform offers significant advantages for LC-MS/MS data processing and review, as demonstrated in the analysis of free inositol in food samples.
The Overview screens enable rapid, side-by-side comparisons of all injections (including standards and samples) within the entire batch using multiple screen layouts that are designed for different sample types and processing tasks. The raw chromatographic data from individual injections, along with relevant results and processing parameters, can be accessed directly on a single screen by simply clicking on any data point or chromatogram within the Overview screens.
Task-specific screen layouts are tailored for different sample types or data processing tasks. This task-oriented, single-screen design enables scientists to review and process data without navigating between different screens, which greatly simplifies data review and processing workflows.
The Rule Set criteria further enhance data processing and review by defining expected result characteristics and automatically flagging any exceptions, ensuring thorough evaluation of anomalies and minimizing potential processing errors.
Together, these features streamline data processing and review while significantly improving the overall quality and throughput of analysis. MS Quan offers an intuitive, efficient software solution for routine and high-throughput LC-MS/MS analyses.
References
- Yang, J. and Rainville, P. Streamline LC-MS/MS Data Processing for Food Analysis with MS Quan. Waters Application Note 720000759, Waters Corporation, 2022
- Yang, J., Harden, S., and Rainville, P. HILIC-MS/MS Analysis of Free Inositol Stereoisomers in Foods. Waters Application Note 720009200, Waters Corporation, 2026
720009238, February 2026