• Application Note

Bioanalysis of Clopidogrel in Plasma: Sub-Picogram Estimation Using the ACQUITY UPLC System, Xevo TQ-S MS, and MassLynx Software

Bioanalysis of Clopidogrel in Plasma: Sub-Picogram Estimation Using the ACQUITY UPLC System, Xevo TQ-S MS, and MassLynx Software

  • Rao B. Tirupateswara
  • Sudarshan Mantha
  • Gopal Vaidyanathan
  • Waters Corporation
Human blood serum sample in tube in lab

Abstract

Today’s bioanalytical scientists face several challenges in their workflow, regardless of the regulated or non-regulated environment. Some of these challenges include:

  • The ability to develop highly sensitive LC-MS methods for any molecule
  • Ensuring high reproducibility and robustness while maintaining the shortest possible run time
  • Addressing regulatory guidelines
  • Ensuring high throughput value

This application note focuses on quantitation of clopidogrel by following the MRM of the active pro-drug with an LLOQ of less than 1 pg/mL in plasma.

Benefits

Waters Regulated Bioanalysis System Solution is capable of addressing sensitivity challenges in the world of regulated bioanalysis.

Introduction

Clopidogrel is a prodrug, which takes action on an adenosine diphosphate (ADP) receptor on platelet cell membranes. The drug specifically and irreversibly inhibits the P2Y12 subtype of an ADP receptor, which is important in aggregation of platelets and cross-linking by the protein fibrin.

Molecular structure of clopidogrel
Figure 1. Molecular structure of clopidogrel.

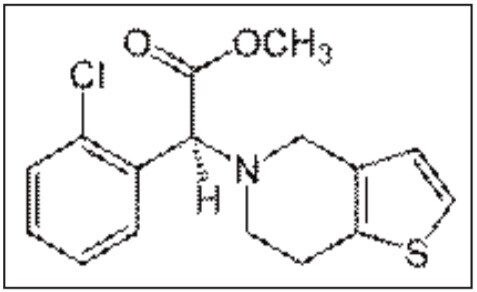
Clopidogrel, chemical structure shown in Figure 1, consists of an asymmetrical carbon at C-7 resulting in two enantiomers, R and S. It has been reported that the S-enantiomer is the active compound1,2 and the clopidogrel free base is susceptible to racemization and hydrolysis of methyl ester group.2,3 Owing to the extensive and first-pass metabolism, clopidogrel and its active metabolite are not typically detected in plasma. The major circulating compound, which is also used for documenting the pharmacokinetic (PK) profile of clopidogrel, is its inactive carboxylic derivative. Such a PK profile is easily achieved by most HPLC and mass spectrometers due to the high abundance (~85%) of the inactive carboxylate metabolite of clopidogrel in human plasma.4

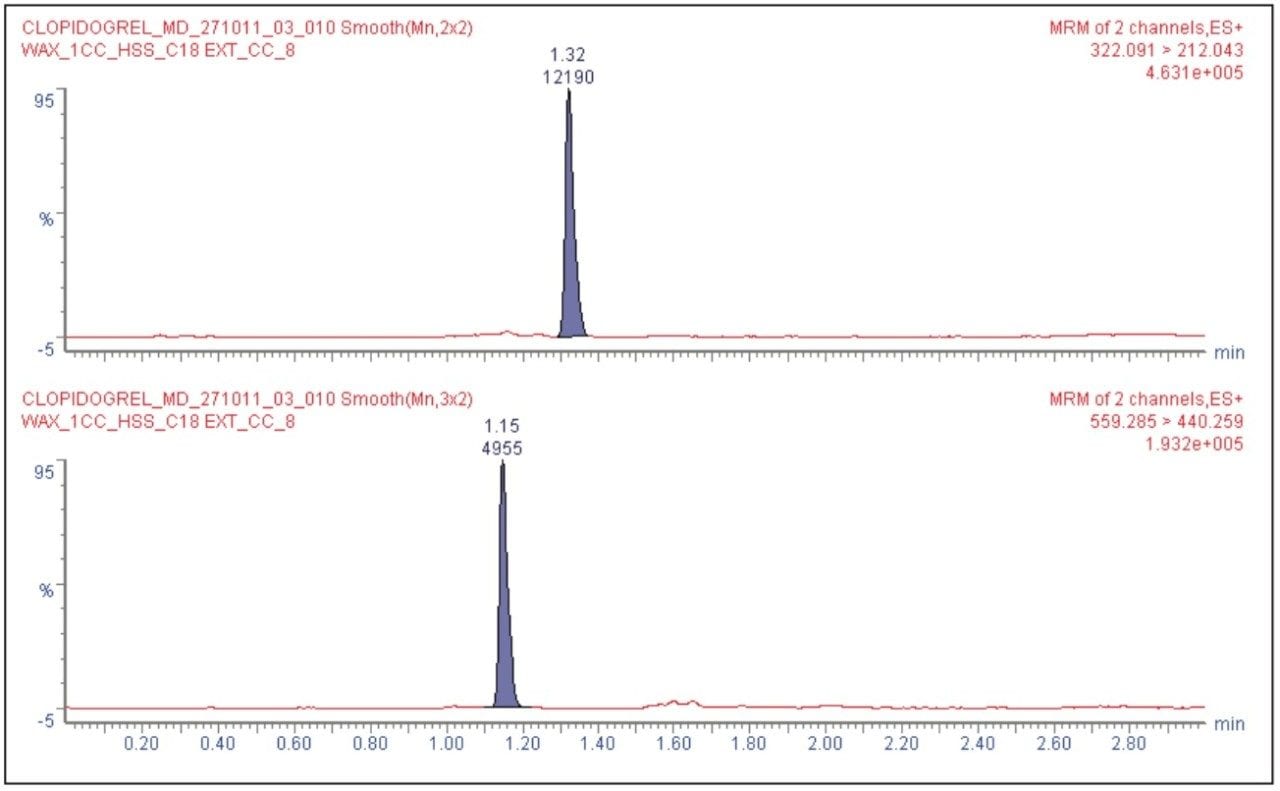
As mentioned above, the traditional detection of clopidogrel by its inactive carboxylate metabolite is obtained by an indirect method of documenting the PK profile. However, based on the characteristic low Cmax exhibited by clopidogrel, it is necessary to estimate the drug in pg/mL concentration levels, which requires LC-MS instruments that are capable of achieving unforeseen sensitivity. In this application note, we report an LC-MS/MS method to determine and quantify clopidogrel at pg/mL or sub-pg/mL concentration levels and monitor the active pro-drug, clopidogrel, and not the inactive metabolite

This application note demonstrates the benefits of combining micro-elution and standard solid phase extraction methodology of Oasis Sample Extraction Products, the ACQUITY UPLC System, and the Xevo TQ-S Mass Spectrometer for the development of an LC-MS method to detect clopidogrel in sub-picogram quantity. In addition to addressing the challenge of achieving maximum sensitivity, the components of Waters Bioanalysis System Solution enables users to address several other challenges, including high selectivity and throughput.

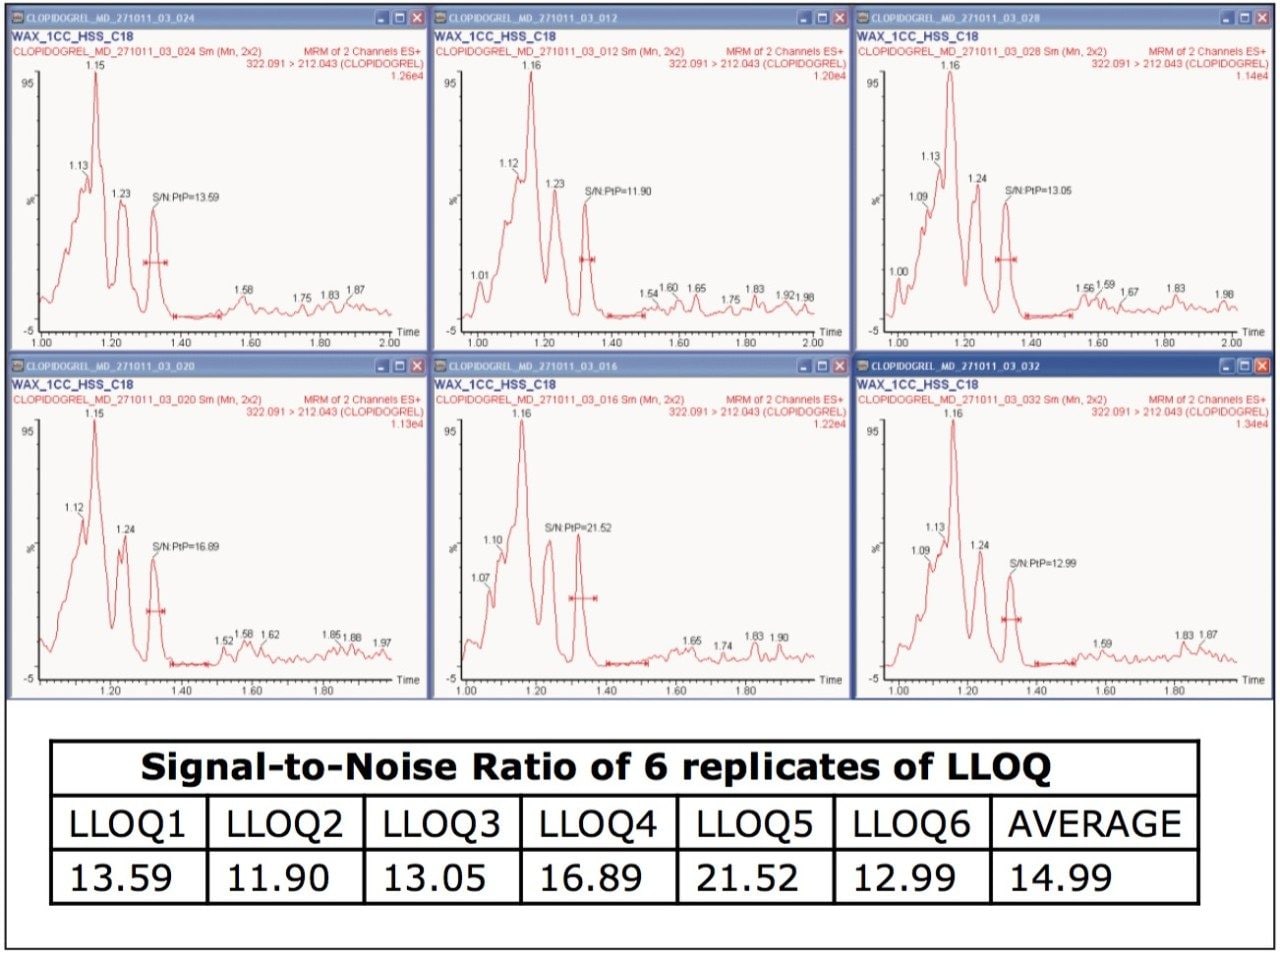
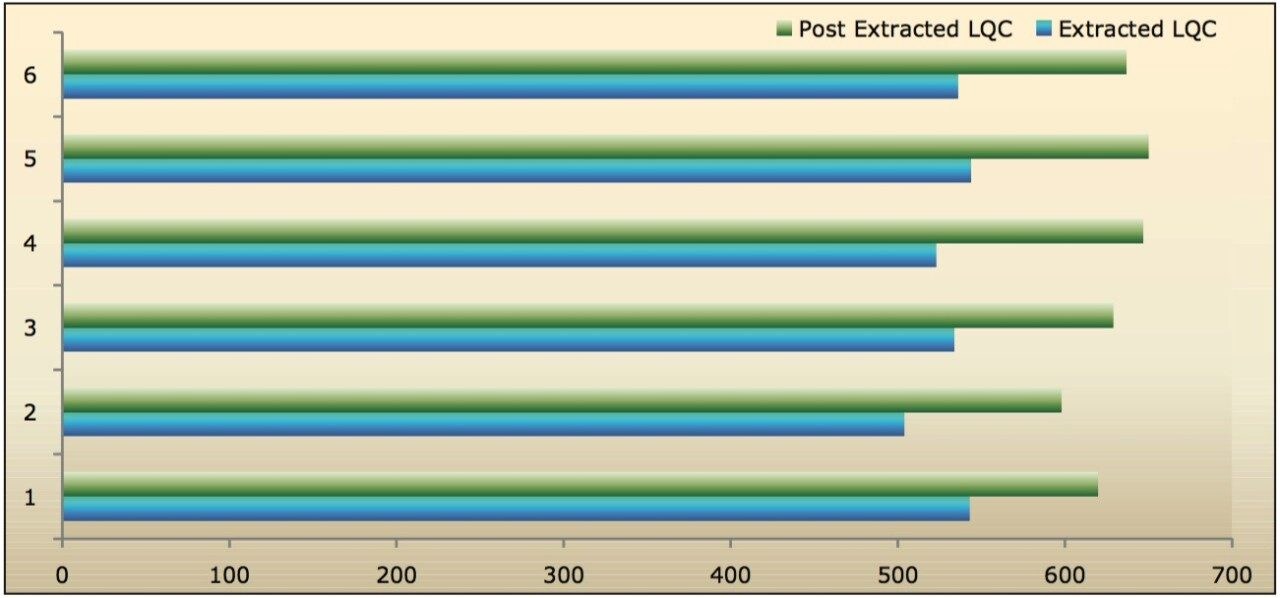
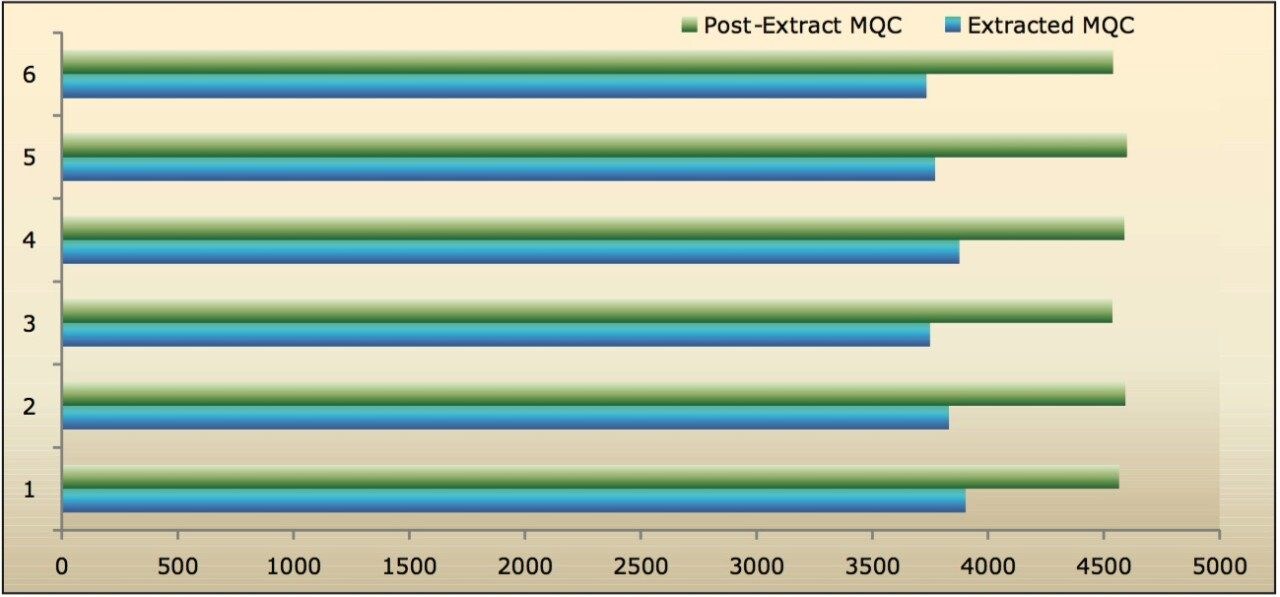
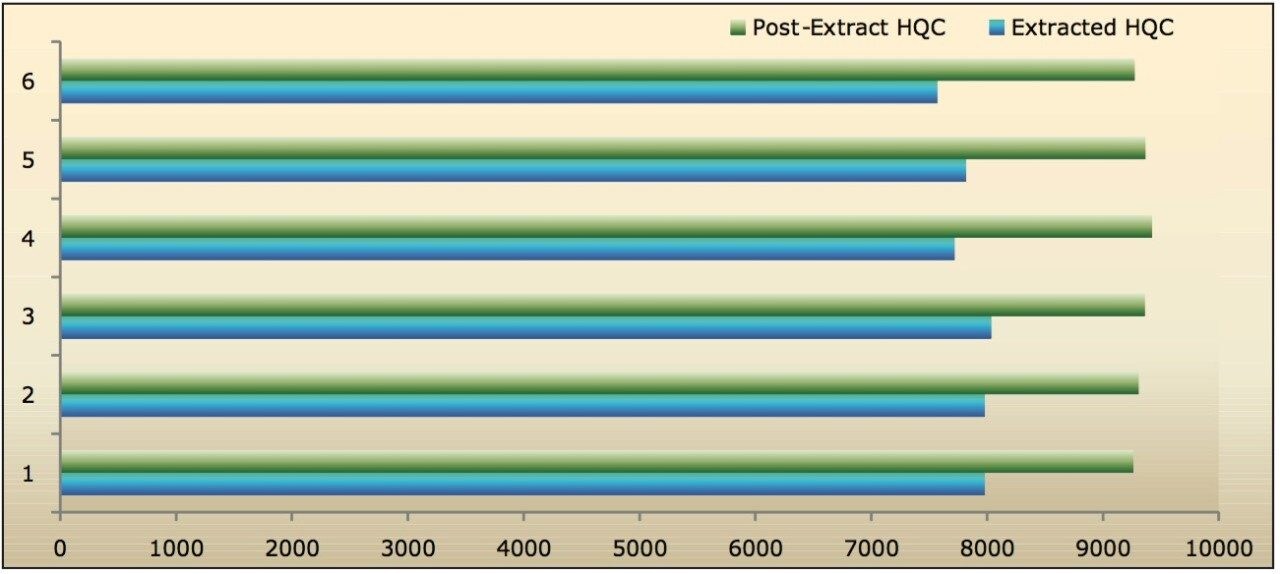
The plasma samples were isolated using Oasis WAX 1 cc, 30 mg cartridges and micro-elution plates. A 400-μL aliquot of plasma was diluted with 10% formic acid and loaded onto the SPE cartridges previously conditioned with organic solvent and water. The plasma solution was then washed with acidified water followed by an organo-aqueous solution, then eluted in an organo-aqueous elution solvent. The eluted samples were directly injected onto the system. For micro-elution plates, the elution resulted in a higher concentration of the sample, and hence higher a signalto- noise (S/N) ratio compared to that obtained from the standard SPE. Atorvastatin was used as the internal standard (IS) for the estimation of clopidogrel.

Experimental

LC Conditions

LC system:

ACQUITY UPLC

Column:

ACQUITY UPLC HSS C18 1.8 μm, 2.1 x 50 mm

LC column:

99% aqueous buffer over 0.4 min followed by a 90% organic elution until 2 min; then change back to initial conditions.

Column temp.:

40 °C

Flow rate:

0.400 mL/min

Injection volume:

5 μL

MS Conditions

MS system:

Xevo TQ-S

MS mode:

ESI positive

MRM transition:

322.1 → 212.0

Results and Discussion

Clopidogrel was eluted at 1.34 minutes, while the internal standard was eluted at 1.15 min with a peak width of 8 s at the base, as shown in Figure 2. The chromatographic method developed using the ACQUITY UPLC System and the ACQUITY UPLC HSS C18 Column provided excellent resolution for the clopidogrel  analyte from the peaks of possible endogenous components in the extracted plasma samples. The signal-to-noise obtained for the LLOQ was 15 (average calculated from six replicate LLOQ injections, shown in Figure 3). The data shown in Figure 4.1 and Figure 4.2 exhibit the chromatogram obtained for the blank plasma and that of the clopidogrel analyte in LLOQ concentration of 0.5 pg/mL.

Elution pattern of clopidogrel and internal standard
Figure 2. Elution pattern of clopidogrel and internal standard.
 Chromatogram of six batches of clopidogrel
Figure 3. Chromatogram of six batches of clopidogrel at the LLOQ concentration (0.5 pg/mL) with an average S/N ratio of ~15.
Chromatogram of the blank internal standard
Figure 4.1 Chromatogram of the blank internal standard.
LLOQ concentration
Figure 4.2. LLOQ concentration (0.5 pg/mL) clopidogrel.

As shown in Figures 4.1 and 4.2, clopidogrel eluted with a retention time that was well separated from the co-eluting peaks, arising from possible endogenous components of the plasma.

The assay in this report showed linear calibration over the range of 0.5 to 64.0 pg/mL with an r2 value of 0.992, as shown in Figure 5. The back-calculated concentration of the standard was found to be within ± 8% of the nominal concentration, as shown in Table 1. This assay was performed with a three min injection-to-injection time. The nominal deviation observed for the data, shown in Table 1, and the short injection-to-injection time enables the user to address several challenges in the world of regulated bioanalysis, such as addressing regulatory concerns while ensuring a high-throughput.

Calibration data of clopidogrel
Table 1. Calibration data of clopidogrel over the range of 0.5 to 64.0 pg/mL.
Calibration curve for clopidogrel
Figure 5. Calibration curve for clopidogrel.

Recovery of the analyte and IS was performed by comparison of extracted QC samples against six postextracted QC samples, and was found to be approximately 84% at LQC, MQC, and HQC levels for both analyte and IS, as shown in Figures 6.1, 6.2, and 6.3, and Table 2. The %CV for repeat batches were found to be within 10% of LLOQQC and varied between 1% and 3% for all QC levels.

 Analyte recovery
Figure 6.1. Analyte recovery (area under the curve) from six samples of clopidogrel at LQC, concentrations.
 Analyte recovery
Figure 6.2. Analyte recovery (area under the curve) from six samples of clopidogrel at MQC, concentrations.
Analyte recovery
Figure 6.3. Analyte recovery (area under the curve) from six samples of clopidogrel at HQC, concentrations.
Mean analyte recovery
Table 2. Mean analyte recovery (%) of clopidogrel at LQC, MQC, and HQC levels.

The data reported in Table 2 and Figures 6.1, 6.2, and 6.3 exhibit the remarkable consistency of the analyte recovery values for the six samples of clopidogrel for all three concentration levels (LQC, MQC, and HQC). In addition, as detailed in Table 2, the mean analyte recovery for the three concentration ranges was 84%. Such quality of data indicates the capability of Waters Regulated Bioanalysis System Solution for addressing robustness and consistency of the methods while addressing sensitivity challenges.

For a comparison of samples within the global batches, three separate batches were prepared with six samples in each batch for LLOQQC, LQC, MQC, and HQC concentration levels. The data showed excellent agreement between the six samples in all the three batches, as shown in Table 3. The mean accuracy obtained for all the samples was found to be > 94% for every concentration, as shown in Table 3.

Comparison of the three separate batches
Table 3. Comparison of the three separate batches each containing six clopidogrel samples at the LLOQQC, LQC, MQC, and HQC concentrations.

Conclusion

Clopidogrel is a thienopyridine derivative, which is used to prevent thrombosis after coronary artery stenting. The PK profile of clopidogrel is typically studied in an indirect method by quantification of an inactive carboxylate metabolite of clopidogrel. This method is primarily adopted because of the inability of most LC-MS instruments in achieving the desired sensitivity to monitor the direct clopidogrel drug and/or its active metabolite. In this study, the components of the Regulated Bioanalysis System Solution were successfully used to obtain highly sensitive LC-MS data with clopidogrel. The clopidogrel analyte was monitored instead of its inactive metabolite for detection and quantification. These results highlight the capabilities of Waters Regulated Bioanalysis System Solution in addressing sensitivity challenges in the world of regulated bioanalysis.

References

  1. Savi P, Combalbert J, Gaich C, Rouchon MC, Maffrand JP, Berge Y, Herbert JM. Throm Haemostasis, 1994, 72, 313-317.
  2. Pereillo JM, Maftouh M, Andrieu A, Uzabiaga MF, Fedeli O, Savi P, Pascal M, Herbert JM. Drug Metabolism, 2002, 30(11), 1288-1295.
  3. Gomez Y, Adams E, Hoogmartens J. J. Pharm. Biomed. Anal., 2004, 34(2), 341-348.
  4. Herbert JM, Frehel D, Vallee E, Kieffer G, Gouy D, Berger Y, Defreyn G, Maffrand JP. Cardiovascular Drugs, 1993, 11(2), 180-198.
  5. EMA/618604/2008 Rev. 4 Committee for Human Medicinal Products (CHMP).

720004407, June 2012

Back To Top Back To Top