
The Quantification of Glucagon-like Peptide Receptor Agonists (GLP-1 RAs) in Plasma Extracts Using Capillary UHPLC-MS/MS
Robert Plumb, Nikunj Tanna
Waters Corporation, United States
Published on August 11, 2026

This is an Application Brief and does not contain a detailed Experimental section.
Abstract
The accurate quantification of therapeutic drugs and their metabolites at low levels is critical for successful pharmacokinetic characterization. This application note describes the use of capillary scale (300 µm) UHPLC combined with tandem quadrupole mass spectrometry to affect a 10-fold increase in detection limits for the GLP-1 / GIP RAs tirzepatide and semaglutide.
Benefits
- 10-fold improvement in sensitivity
- Robust methodology for >500 injections
- Reduced solvent usage
- No need for complex nanospray MS source
Introduction
Obesity represents, perhaps, the largest healthcare challenge, affecting approximately 1.3 billion people globally, contributing to a diverse range of chronic diseases e.g., metabolic, cardiovascular, muscular skeletal, and multiple cancers.1 The rapid growth of obesity and associated global healthcare costs means there is a critical need for safe effective treatments.2 GLP-1 RA initially developed for type 2 diabetes have shown clinical efficacy as weight loss medicines.2 These drugs mimic the action of gut hormones which regulate energy metabolism and appetite by interacting with the hypothalamus, brain stem etc., resulting in weight loss. The success of these GLP-1 RAs is associated with their on-target efficacy and long duration of action,3 e.g., half-life of semaglutide t½ = 160–180 hours3 cf. 1–2 minutes for human GLP-1.4 The long half-life of these GLP-1 RAs results in low, sub ng/mL plasma levels 48–72 hours after dosing, which requires a high sensitivity bioanalytical assay to accurately quantify the plasma concentrations5 and define the PK elimination phase.
Tandem quadrupole electrospray ionization (ESI) mass spectrometry, operated in multiple reaction monitoring (MRM) mode, coupled with 2.1 mm ID ultra-high performance liquid chromatography (UHPLC) is the dominant technology platform for quantitative bioanalysis. As next generation GIP/GLP-1 RAs promise to be more potent, resulting in lower dosing levels and plasma levels, there is a need for more sensitive analytical methodologies to support drug metabolism and pharmacokinetics (DMPK) studies. Capillary/nano LC-MS/MS have been extensively employed in proteomics to increase analytical sensitivity and enable small volume analysis.5 This sensitivity increase is derived from a combination of the superior ionization efficiency at low flow rates and analyte concentration due to the smaller column geometry.6 This application note illustrates the use of capillary (300 µm) UHPLC-MS/MS (MRM) to affect 10-fold improvement in GLP-1-RAs peak response in human plasma extracts, and detection limits as low as 20 pg/mL for tirzepatide.
Experimental
Sample Preparation
Liraglutide, exenatide, semaglutide, and tirzepatide chromatographic test solutions were prepared (100 ng/mL) in 3:1 water:methanol 0.1% human plasma. Calibration standards containing semaglutide and tirzepatide were prepared in human plasma over the range of 20 pg/mL to 1000 pg/mL, as well as 1000 ng/mL for liraglutide and exenatide. The plasma samples were prepared for analysis by either solid phase extraction (SPE) or protein precipitation. SPE was performed as previously described by Trudeau, et al.7 Briefly, plasma samples (50 µL) were mixed with methanol (2:1), vortexed and centrifuged at 14,000 rcf; the resulting extracts were applied to an Oasis™ MAX SPE µElution plate (p/n: 186000259) (conditioned with methanol and water). The SPE plate was washed with 5% ammonia (aq) and methanol, dried and the sample eluted with 2 x 25 µL aliquots of water:ACN (1:3) containing 5% formic acid. The eluent was then diluted 1:1 with water containing 0.1% human plasma and transferred to QuanRecovery™ Vials with MaxPeak™ High Performance Surface (HPS) Vials (p/n: 186009186). For protein precipitation, plasma standards (50 µL) were mixed with ACN (100 µL) vortexed for 1 minute and centrifuged at 14,000 rcf. The supernatant layer was diluted 1:1 with water containing 0.1% human plasma and transferred to low bind autosampler vials for analysis.
Capillary chromatography was performed on an ACQUITY™ M-class Chromatography System connected to a Xevo™ TQ-XS Mass Spectrometer (Waters Corporation, Wilmslow, UK) equipped with a microflow probe. Capillary UHPLC separations were performed on an ACQUITY Premier Peptide CSH C18, 300 Å, 1.7 µm, 300 µm x 50 mm Chromatography Column (p/n: 186009254) maintained at 65 °C, and eluted with a linear reversed–phase gradient where solvent A = 0.1% aqueous FA (v/v), solvent B = 0.1% FA in ACN (v/v) at a flow rate of 15 µL/min. After an initial hold for 0.5 minute, the gradient profile started at 20% solvent B and increased to 80% solvent B over 10 or 3 minutes, followed by a 2 minute column flush at 95% solvent B then re-equilibrated for 2 minutes at the starting conditions prior to the next sample. Large volume injections (5–10 µL) were facilitated using a 0.3 x 25 mm Symmetry™ C18 5 µm trapping Column (p/n: 186009251).
MS analysis was performed at unit mass resolution using positive ESI at a capillary voltage of 3.0 kV, with a cone voltage of 32 V. The cone gas flow, desolvation gas flow, and desolvation gas temperature were 50 L/h, 300 L/h and 600 °C, respectively. The data were analyzed using waters_connect™ Software, and MRM transitions used to monitored for the MS/MS detection of liraglutide, exenatide, semaglutide and tirzepatide were as follows: liraglutide 938.7 → 1128.4, exenatide 838 → 396, semaglutide 1029.2 → 1238.1, and tirzepatide 1204.2 → 396.2. Data analysis was performed using MS Quan Software.
Results and Discussion
Chromatographic Performance
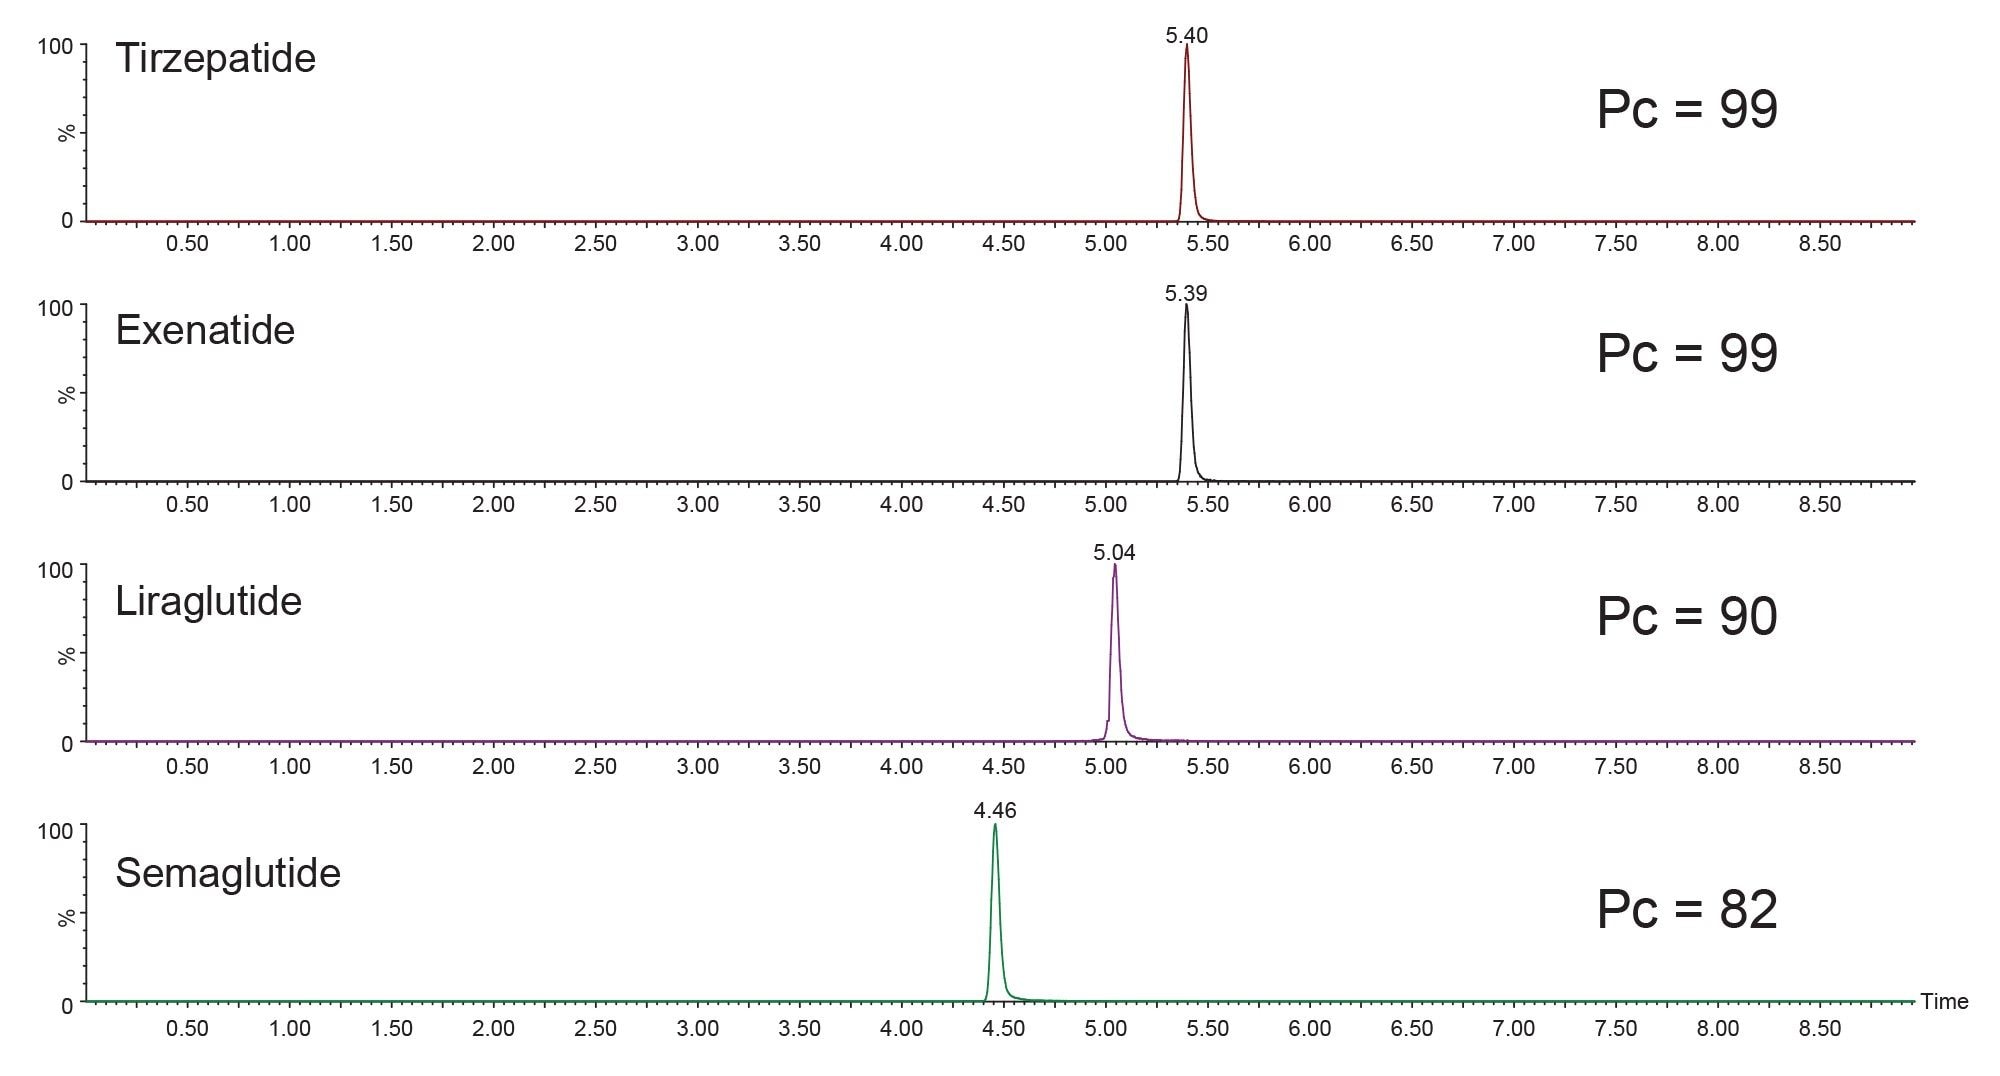
The chromatographic performance of the capillary columns was evaluated using the solvent standard mix containing the GLP-1 RAs (100 ng/mL); the column was eluted with a linear gradient over 10 minutes (see above). A dedicated low-flow MS electrospray source was employed which minimized post column band broadening and improved spray stability. The GLP-1 RA peptides eluted in the order semaglutide, liraglutide, exenatide, and tirzepatide with retention times of tR 4.46, 5.04, 5.39, and 5.40 minutes respectively, as shown in Figure 1. The peak widths ranged from 6 to 7.5 seconds at the base, giving peak capacities for the separation of 82 and 99 for 10 minutes separation which is similar if slightly higher than that observed with the analytical scale analysis of approximately 60 (See Waters application note, 720009313). The data indicate that the 300 µm x 50 mm capillary column provided the chromatographic peak shapes and resolution suitable for quantitative bioanalysis. Reducing the flow rate from 400 to 15 µL/min effects a 26-fold reduction in solvent consumption compared to conventional 2.1 mm scale UHPLC, which reduces both solvent purchase and disposal costs.
Sensitivity Comparison
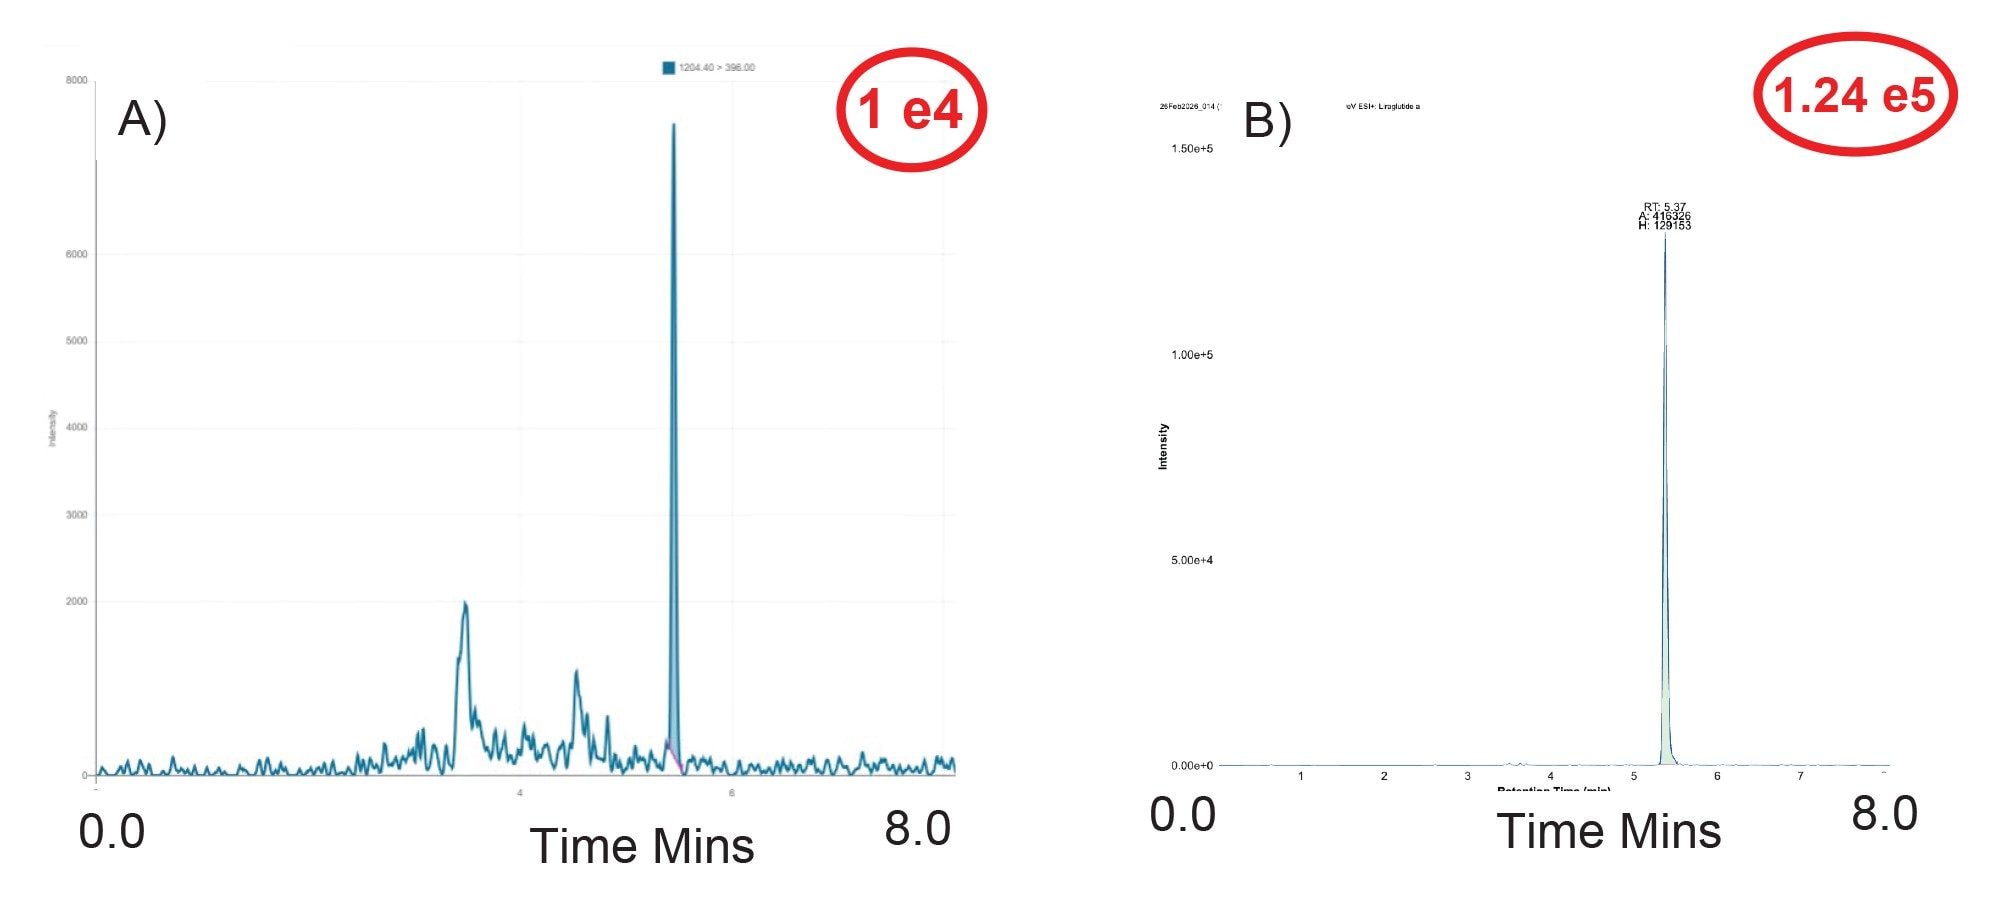
The potential of capillary LC-MS/MS bioanalysis to improve detection limits and address low sample volume challenges was illustrated by Dear, et al. for the analysis of small molecule candidate pharmaceuticals in serial bled small animal studies,8,9 and by Jiang and Yuan10 where the analysis of antisense oligonucleotides in plasma showed a 6-fold increase in sensitivity vs 2.1 mm scale. The sensitivity improvements obtained using 300 µm scale UHPLC-MS/MS (c.f. identical 2.1 mm x 50 mm Column) for the bioanalysis of GLP-1 RAs plasma extracts was investigated using a 1 µL loading of the 10 ng/mL calibrator of semaglutide using the transitions m/z = 1029 → 1238. The resulting data showed that for semaglutide, the measured peak intensity increased from 2.5 e4 with the analytical scale (2.1 mm) separation to 1.96 e5 with the capillary scale (300 µm) chromatography (Figure 2). A similar result was obtained for tirzepatide where the measured peak intensity increased from 8 e3 for the 2.1 mm separation to 1.24e5 for the 300 µm scale separation. This represents an 8–14-fold increase in peak intensity for the capillary scale separation compared to the 2.1 mm scale UHPLC-MS/MS configuration when using a 1 µL plasma extract loading. This increase in sensitivity was obtained without the long analysis times or the complex optimization associated with nano scale LC-MS/MS.
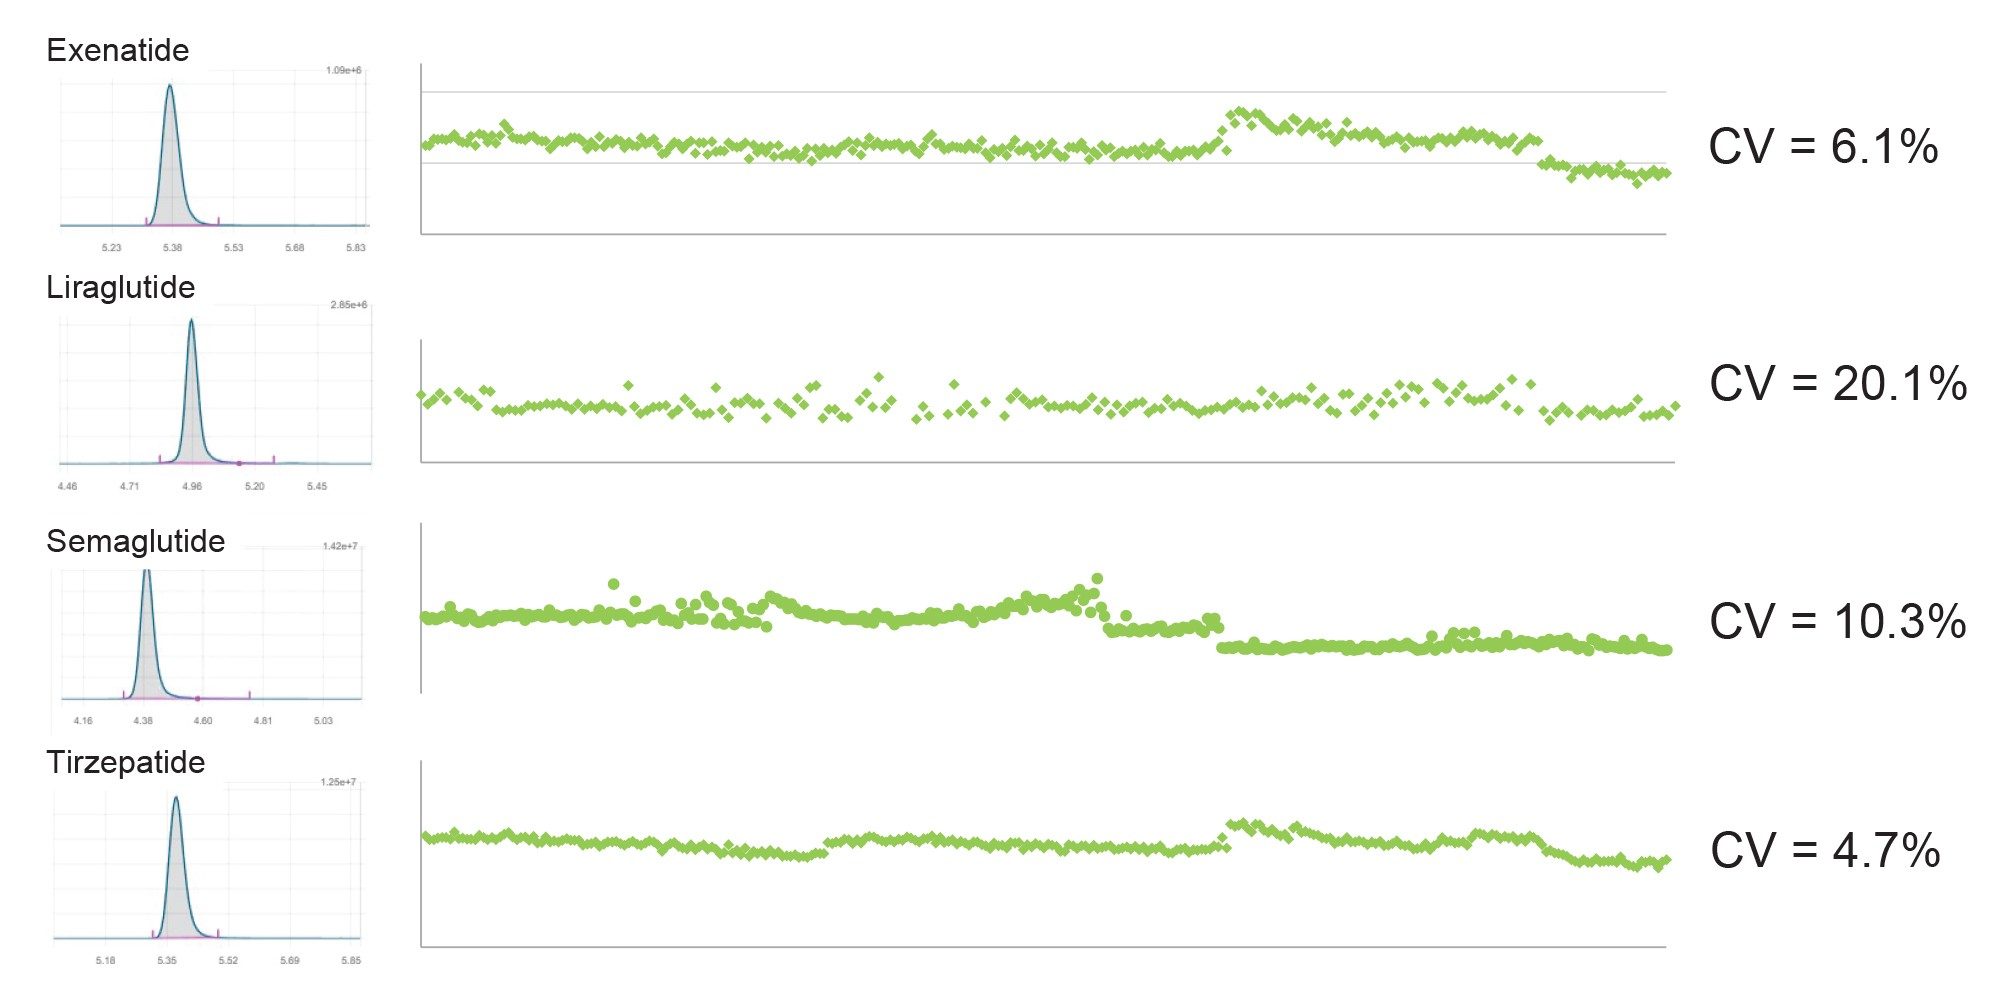
Column robustness is essential in bioanalysis as bioanalytical methods must be capable of supporting the analysis medium to large sizes sample batches, e.g., 96–384 samples (1–4 microtiter plates). The column robustness was evaluated for the 300 µm x 50 mm UHPLC-MS/MS method via the repeat analysis (1 µL) of a plasma extract containing liraglutide, exenatide, semaglutide, and tirzepatide at 100 ng/mL. The analysis was performed in batches of 100 plasma extracts with a run order of water blank (x2), solvent standard (x2), extracted blank plasma (x2) followed by the analysis of 100 replicates of the plasma standard extract followed by water blank (x2). A total of five analytical batches were analyzed consecutively over a period of seven days, with no between batch maintenance or cleaning performed, giving a total of 540 injections. After the removal of blanks and solvent standard samples, the coefficient of variation (%CV) of the analyte peak intensities over the course of the 500-plasma extract batch ranged from 4.7% for tirzepatide to 20.1% for liraglutide (Figure 3). During the course of this 500-plasma extract sample analysis, there was no significant increase in column back pressure or change in chromatographic performance, indicating that the capillary scale system is suitable for routine bioanalysis.
Preliminary data indicated that a 10-fold increase in peak response could be realized with capillary UHPLC-MS/MS compared to 2.1 mm. However, this was performed with a relatively small injection (1 µL); to achieve a significant improvement in limits of detection and quantification it is necessary to increase the amount loaded onto the column. It is not feasible to directly load 5 or 10 µL of SPE extract directly onto the capillary system as this would represent several times the column volume (approx. 1.8 µL) and result in reduction in chromatographic performance. The loading of larger injections volumes onto the capillary system was achieved via the use of a short 300 µm x 20 mm trapping column packed with Symmetry C18 5 µm porous silica particles (p/n: 186009251) which was located on a 6-port valve on the ACQUITY M-Class Tapping Valve Manager (TMV). The injector valve was connected via 60 cm of 40 µm fused silica capillary to TVM, the trapping column was positioned between ports 3 and 6 and connected via 5 cm of 40 µm fused silica capillary (x2) and the TVM was connected to the capillary analytical column with 80 cm of 40 µm fused silica capillary.
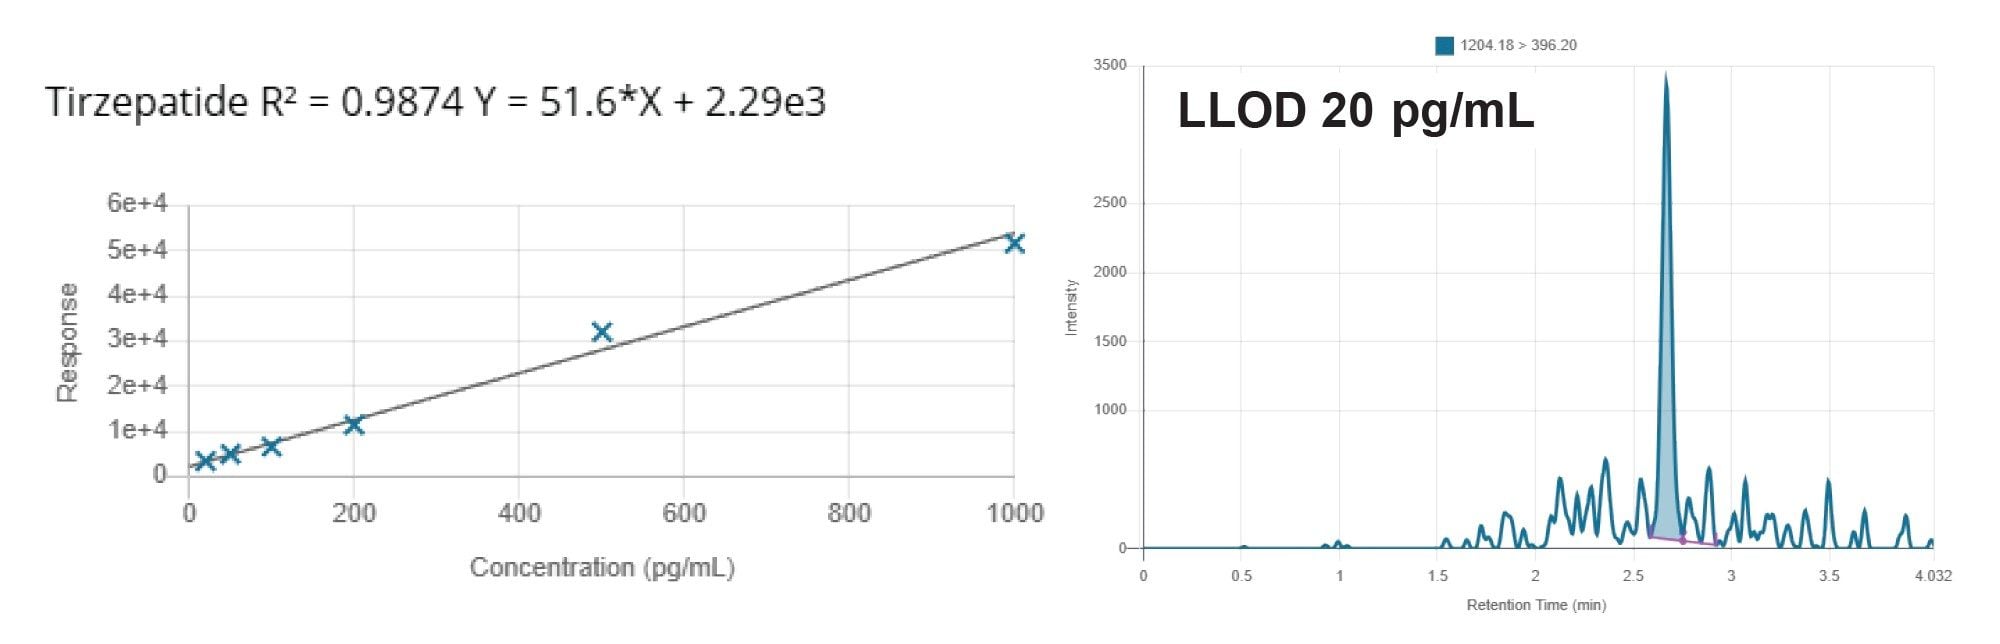
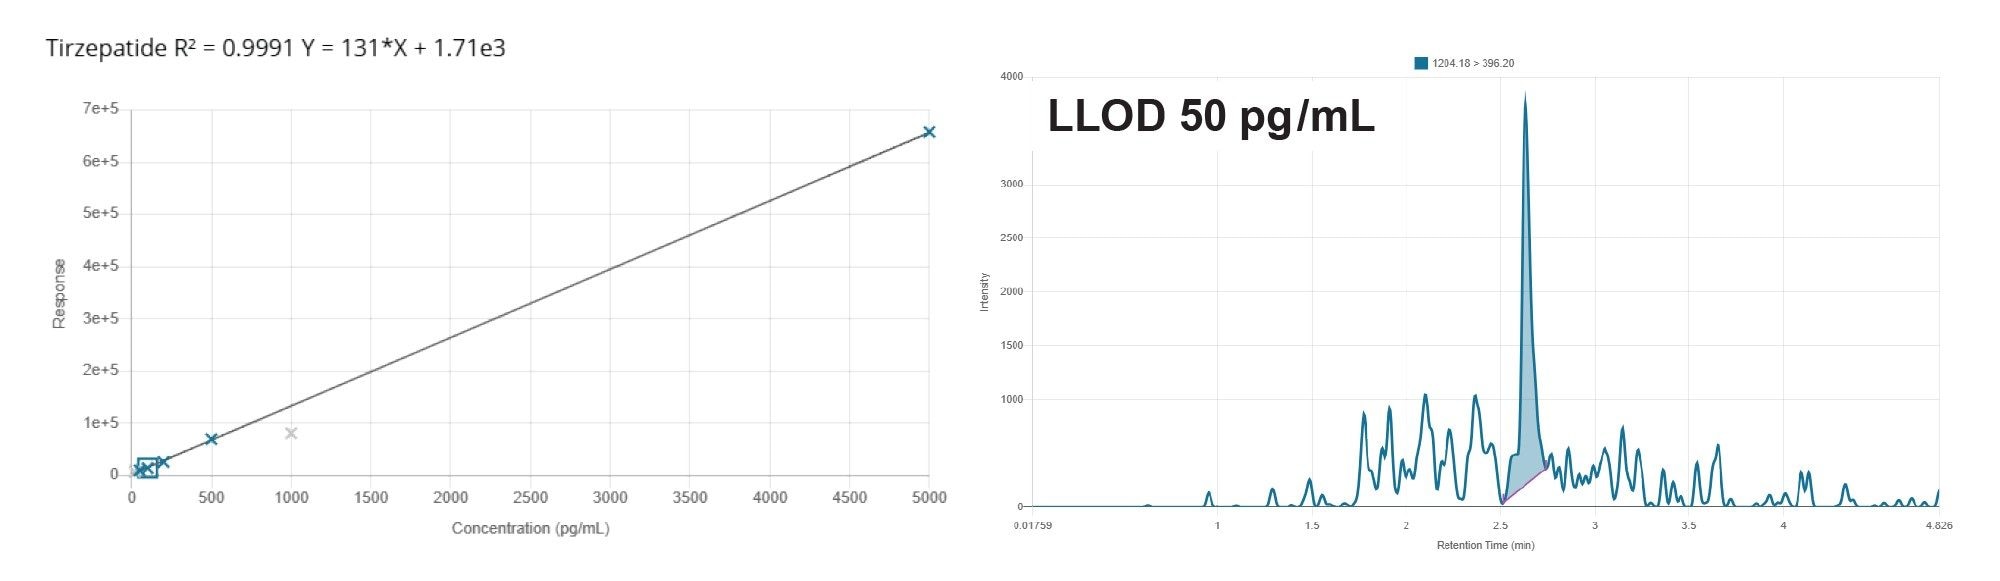
An aliquot (10 µL) of sample was loaded onto the trapping column using aqueous formic acid (0.1%) for 2 minutes at a flow rate of 20 µL/min, during this time the eluent from the trapping column was directed to waste. After the loading period, the flow rate was reduced to 15 µL/min and the trapping column was connected to the analytical column and eluted in a forward flush mode with a linear gradient of 20–80% B, over 3 minutes followed by a 1 minute wash before immediately returning to the initial conditions. Analysis of the plasma extracts resulting from the SPE showed that a lower limit of detection (LLD) of 20 pg/mL was achievable for tirzepatide with dynamic range of 20–1000 ng/mL (Figure 4). Similarly, a LLDof 50 pg/mL and a dynamic range of 50–5000 ng/mL was obtained for tirzepatide in plasma extracts obtained from protein precipitation.
waters_connect for Bioanalysis
waters_connect for Quantitation Software is a 21 CFR 11 compliant ready platform which acts as a workflow enabler for scalable quantitation through automated method optimization, seamless acquisition and processing method creation, rapid simplified data review, integration with tools such as skyline, and enterprise connectivity including LIMS integration and multi-instrument networks.
Conclusion
Bioanalysis plays a critical role in the drug discovery and development processes providing data to support DMPK, safety assessment, pharmacokinetics/pharmacodynamics (PK/PD), and clinical development studies. The development of new, more potent medicines, innovating delivery platforms, micro sampling, and new approach methodologies (e.g., organ on a chip) all require greater levels of analytical sensitivity. Capillary scale UHPLC-MS/MS offers the potential to improve bioanalytical detection limits up to 10-fold, without the need for long analysis times and complex operation associated with nano spray LC-MS/MS. Here, the application of capillary (300 µm ID) scale chromatography for the detection of GLP-1 RAs in human plasma extracts at levels as low as 20 pg/mL with robustness over 500 injections was demonstrated.
References
- Drucker, D.J. GLP-1-based therapies for diabetes, obesity and beyond. Nat Rev Drug Discov 24, 631–650 (2025). https://doi.org/10.1038/s41573-025-01183-8.
- Müller, T.D.; Blüher, M.; Tschöp, M.H.; DiMarchi, R.D. Anti-obesity drug discovery: advances and challenges. Nat Rev Drug Discov 21, 201–223 (2022). https://doi.org/10.1038/s41573-021-00337-8.
- Overgaard, R.V.; et al. Population Pharmacokinetics of Semaglutide for Type 2 Diabetes. Diabetes Ther 10, 649–662 (2019). https://doi.org/10.1007/s13300-019-0581-y.
- Lee T. S.; et al. Novel LC-MS/MS analysis of the GLP-1 analog semaglutide with its application to pharmacokinetics and brain distribution studies in rats, Journal of Chromatography B, 1221, 2023, 123688, doi.org/10.1016/j.jchromb.2023.123688.
- Vissers, J.P.; Blackburn, R.K.; Moseley, M.A. A novel interface for variable flow nanoscale LC/MS/MS for improved proteome coverage. J Am Soc Mass Spectrom. 2002 ;13(7):760–71. doi: 10.1016/S1044-0305(02)00418-X.
- Edwards, J.L.; Edwards, R.L.; Reid, K.R.; Kennedy, R.T. Effect of decreasing column inner diameter and use of off-line two-dimensional chromatography on metabolite detection in complex mixtures. J Chromatogr A. 2007 23;1172(2):127–34. doi: 10.1016/j.chroma.2007.09.075.
- Trudeau, M.; Scumaci, A. SPE-LC/MS Bioanalytical Quantification of the Biotherapeutic Peptide, Semaglutide From Plasma. Waters Corporation application note 720008097, 2023.
- Plumb, R.S.; et al. The application of fast gradient capillary liquid chromatography/mass spectrometry to the analysis of pharmaceuticals in biofluids. Rapid Commun Mass Spectrom. 1999;13(10):865–72. doi: 10.1002/(SICI)1097–0231(19990530)13:10.
- Plumb, R.S.; Warwick, H.; Higton, D.; Dear, G.J.; Mallett, D.N. Determination of 4-hydroxytamoxifen in mouse plasma in the pg/mL range by gradient capillary liquid chromatography/tandem mass spectrometry. Rapid Commun Mass Spectrom. 2001;15(4):297–303. doi: 10.1002/rcm.225.
- Jiang, D.; Yuan, L. (2022). Microflow LC–MS/MS to improve sensitivity for antisense oligonucleotides bioanalysis: critical role of sample cleanness. Bioanalysis, 14(21), 1365–1376. https://doi.org/10.4155/bio-2022-0201.
720009537, August 2026


