This paper describes the use of a Waters AutoSpec Ultima NT in analyzing these complex matrices to the stringent limits enforced by the above EU directives.
Provides the analyst with confidence and accuracy when reporting results close to the legislative limit.
Effective from 26th July 2002, European Union (EU) council directive 2002/70/EC1 establishes strict compliance criteria for the analysis of dioxins and furans in animal feedingstuffs. The directive specifies the maximum permissible limits for the concentrations of dioxins and furans in animal feedingstuffs, as a total World Health Organization total toxic equivalent (WHO TEQ) concentration. The lowest limit is for citrus pulp which has a limit of 0.5 ng/kg WHOTEQ, with a 0.75 ng/kg WHO-TEQ limit for all feed materials of plant origin, including vegetable oils and by-products.
The directive is highly specific concerning the values that need to be reported, and the performance of confirmatory and screening methods.
Member states of the EU are required to bring into force laws enforcing the directive no later than 28th February 2003, and must inform the commission upon implementation of such laws. The directive enforces the provisions laid down in EU council directive 2001/102/EC2 (27th November 2001).
Some animal feedingstuffs have extremely complex matrices presenting the analyst with a variety of challenges from extraction and clean up through to the final analytical method.
This paper describes the use of a Waters AutoSpec Ultima NT in analysing these complex matrices to the stringent limits enforced by the above EU directives.
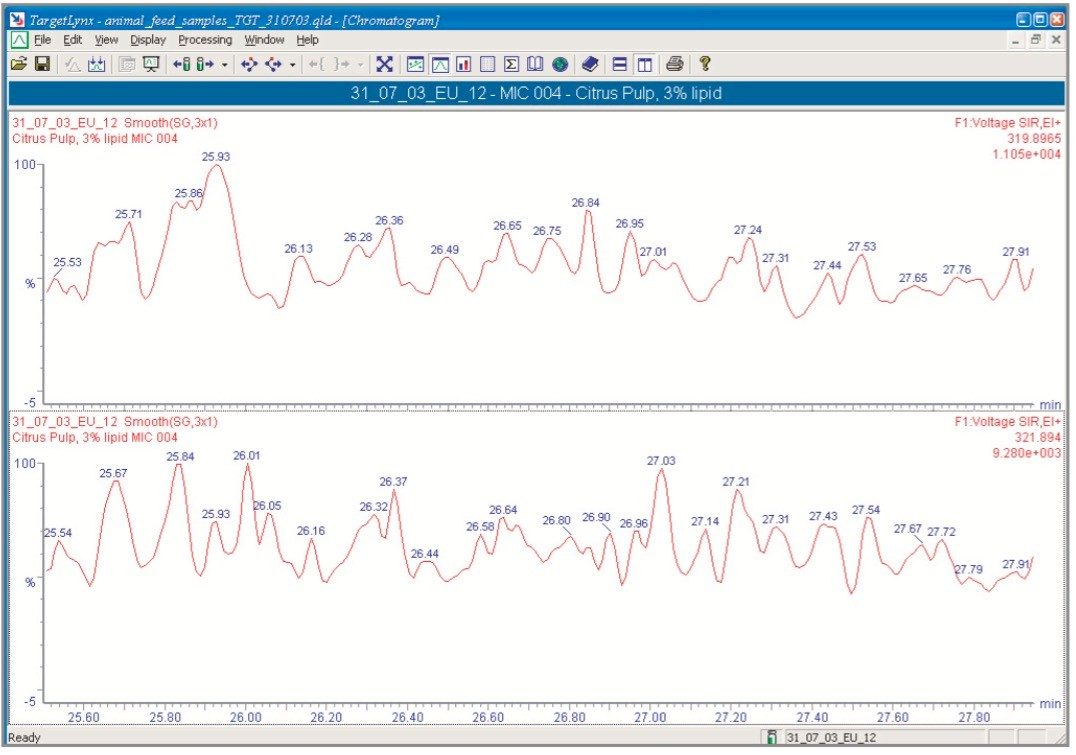
A number of animal feedingstuff samples were extracted and cleaned-up by a laboratory holding accreditation for the analysis of dioxins and furans in such matrices. The samples were spiked with a mixture of 16 13C12 labelled 2,3,7,8-Chlorinated PCDD/Fs at low levels prior to extraction. Two 13C12 labelled PCDD standards were added to the extracts immediately prior to analysis. The final extracts had a volume of 15 μL, having been re-constituted in n-nonane.
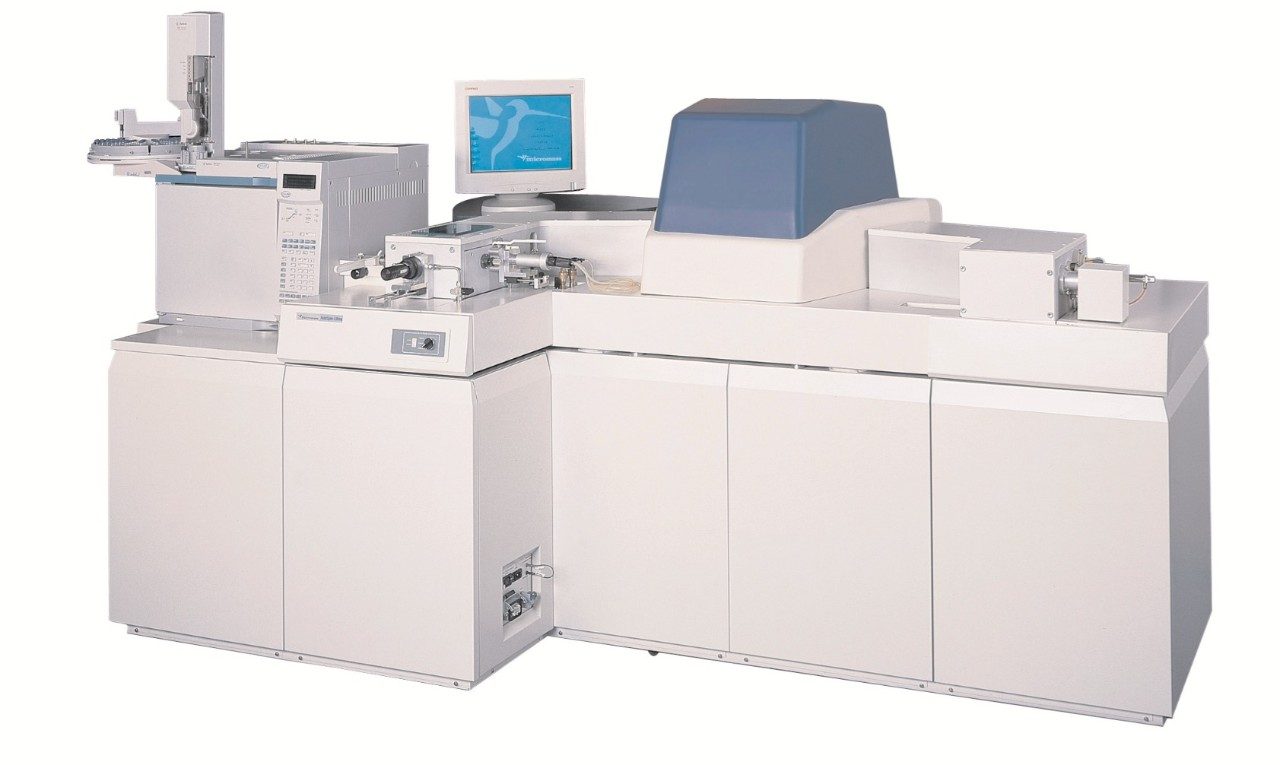
An Agilent 6890N GC oven was directly interfaced to a Waters AutoSpec Ultima magnetic sector mass spectrometer. The mass spectrometer was operated in electron ionization (EI) mode using voltage selected ion recording (VSIR) at a resolution of >10,000 (5% height definition). A DB5-ms 40 m 0.18 mm I.D. 0.18 μm df GC column was directly interfaced into the ion source of the mass spectrometer. All acquisition and processing was performed using MassLynx version 4.0 Software with quantification performed using the QuanLynx and TargetLynx application managers. All signal to noise ratios quoted are those generated automatically by the QuanLynx and TargetLynx application managers.
The following GC conditions were used for all analysis:
140 °C for 4mins, 7 °C/min ramp to 220 °C, 1.4 °C/min ramp to 260 °C, 4 °C/min ramp to 270 °C, 50 °C/min ramp to 310 °C, hold for 3 mins with a He flow of 0.7 mL/min.
The injector was operated in the split less mode at 270 °C, with a purge time of 4.1 mins and a purge flow of 30 mL/min.
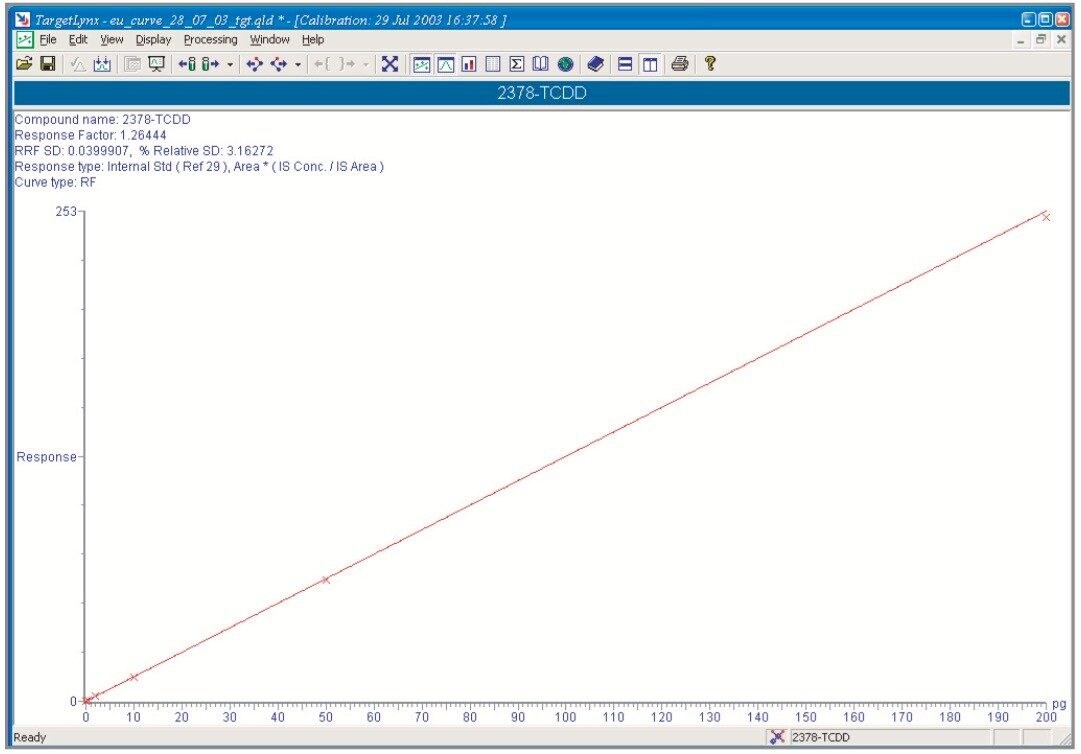
The instrument was calibrated using perfluorokerosene (PFK) for a five function USEPA16133 revision B acquisition system, monitoring two masses each for the native and 13C12 labelled PCDD/Fs plus lockmass, lockmass check and the molecular ion mass for the relevant chlorinated diphenyl ethers.
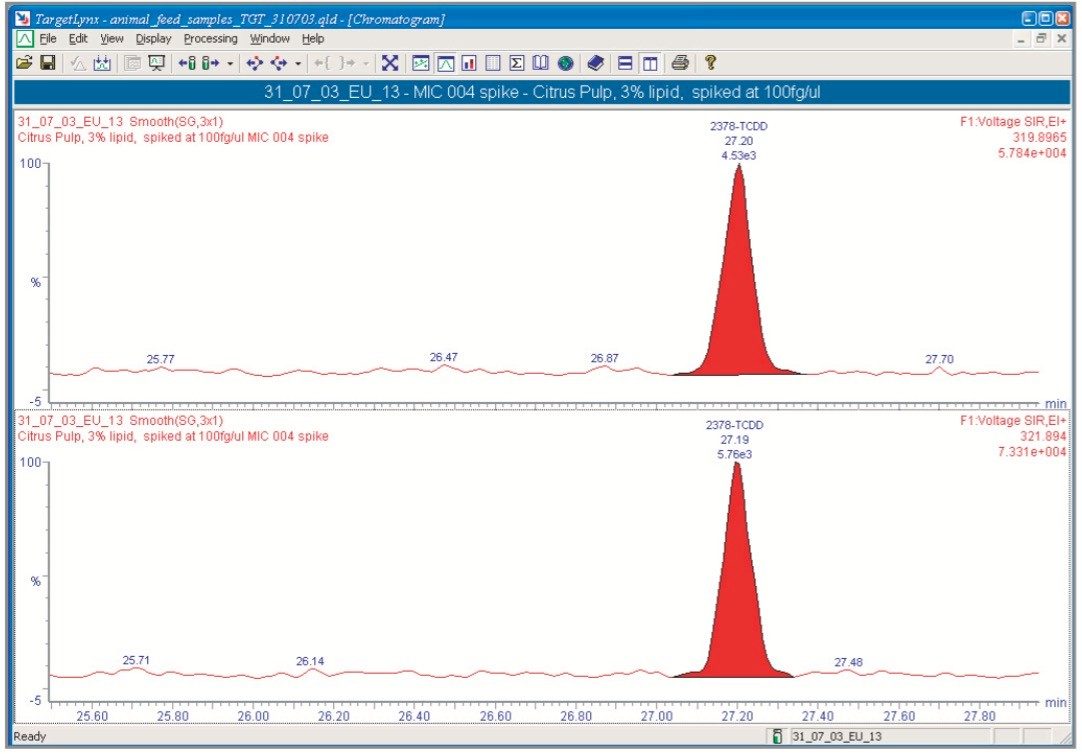
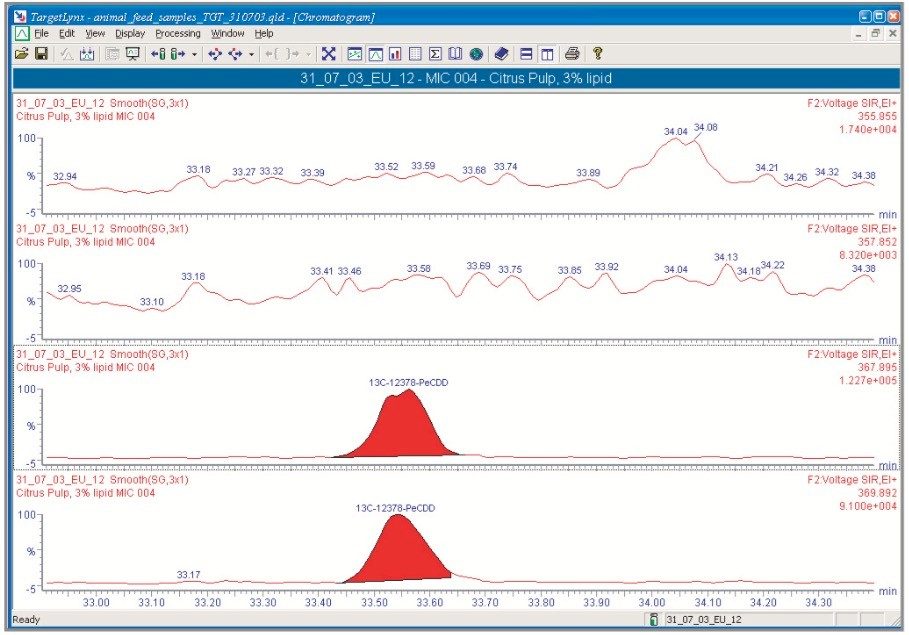
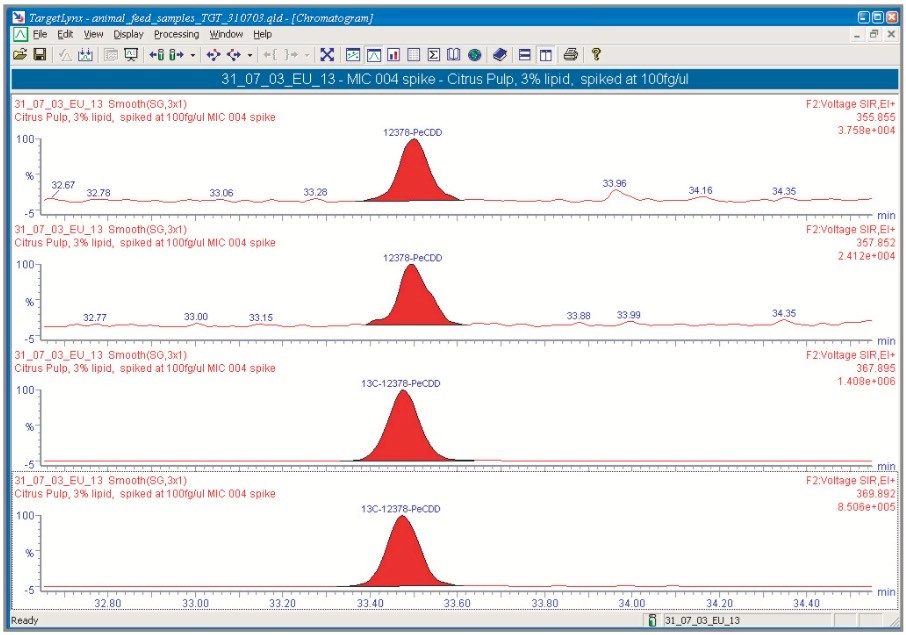
An acquisition sequence of nonane solvent blank, calibration standards with native PCDD/F concentrations ranging from 50 fg to 400 pg (DF-A10 calibration standard set, Wellington Laboratories), nonane solvent blank, extraction blank and then the animal feedingstuffs extracts. The citrus pulp extract was split in half; with one half spiked with 2,3,7,8-chlorinated PCDD/Fs at final extract concentrations of 100 fg/μL.
The calibration curve achieved percentage relative standard deviations (%RSD’S) for all congeners of below 8%. All ion ratios were within a specified limit of 15%. From the lowest concentration (CSL) standard injection, an LOD can be calculated for the calibration curve, based upon 50 g of sample extracted, containing 3% lipid, using a minimum signal to noise ratio of 3:1 for LOD purposes, and a minimum signal to noise ratio of 8:1 for LOQ purposes.
Table 1 presents the mean rrf’s, %RSD’s, signal to noise ratios and LOD values for the 17 2,3,7,8- chlorinated PCDD/Fs analysed. The data is based upon the DF-A10 CSL standard, which has concentrations of 50 fg/µL for all non-labelled PCDD/Fs except OCDD and OCDF that have concentrations of 100 fg/µL.
Figure 1 contains the calibration curve determined by TargetLynx for 2,3,7,8-tetrachloro dibenzo-p-dioxin, one of the two most toxic PCDD/Fs.
The lowest EU limit for animal feeds is currently 0.5 ng/kg WHO-TEQ) for citrus pulp, which with an LOQ required at a maximum of 1/5th of the level of interest requires an LOQ of 0.1 ng/kg WHO-TEQ.
Figures 2 and 3 show the mass chromatograms for 2,3,7,8-TCDD in the citrus pulp extract, before spiking (Figure 2) and after spiking (Figure 3). The 100 fg spiked citrus pulp extract gave a signal to noise ratio of 62:1, in matrix. This value equates to a detection limit of 4.8 fg/μL on column in citrus pulp extracts, based upon an LOD signal to noise ratio of 3:1. This value compares favourably with the 3.9 fg/uL detection limit gained from the CSL calibration standard presented in table 1 above.
Figure 4 shows the mass chromatograms for 1,2,3,7,8-PeCDD, with the internal standards displayed for the un-spiked citrus pulp sample
Figure 5 shows the mass chromatograms for 1,2,3,7,8-PeCDD with the internal standards displayed for the 100 fg spiked citrus pulp sample.
These chromatograms demonstrate the sensitivity of the instrument, giving clearly defined peaks for 100 fg with good signal to noise ratios, enabling the required LOD/LOQ to be achieved in a matrix sample.
Table 2 contains the results for the determined levels in the unspiked citrus pulp extract, showing a total WHO-TEQ (ng/kg, lipid) giving a lowerbound total TEQ value of 0.063 ng/kg. This value falls well below the legislative limit of 0.5 ng/kg (WHO-TEQ), the required LOQ of 1/5th the level of interest and demonstrates the performance of the Waters AutoSpec Ultima at just above LOQ levels.
The lower bound total TEQ is defined as the sum of all detected PCDD/Fs, with any congeners at or below the LOD reported as zero.
The medium bound total TEQ is defined as the sum of all PCDD/Fs, with any congeners at or below the LOD reported as half the LOD value.
The Upperbound total TEQ is defined as the sum of all PCDD/Fs, with any congeners at or below the LOD reported as the LOD value.
The 3 total-TEQ values reported in table 3 satisfy the EU quantitative requirement, that the difference between the Upperbound and lowerbound levels shall not exceed 40%, with the difference being 19%.
The results above clearly demonstrate that the performance of the Waters AutoSpec Ultima NT, comfortably well below the required LOD of EU legislation, provides the analyst with confidence and accuracy when reporting results close to the legislative limit.
720000739, September 2003