• Application Note

Accurate Mass Determination of Narrow Electrophoretic Peaks Using an Orthogonal Acceleration Time-of-Flight Mass Spectrometer

Accurate Mass Determination of Narrow Electrophoretic Peaks Using an Orthogonal Acceleration Time-of-Flight Mass Spectrometer

  • M.E. Palmer
  • Malcolm R. Clench
  • L.W. Tetler
  • David Little
  • Division of Chemistry, School of Science and Mathematics, Sheffield Hallam University
  • Waters Corporation

Abstract

This application note investigates the use of the Micromass LCT coupled to CZE and also the on-line separation of a drug substance and related impurities has been achieved.

Introduction

CZE-ToF MS has recently been successfully applied to the analysis of standard peptide and protein mixtures1-6. Accurate mass measurement of electrophoretic peaks has also been achieved to aid protein identification by peptide mapping1. However to the best of the author’s knowledge this is the first example of accurate mass measurement of low molecular weight pharmaceutical compounds using CZE-oa-ToF mass spectrometry.

Separations in CZE are obtained by differential migration of charged solutes through a capillary column when under the influence of an electric field. This separation occurs because of differences in the electrophoretic mobilities of analyte ions. Electrophoretic mobility is based on charge-to-size ratio (i.e. a highly charged, small ion will migrate faster than a lesser charged, large ion). A feature of CZE is the electroosmotic flow (EOF), which is the bulk flow of liquid through the column. The EOF arises through ionic interaction with the capillary wall, these ions move (and drag the bulk liquid) through the column by electrostatic attraction when the separation voltage is applied. The EOF through the capillary has a flat-flow profile (unlike the laminar flow associated with pressure flow techniques), which results in lower solute zone diffusion and extremely efficient separations, (plate numbers/metre in excess of 1 x10⁵ are common).

Peak widths produced are of the order of a few seconds, requiring very fast acquisition rates and high sensitivities (usually ng quantities are injected onto the capillary). Scanning instruments may have difficulty in obtaining sufficient data points across such narrow peaks (although the use of selected ion monitoring (SIM) mode may overcome this). ToF MS has distinct advantages over scanning instruments, these include sensitivity (due to high duty factors, leading to a greater percentage of the ions formed being detected), fast acquisition rates (upto 10 spectra s-1), and high m/z range. oa-ToF mass spectrometers seem ideally suited to being coupled with capillary zone electrophoresis (CZE).

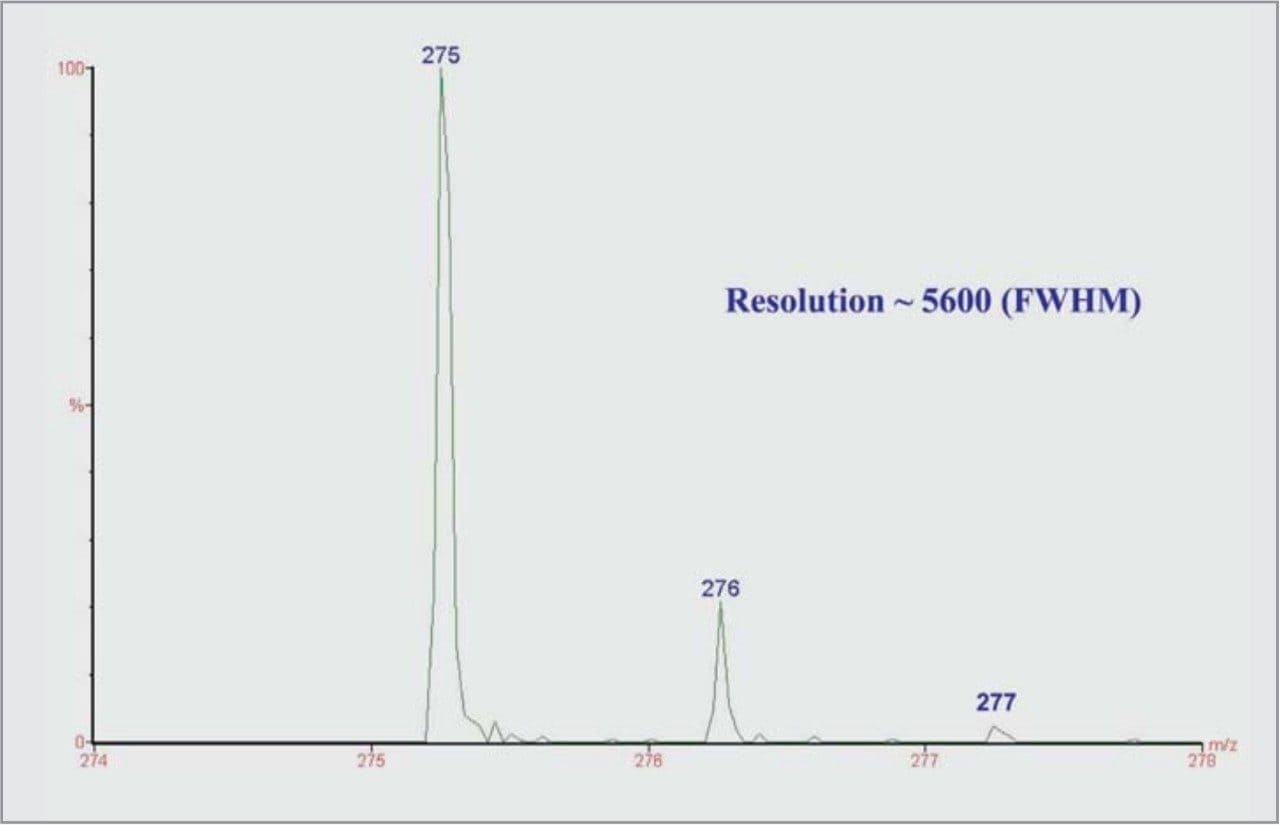
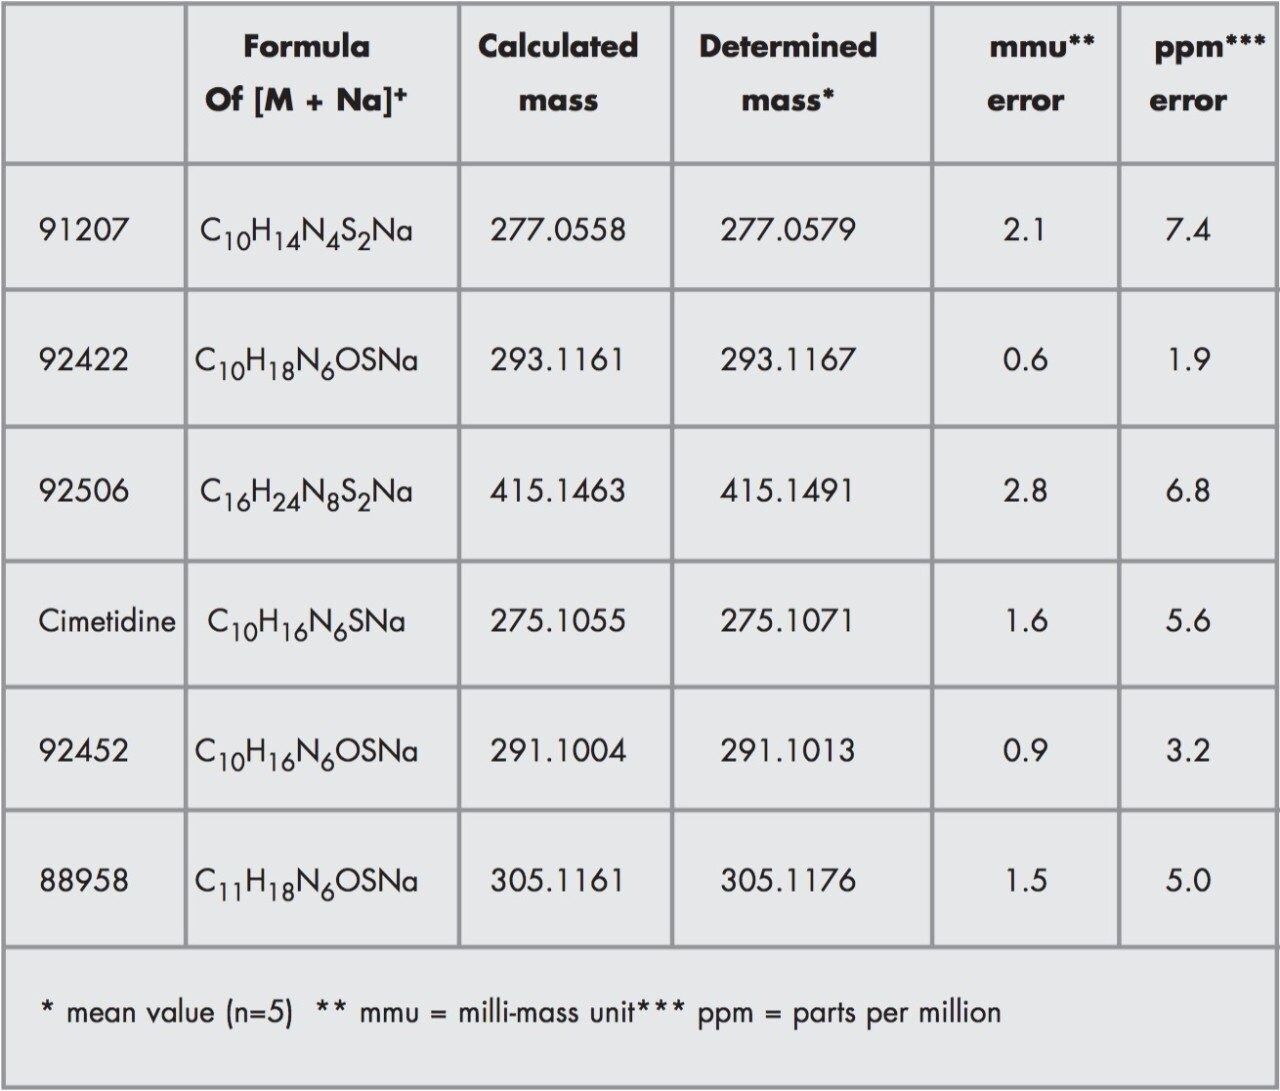
The Micromass LCT is an oa-Tof instrument which is capable of resolutions of 5000 full width half maximum (FWHM) and gives mass measurement accuracies of better than 5ppm, allowing the molecular formula to be predicted or confirmed.

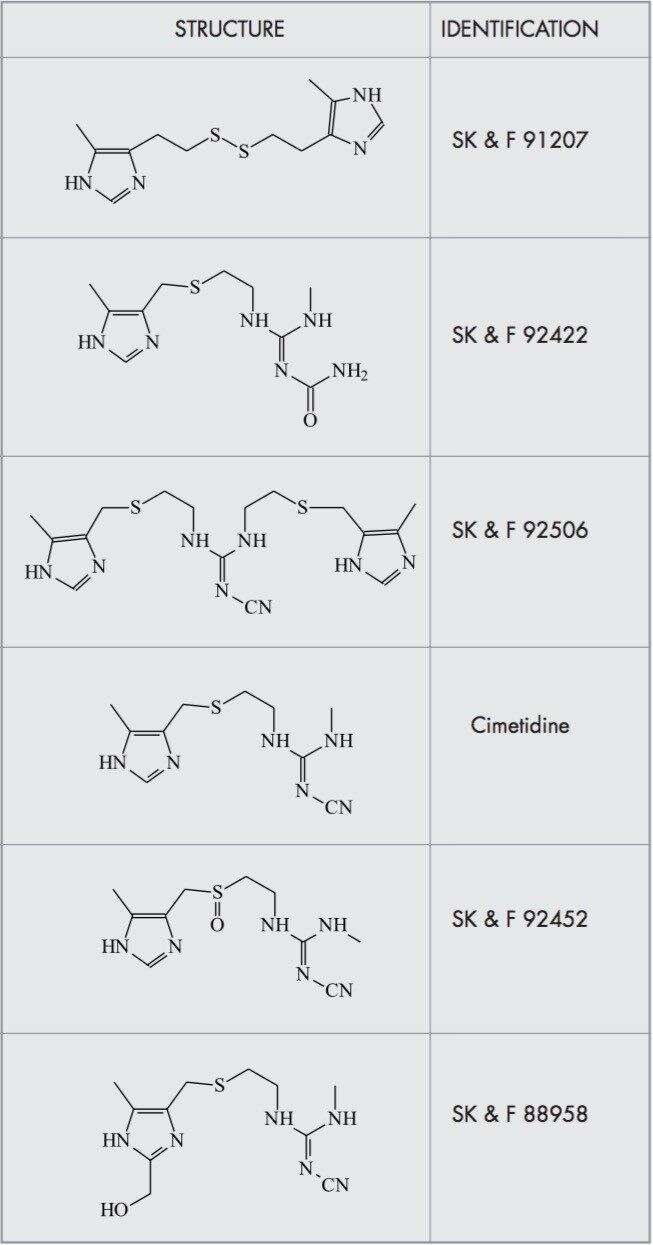
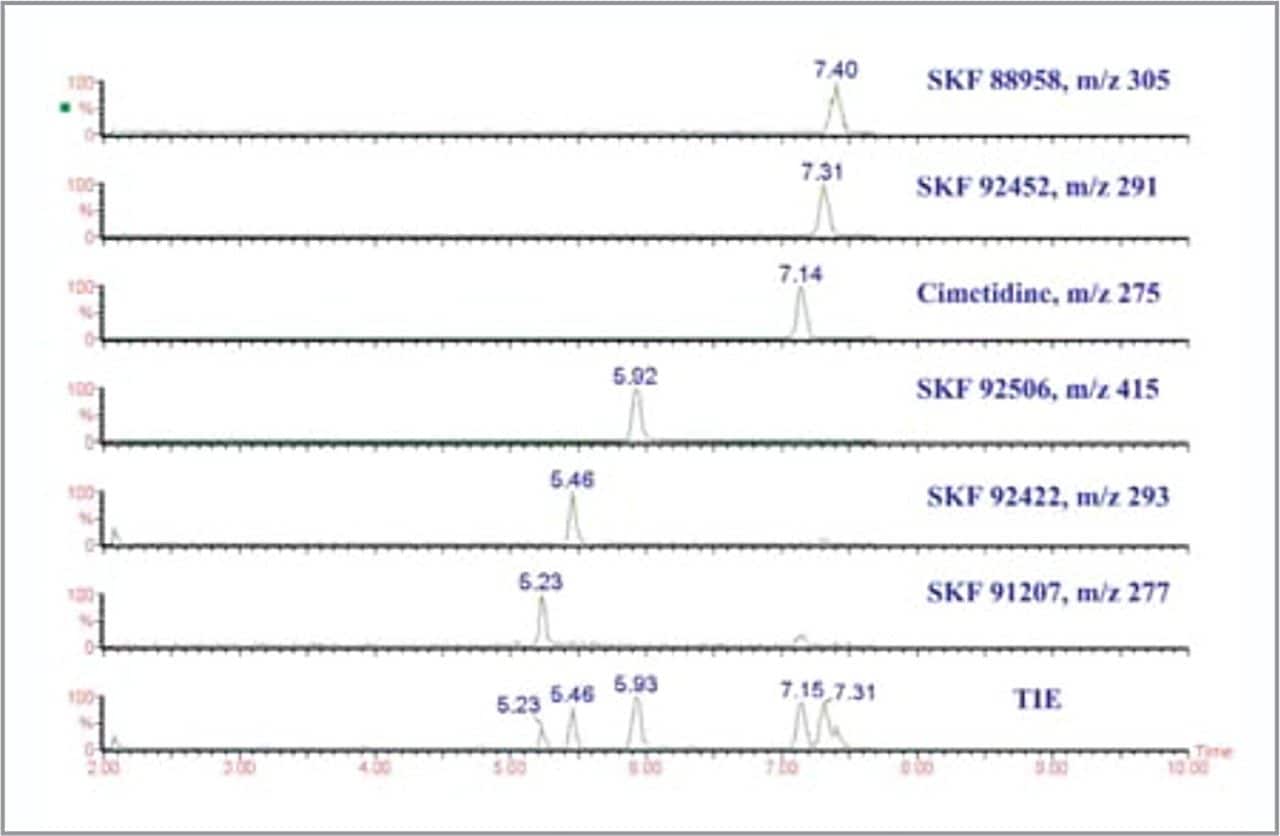
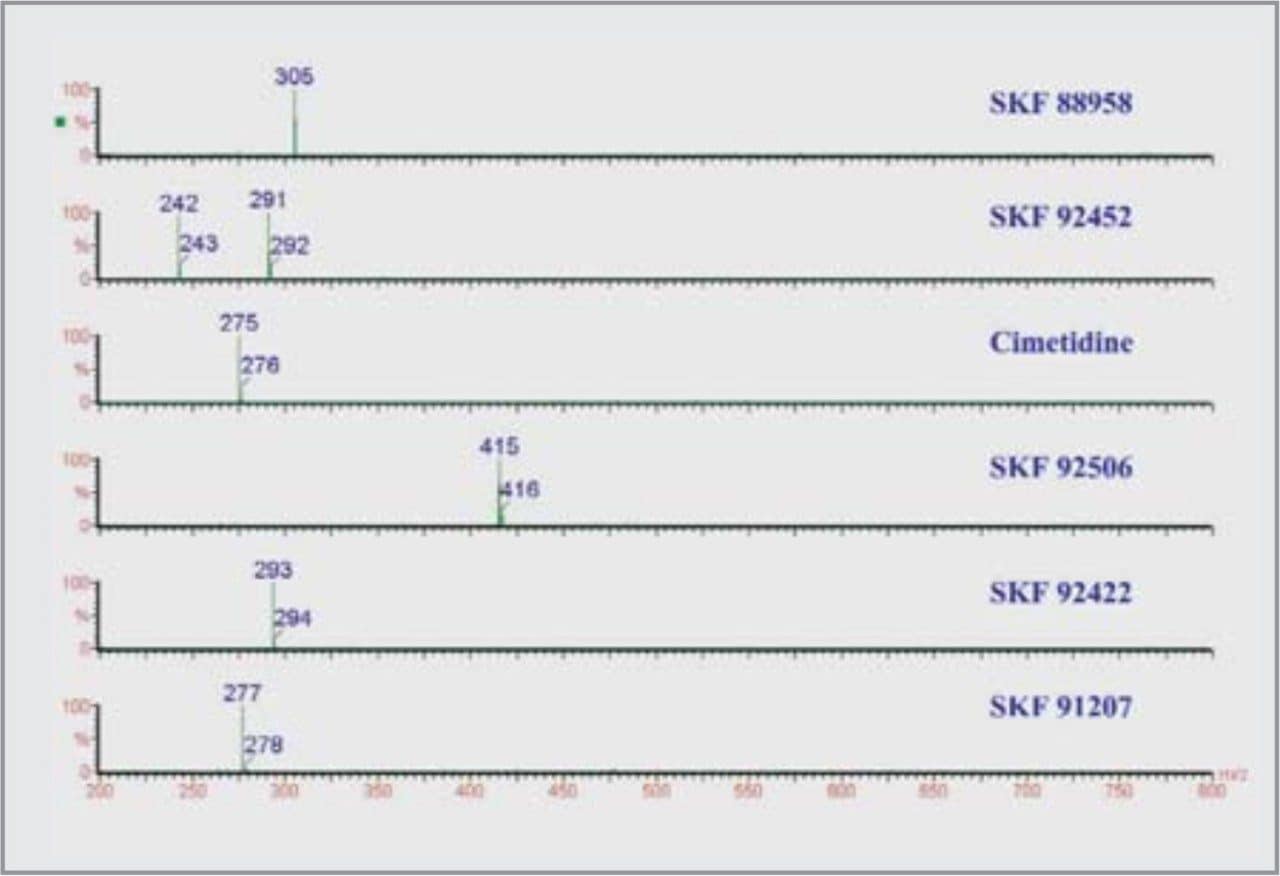
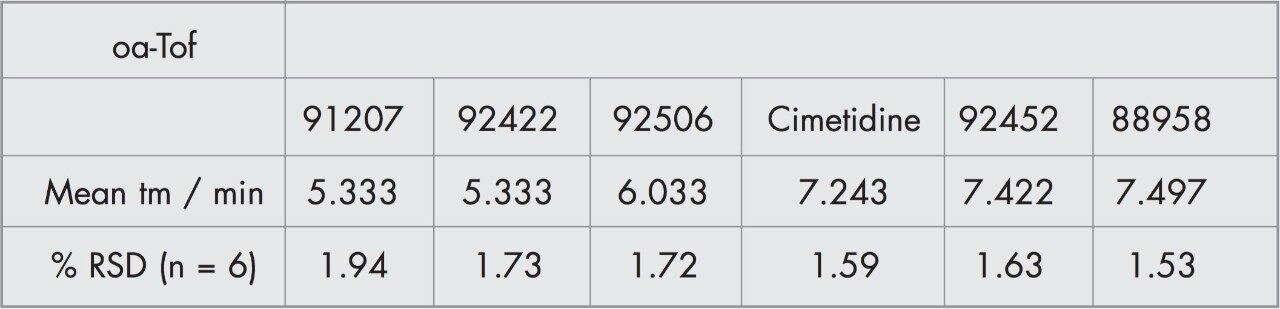
We have investigated the use of the Micromass LCT coupled to CZE. The on-line separation of a drug substance and related impurities has been achieved.

Experimental

Cimetidine and related impurities (Table 1) were supplied by SmithKline Beecham Pharmaceuticals, (Harlow, Essex) 1 mg/mL stock solutions were diluted with water to suitable concentrations. All solvents and reagents used were of reagent grade or better.

Table 1. Compounds analyzed

CE Separation

A PrinCE Model 450 CE System (Prince Technologies, Emmen, Netherlands) was used throughout this study. The buffer comprised 10 mM sodium dihydrogen phosphate adjusted to pH 3.1 using 0.1 M HCl. The column was washed between analyses with 0.1M NaOH (1 bar, 0.5 min), water (1 bar, 1.0 min) and buffer (1 bar, 2.0 min).

Separations were performed using an uncoated fused-silica 50 μm i.d., 375 μm o.d., 70.5 cm capillary (total length, including 10.5 cm spray capillary) (Composite Metal Services Ltd, Hallow, UK). Samples were injected hydrodynamically (1 bar, 0.05 min) and separations were achieved with a field strength of 370 Vcm-1 (30 kV), with +4.0 kV applied to the outlet (cathode) to facilitate the electrospray process.

Mass Spectrometry

A Micromass LCT oa-ToF mass spectrometer was used. Positively charged ions were formed using a Z SPRAY CZE interface (Figure 1) in the electrospray mode. The ion source was operated with a probe voltage of 4.0 kV and a cone voltage of 25V. The mass spectrometer was operated with a pusher frequency of 20 kHz. Mass data were acquired at a rate of 2 spectra/second over the m/z range 200-800. Instrument resolution was measured at 5600 (m/∑m, FWHM) using the pseudo-molecular ion of cimetidine (m/z 275). An instrument base mass calibration was generated using the ammoniated ions of a polyethylene glycol mixture. Any subsequent mass drift was corrected for using a single point lock mass on a per spectrum basis.

Figure 1. A schematic of the Z SPRAY CE Interface

A make-up sheath-flow is used to aid the electrospray process (the CZE flow rate is insufficient on its own). The sheath-flow consisted of 2 μL/min 0.5 ng/μL erythromycin, 50/50 (V/V) water/acetonitrile. The pseudo-molecular ion of erythromycin ([M+Na]+, m/z 756.4510) provided the lock mass for accurate mass measurement. Accurate masses were measured using the mean of 3 consecutive scans from an electrophoretic peak following “lock mass” correction. Nitrogen (5psi) was used to assist electrospray nebulization. The separation capillary was coupled to a spray capillary using a Microtight Junction (Upchurch Scientific, Anachem, Luton UK), a PEEK union designed specifically for fused-silica to minimize deadvolume. The spray capillary was 50 μm i.d., 175 μm o.d. and 10.5 cm in length. The reduced o.d. of the capillary was used to assist the electrospray process.

Results and Discussion

A separation method based on CZE-UV has been developed7 and has been employed in this investigation.

The mass electropherograms (Figure 2) for the separation of cimetidine and related impurities are consistent with those previously obtained by the above method1,2, without any changes in selectivity. The total ion electropherogram (TIE) enables the use of the oa-ToF to investigate unknown analytes, where selected ion monitoring or mass electropherograms would be impossible. All of the analytes are well resolved with the exception of SK&F 92452 and 88958, there is a slight degree of co-migration, but the analytes are well resolved by their masses. Peak widths are between 6 and 10 s (at baseline), which means that between 12 and 20 spectra are obtained for each peak, allowing sufficient data points to be acquired across the peak for it to be accurately represented.

Figure 2. oa-Tof Mass Electropherograms

The mass spectra (Figure 3) of the peaks contain [M+Na]+ species of very high S/N ratio (sodiated species are obtained rather than protonated species due to the high concentration of sodium in the CZE buffer). The spectra are very clean, featuring the compound of interest only. The isotope pattern of the ions (Figure 4) indicates the high resolution obtained from the oa-ToF (>5500 FWHM).

Figure 3. oa-Tof Mass Spectra
Figure 4. Expanded Region of Cimetidine [M+H]+ from oa-Tof

Migration Time Reproducibility

In order to assess the reproducibility of migration times (tm), replicate injections were performed. The results are presented in Table 2.

Table 2. Replicate injections performed to assess the reproducibility of migration times (tm).

Peak Efficiency

The peak efficiency is a measure of the extent of band broadening within a column, the higher the efficiency the narrower and sharper the peak shape.

The peak efficiencies obtained by CZEMS were calculated to be between 3 x10⁴ and 5 x10⁴ plates m-1.

Exact Mass Data

The exact mass is assigned by the use of an internal lock mass (in this case, erythromycin ([M+Na]+@ m/z 756.4510) present in the sheath liquid). Exact masses were measured for three consecutive scans from an electrophoretic peak and the mean calculated.

‡ where efficiency was calculated by:

N = 16(tm/Wb)2

The exact mass data are presented in Table 3, all values are below 10 ppm error, which would allow prediction or confirmation of empirical formulae.

Quantification

The potential for using an oa-ToF mass spectrometer for quantification was investigated. A dilution series was performed and the response factor calculated (for the concentration ranges 50 - 1 ng/μL for cimetidine, SK&F 91207, 88958, 92452; 100 - 2 ng/μL for SK&F 92452 and 200 - 4 ng/μL for SK&F 92506) using the quantification software within the MassLynx NT operating system. Cimetidine was used as an internal standard (to accommodate any variation in injection volume and spray efficiency). The calibration curves were linear across the concentration ranges used, with r2 values of ~0.99. The calibration curve obtained for SK&F 91207 is shown in Figure 5.

Figure 5. SK & F 91207 calibration curve

The dilution series resulted in a detection limit of 0.5 ng/μL for cimetidine, at a S/N ratio of ~5:1, which relates to ~35 pg injected on-column.

Conclusion

Capillary zone electrophoresis has been successfully interfaced to an oa-ToF mass spectrometer.

Exact masses have been obtained with less than 7ppm error. Such precise mass measurements allowed the confirmation molecular formula.

The mass electropherograms generated demonstrated the high sensitivity of the oa-ToF. The mass spectra were generally pure, featuring the pseudo-molecular ion of the compound of interest. The isotopic patterns observed indicated the high resolution available (5600 FWHM).

The potential for CZE-oa-ToF quantification has been demonstrated, linear calibration curves have been obtained with r2 values of ~0.99.

The Z SPRAY CE interface can be used with lower make-up flow rates (0.5 - 2 μL/min) than previous interface designs (5- 10 μL/min). Lower make-up flow rates result in reduced dilution of the CE effluent and hence improved electrospray sensitivity.

The size and accessibility of the Z SPRAY CE interface allowed the use of a short CE column (70.5 cm).

It should also be noted that the Z SPRAY design allowed the successful use of an involatile CE buffer (10mM sodium dihydrogen phosphate). No source cleaning was required during the period of this study.

References

  1. Cao P; Moini M. Rapid Commun. Mass Spectrom. 12 864 (1998).
  2. McComb ME; Krutchinsky AN; Ens W; Standing KG; Perreault H. J. Chromatogr A 800 1 (1998).
  3. Banks JF; Dresch T. Anal. Chem. 68 1480 (1996).
  4. Fang L; Zhang R; Williams ER; Zare RN. Anal. Chem. 66 3696 (1994.)
  5. Muddiman DC; Rockwood AL; Gao Q; Severs JC; Udseth HR; Smith RD. Anal. Chem. 67 4371 (1995).
  6. Wu JT; Quian MMG; Li MMX; Liu L; Lubman DM. Anal. Chem. 68 3388 (1996).
  7. Ellis DR; Palmer ME; Tetler LW; Eckers C. J. Chromatogr A 808 269 (1998).

Acknowledgements

The authors wish to thank Dr. C Eckers (SmithKline Beecham Pharmaceuticals) for providing the samples and useful discussions.

Featured Products

720000518, October 2002

Back To Top Back To Top