

For research use only. Not for use in diagnostic procedures.
- Main
-
For research use only. Not for use in diagnostic procedures.
Sigurd Hermansson, Marijn Van Hulle
Waters Corporation, United States
Published on October 5, 2026
For research use only. Not for use in diagnostic procedures.
Phosphatidylethanol (PEth) is a highly specific and sensitive biomarker of alcohol consumption used in clinical, forensic, occupational, and rehabilitation settings, where reliable quantitation can directly impact clinical treatment and legal implications. This application note is based on the work carried out by Falun Hospital in Sweden and presents a robust LC-MS/MS method for the quantitative analysis of PEth 16:0/18:1 in whole blood using a simple extraction procedure that supports efficient implementation in high-throughput laboratories. The method demonstrated exceptional chromatographic robustness, maintaining stable retention times and consistent column performance over more than 22,000 injections on a single analytical column. Excellent quantitative performance was achieved, with calibration curves routinely exhibiting coefficient of determination (R²) values of approximately 0.999 and calibration residuals below 10%. Long-term assay performance showed mean accuracies of 96.0% and 97.6%, with precision of 6.3% CV and 5.6% CV, for QC Low and QC High, respectively, over a seven-month period. The method also delivers outstanding analytical sensitivity, enabling reliable quantitation at 0.05 µM with signal-to-noise (S/N) ratios exceeding 100:1, providing confidence well below decision thresholds. These results demonstrate a sensitive, accurate, and highly robust solution for routine PEth testing across clinical, forensic, occupational, and transplant monitoring applications.
PEth has emerged as one of the most important direct biomarkers for assessing alcohol consumption, providing an objective measure of ethanol intake over the preceding weeks. Unlike self-reported alcohol use, which may be affected by recall bias, social desirability, shame, or concerns regarding potential consequences, PEth is formed only in the presence of ethanol and therefore offers a highly specific indicator of alcohol exposure. As a result, PEth testing has become increasingly valuable in clinical, forensic, occupational, and rehabilitation settings where reliable evidence of alcohol consumption or abstinence is required.
One of the most common applications of PEth analysis is the monitoring of individuals participating in rehabilitation programs or undergoing assessment for reinstatement of a driver's license following alcohol-related violations. In these situations, PEth results may directly influence regulatory decisions, making accurate quantitation particularly important. Similarly, PEth testing is increasingly utilized in occupational health programs where individuals may be required to demonstrate abstinence or sustained low alcohol consumption as part of employment-related assessments.
The research described in this application note was performed in collaboration with Falun Hospital in Sweden. The hospital performs PEth measurements in the management of hypertension treatment. Excessive alcohol consumption is a well-established contributor to elevated blood pressure and may be responsible for uncontrolled or treatment-resistant hypertension. Because patients frequently underestimate or underreport their alcohol intake, clinicians must rely on PEth testing to identify hidden alcohol consumption that could compromise treatment effectiveness. Objective confirmation of alcohol use enables more informed clinical decision-making and facilitates targeted lifestyle interventions that can improve cardiovascular outcomes.
For many of these applications, accurate quantitation around 0.3 µM is of particular clinical relevance, as this concentration range is commonly used to distinguish abstinent or low-level drinkers from individuals with ongoing, potentially clinically significant alcohol consumption.1 At the same time, reliable quantitation at lower concentrations remains important for the detection of emerging alcohol use and for supporting clinical interpretation near relevant decision limits. Consequently, analytical methods must combine excellent accuracy, robustness, and sensitivity with straightforward implementation in routine laboratory workflows.
An application note describing the determination of PEth in whole blood using the Ostro™ Phospholipid Removal Plate has been published.2 This sample preparation strategy yields highly clean extracts and is particularly well suited for laboratories that utilize the same instrumentation for multiple analytical methods, where maintaining optimal instrument performance and minimizing potential matrix-related contamination are critical considerations. For the present application, however, the customer required a high-throughput workflow dedicated to a single analytical assay across multiple instruments. Consequently, a simplified and efficient sample preparation procedure was developed that maintained analytical robustness while supporting a throughput of more than 30,000 injections per year. This approach provides a practical balance between operational efficiency and method performance for routine, large-scale analysis. The method described here addresses these requirements through simplified sample preparation, exceptional chromatographic stability, and sensitive, reproducible quantitation of PEth in whole blood.
Prior to sample treatment, EDTA-blood was frozen for no less than 24 hours at -80 °C for hemolysis. The samples were thawed at room temperature and then placed on a rocker for 5 minutes.
Whole blood calibrator and quality control samples were made in house. Blood was collected from alcohol-abstinent participants, previously tested negative for PEth. Working solutions of PEth were prepared to spike the calibrators. To avoid precipitation in the blood caused by the initial solvent, the working solutions were added to the whole blood in a ratio of 1% v/v. After the standard solution was spiked, each sample was vortexed for 30 seconds and then shaken on a sample mixer for at least 10 minutes.
A volume of 100 μL of calibrator, QC, blank, or sample was transferred into a well of a 2 mL 96 well plate. A volume of 400 µL of 2-propanol (IPA) containing 0.1 µM internal standard (PEth-d5) was added to each well and the plate was vortexed briefly. The well plate was placed in a refrigerator for 15 minutes. The well plate was centrifuged at 10,000 g for 10 minutes. Finally, 200 µL of the supernatant was transferred into another 96 well plate from which 1 µL of the supernatant was injected onto the LC-MS/MS system, without any need for evaporation and reconstitution.
Method Conditions
|
System: |
ACQUITY™ UPLC™ I-Class System with SM-FTN Autosampler |
|
Detection: |
Xevo™ TQ-S micro Mass Spectrometer |
|
Well plate: |
Waters 96 Well 2 mL Collection Plate (p/n: 186002482) |
|
Columns: |
ACQUITY Premier BEH™ C18 2.1 x 50 mm, 1.7 µm Column (p/n: 186009452) |
|
Column temperature: |
60 °C |
|
Sample temperature: |
8 °C |
|
Injection volume: |
1 µL |
|
Mobile phase A: |
10 mM ammonium acetate in 80/20 water/acetonitrile |
|
Mobile phase B: |
80/20 methanol/acetonitrile |
|
Sample manager wash: |
Mobile phase B |
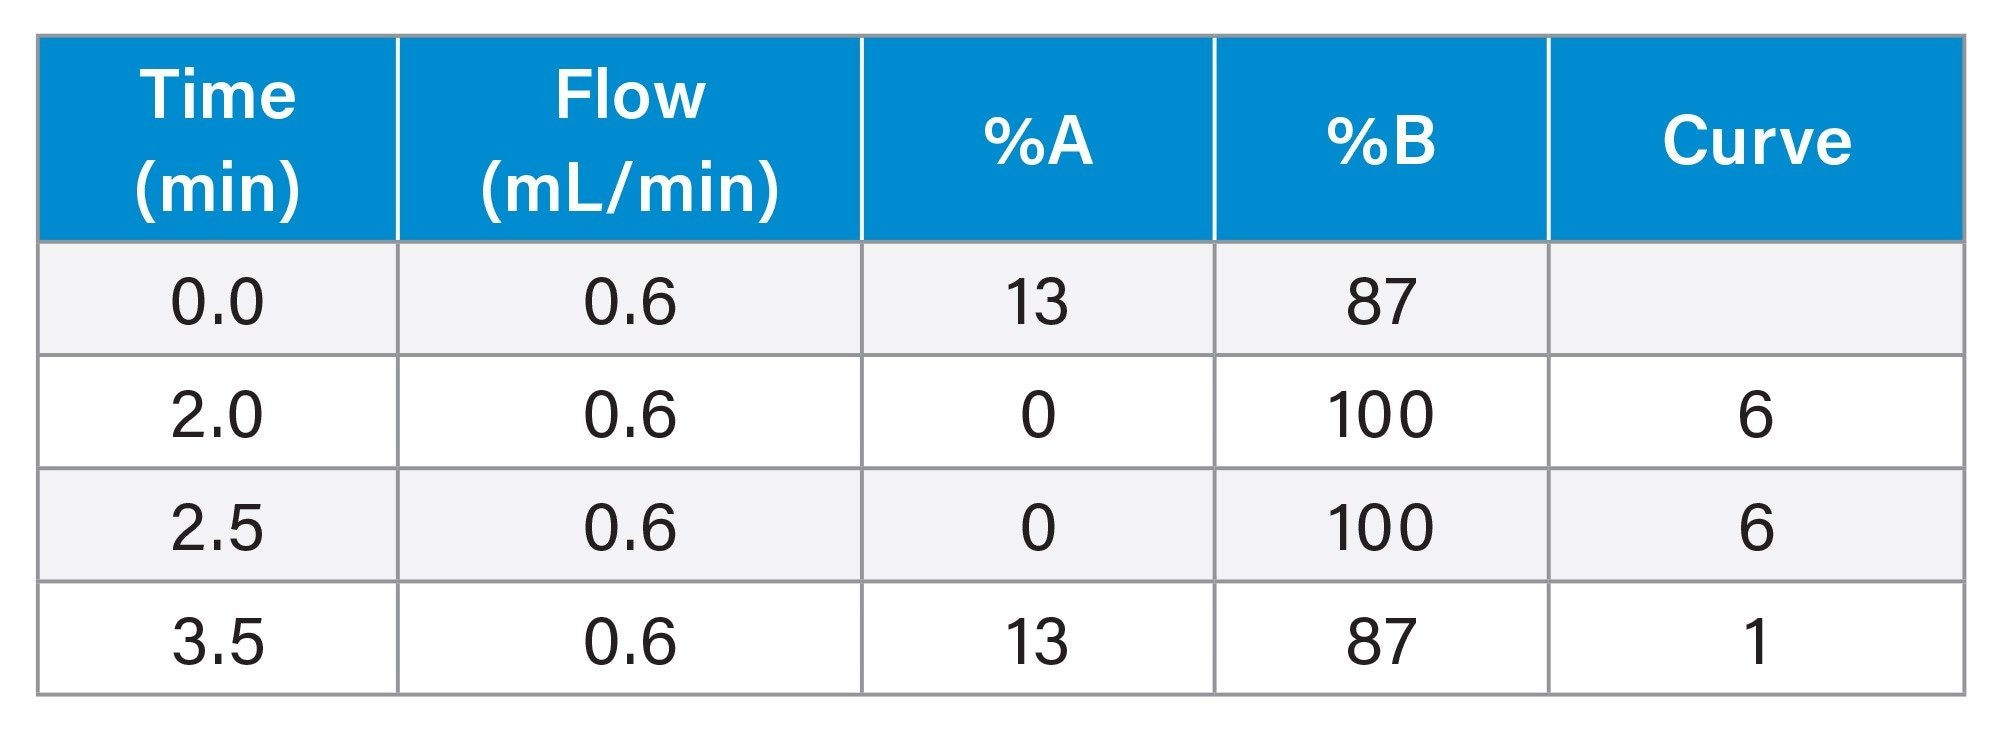
|
System: |
Xevo TQ-S micro Mass Spectrometer |
|
Ionization mode: |
Negative ion electrospray |
|
Capillary voltage: |
2.2 kV |
|
Source temperature: |
150 °C |
|
Desolvation temperature: |
650 °C |
|
Desolvation flow rate: |
1000 L/hr |
|
Cone gas flow rate: |
20 L/hr |
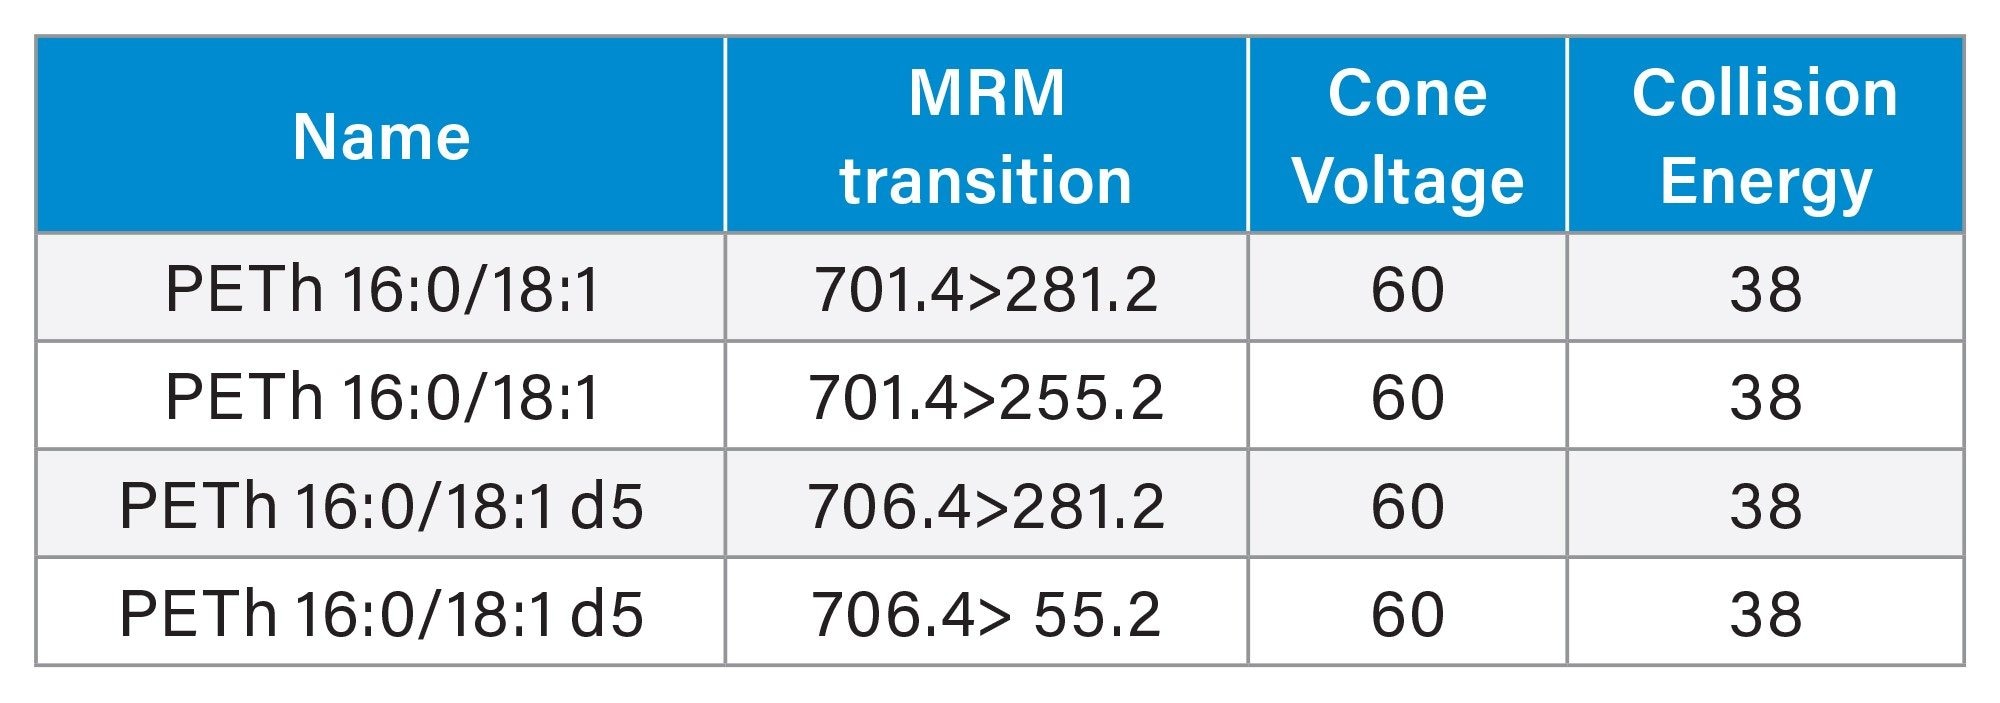
|
MS software: |
MassLynx™ Software 4.2 |
|
waters_connect Software with MS Quan Application |
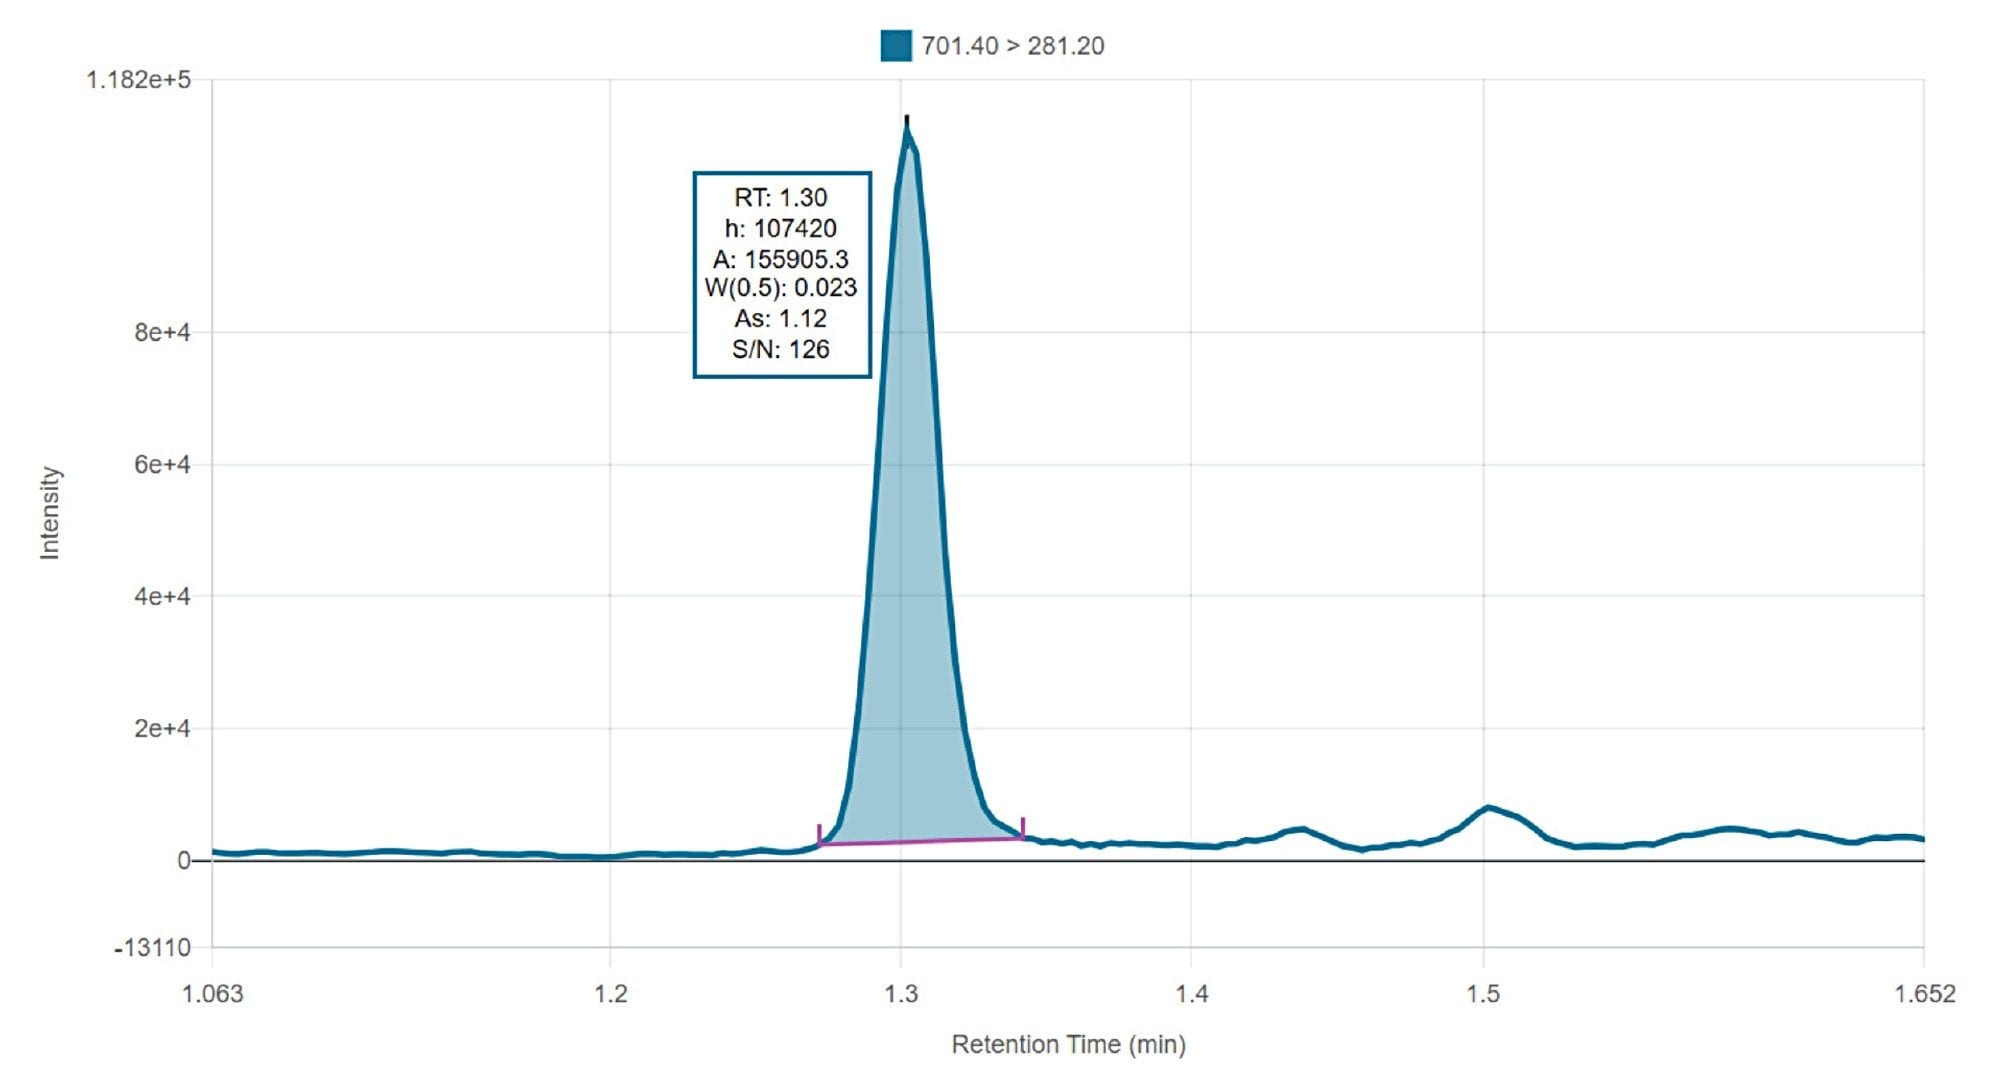
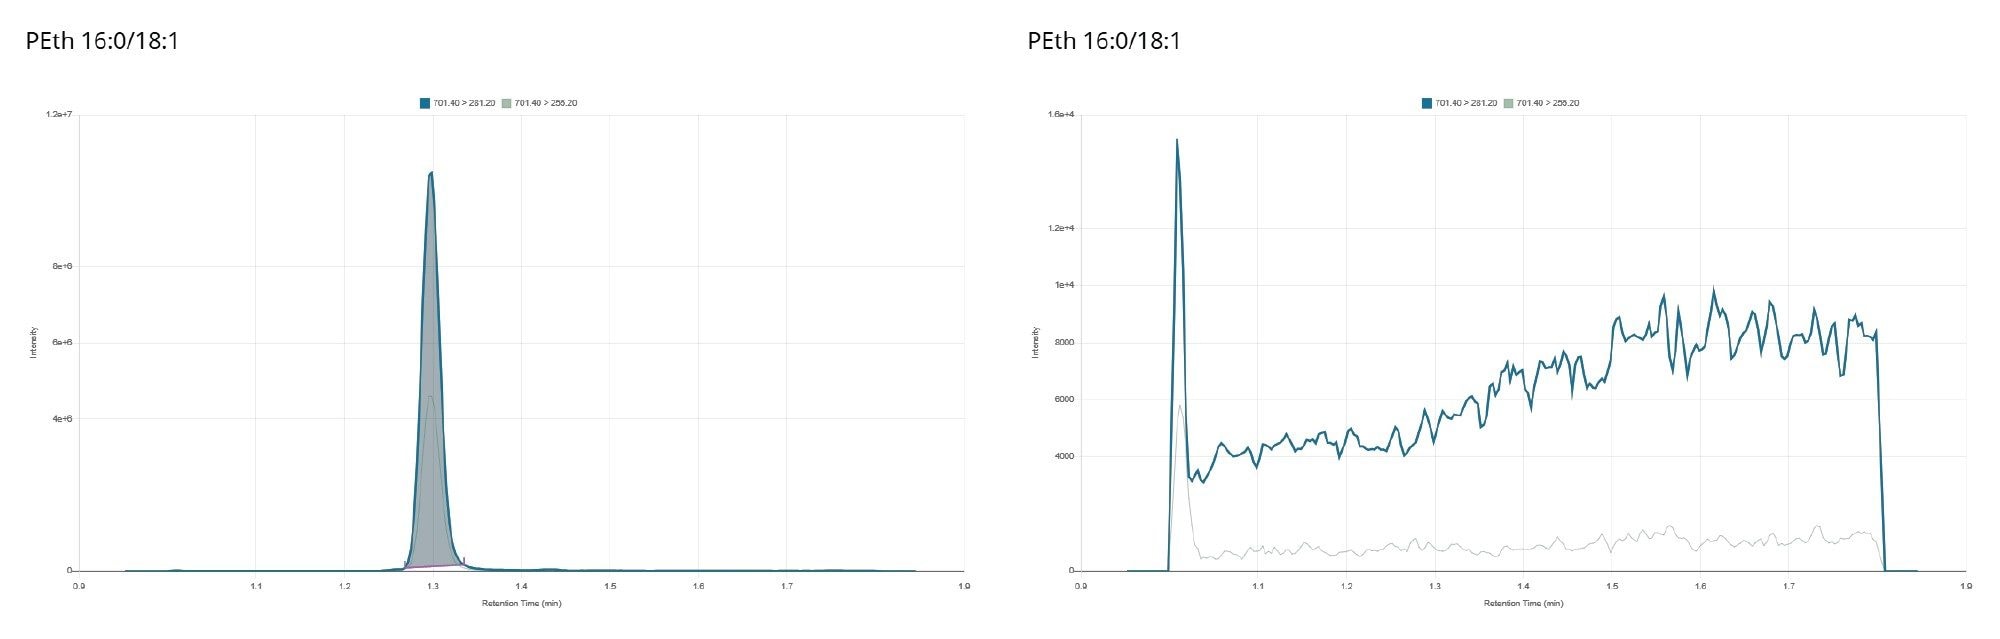
Figure 1 presents the chromatogram for the quantification trace of PEth 16:0/18:1 at the 0.05 µM concentration level. The S/N ratio of >100:1 (peak-to-peak noise) demonstrates the excellent sensitivity of the method. This result indicates enough analytical headroom, suggesting that concentrations below 0.05 µM could be detected and quantified if required. Consequently, the selected reporting limit of 0.05 µM is driven by clinical relevance rather than analytical limitations, ensuring robust and reliable quantitation while maintaining ample sensitivity for the intended application.
A five-point calibration curve was prepared fresh each day of analysis to ensure optimal quantitative performance. A representative calibration curve is shown in Figure 2. The method consistently demonstrated excellent linearity across the calibration range over the evaluation period of seven months, with R² values typically around 0.999. In addition, calibration residuals were routinely maintained below 10% for all calibration levels, confirming the suitability of the model for accurate quantitation. These results highlight the robustness and reliability of the method and support its application for routine PEth analysis in whole blood.
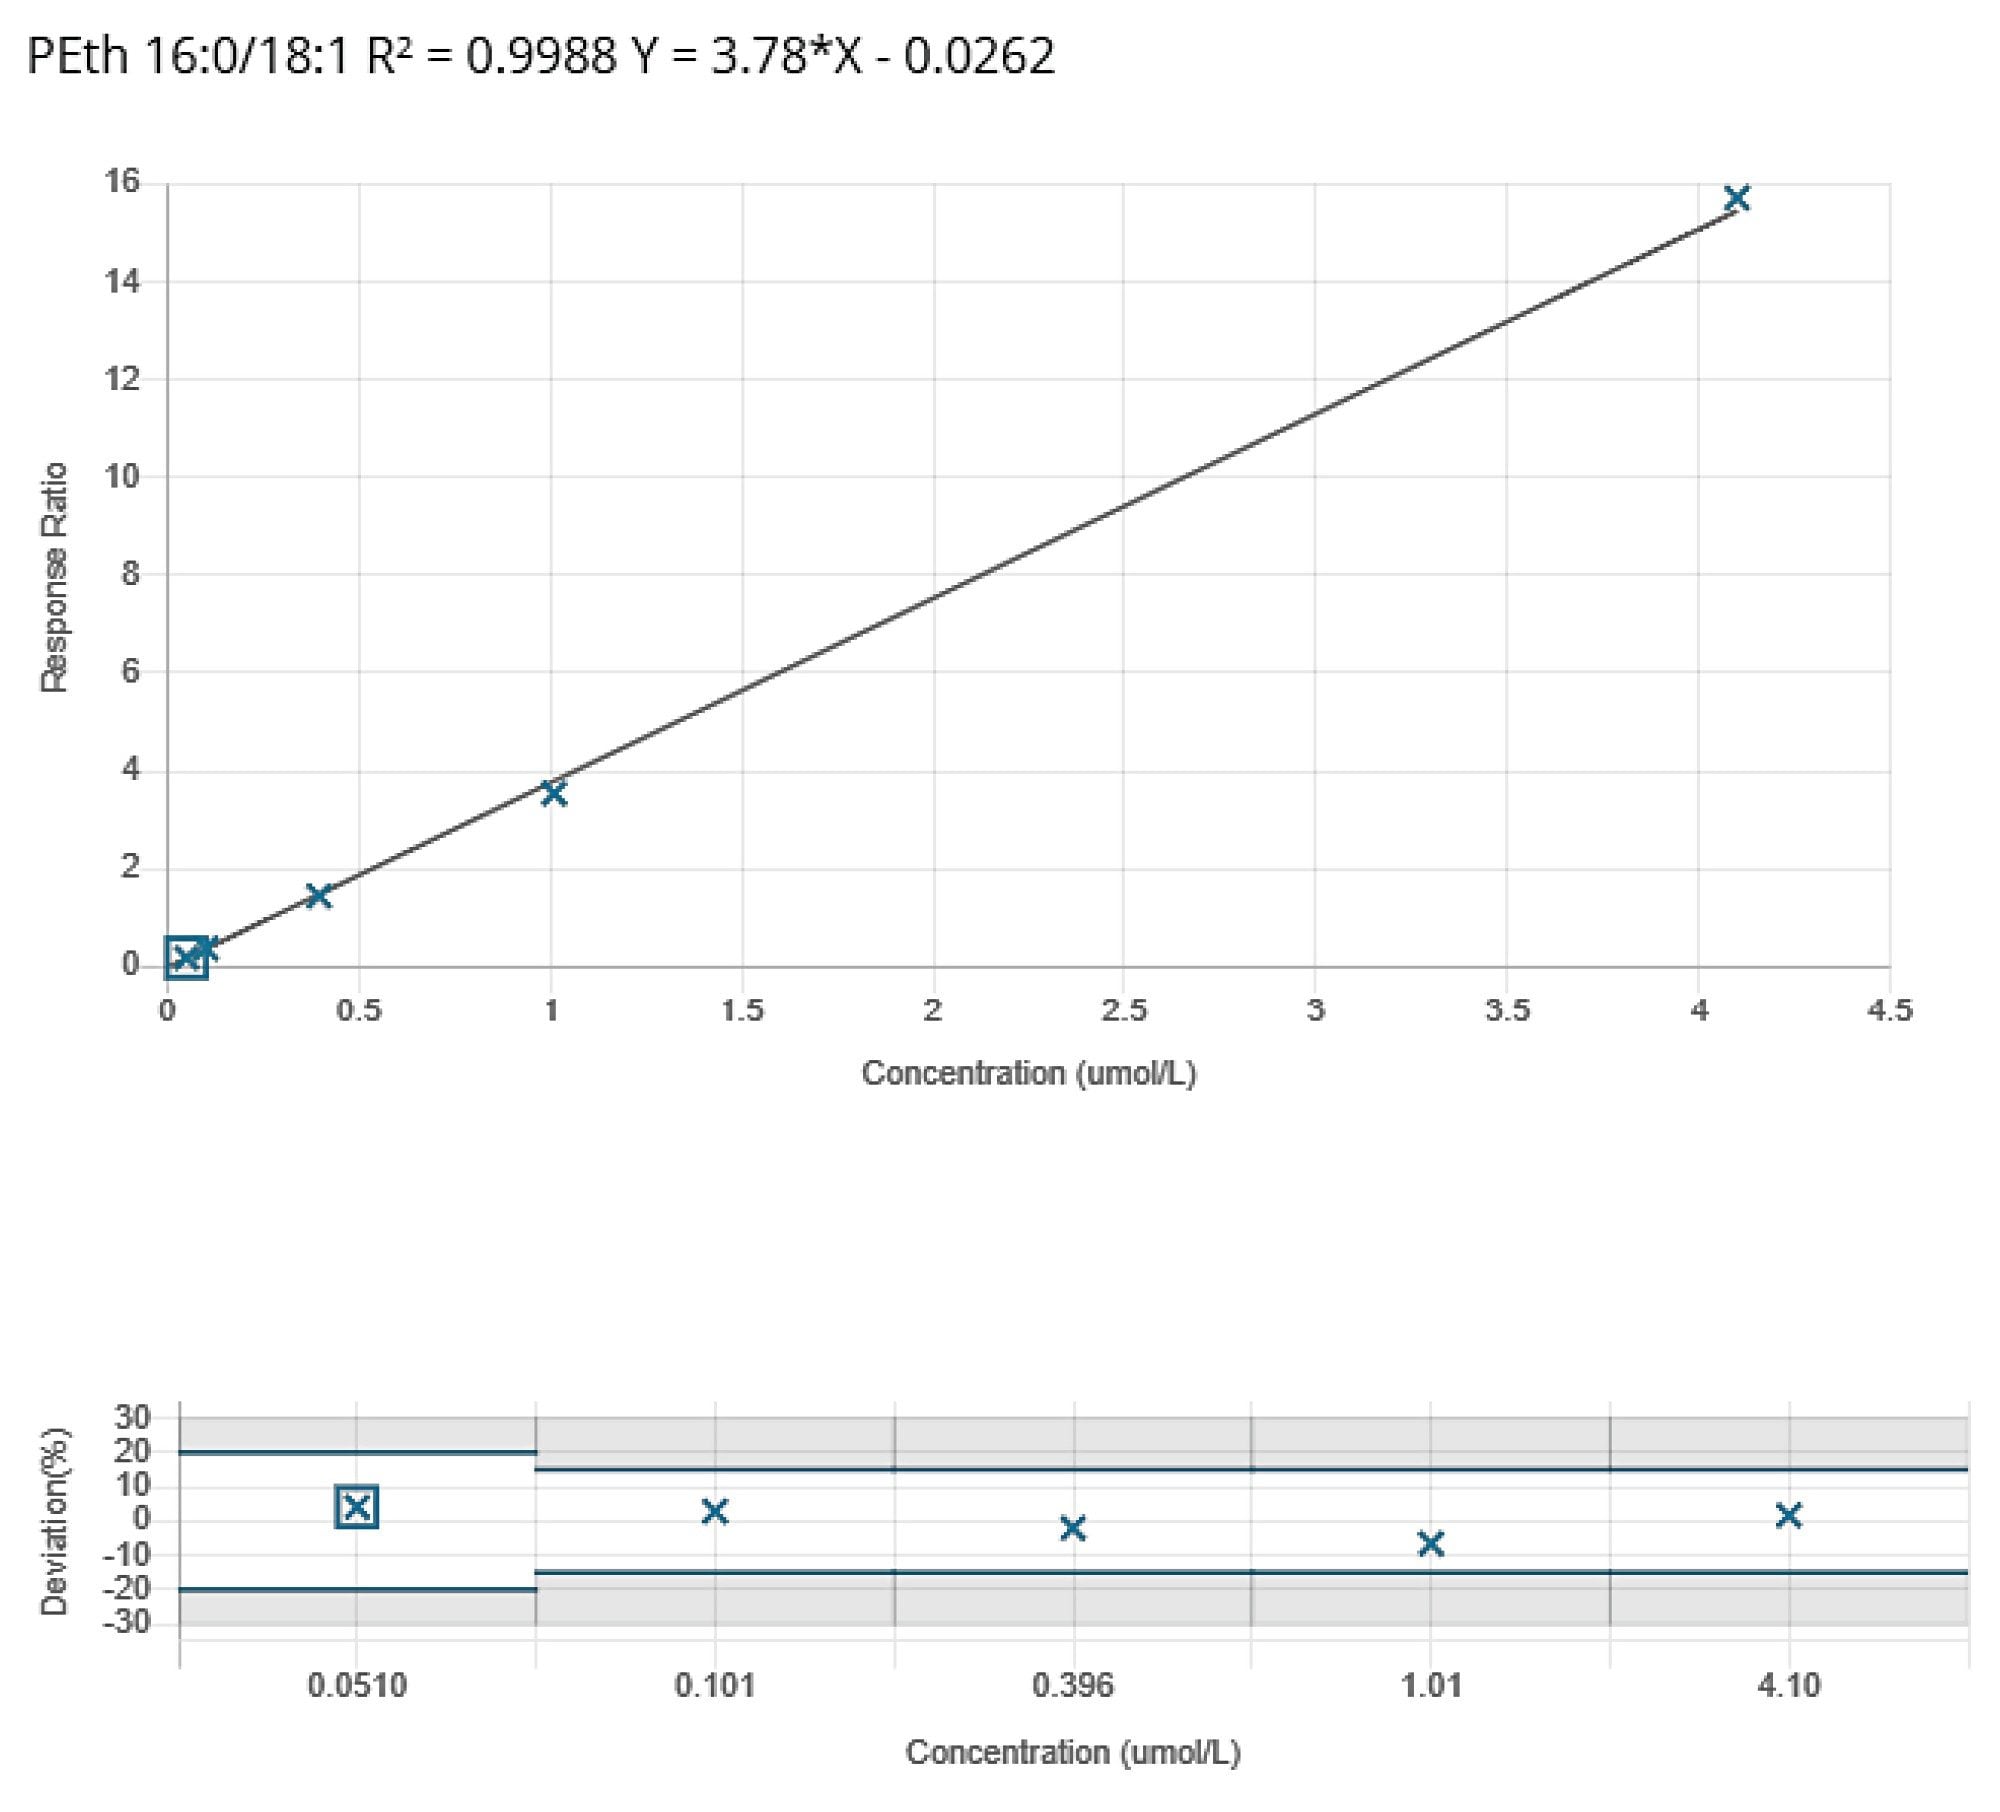
Figure 3 presents representative chromatograms of the highest calibration standard of 4.1 µM (upper trace) and the blank sample injected immediately thereafter (lower trace), illustrating the absence of detectable residual analyte signal in the blank injection. This finding confirms that carryover does not contribute to false positive results in subsequently analyzed unknown samples.
To assess long-term method performance, analytical data collected over a seven-month period were evaluated with measurements acquired daily. For the assessment of the method robustness, the measurements of days 1, 10, and 20 of each month were selected, resulting in a total of 19 data points. The retention time, peak area, and calculated concentration of the QC High are presented in Figure 4.
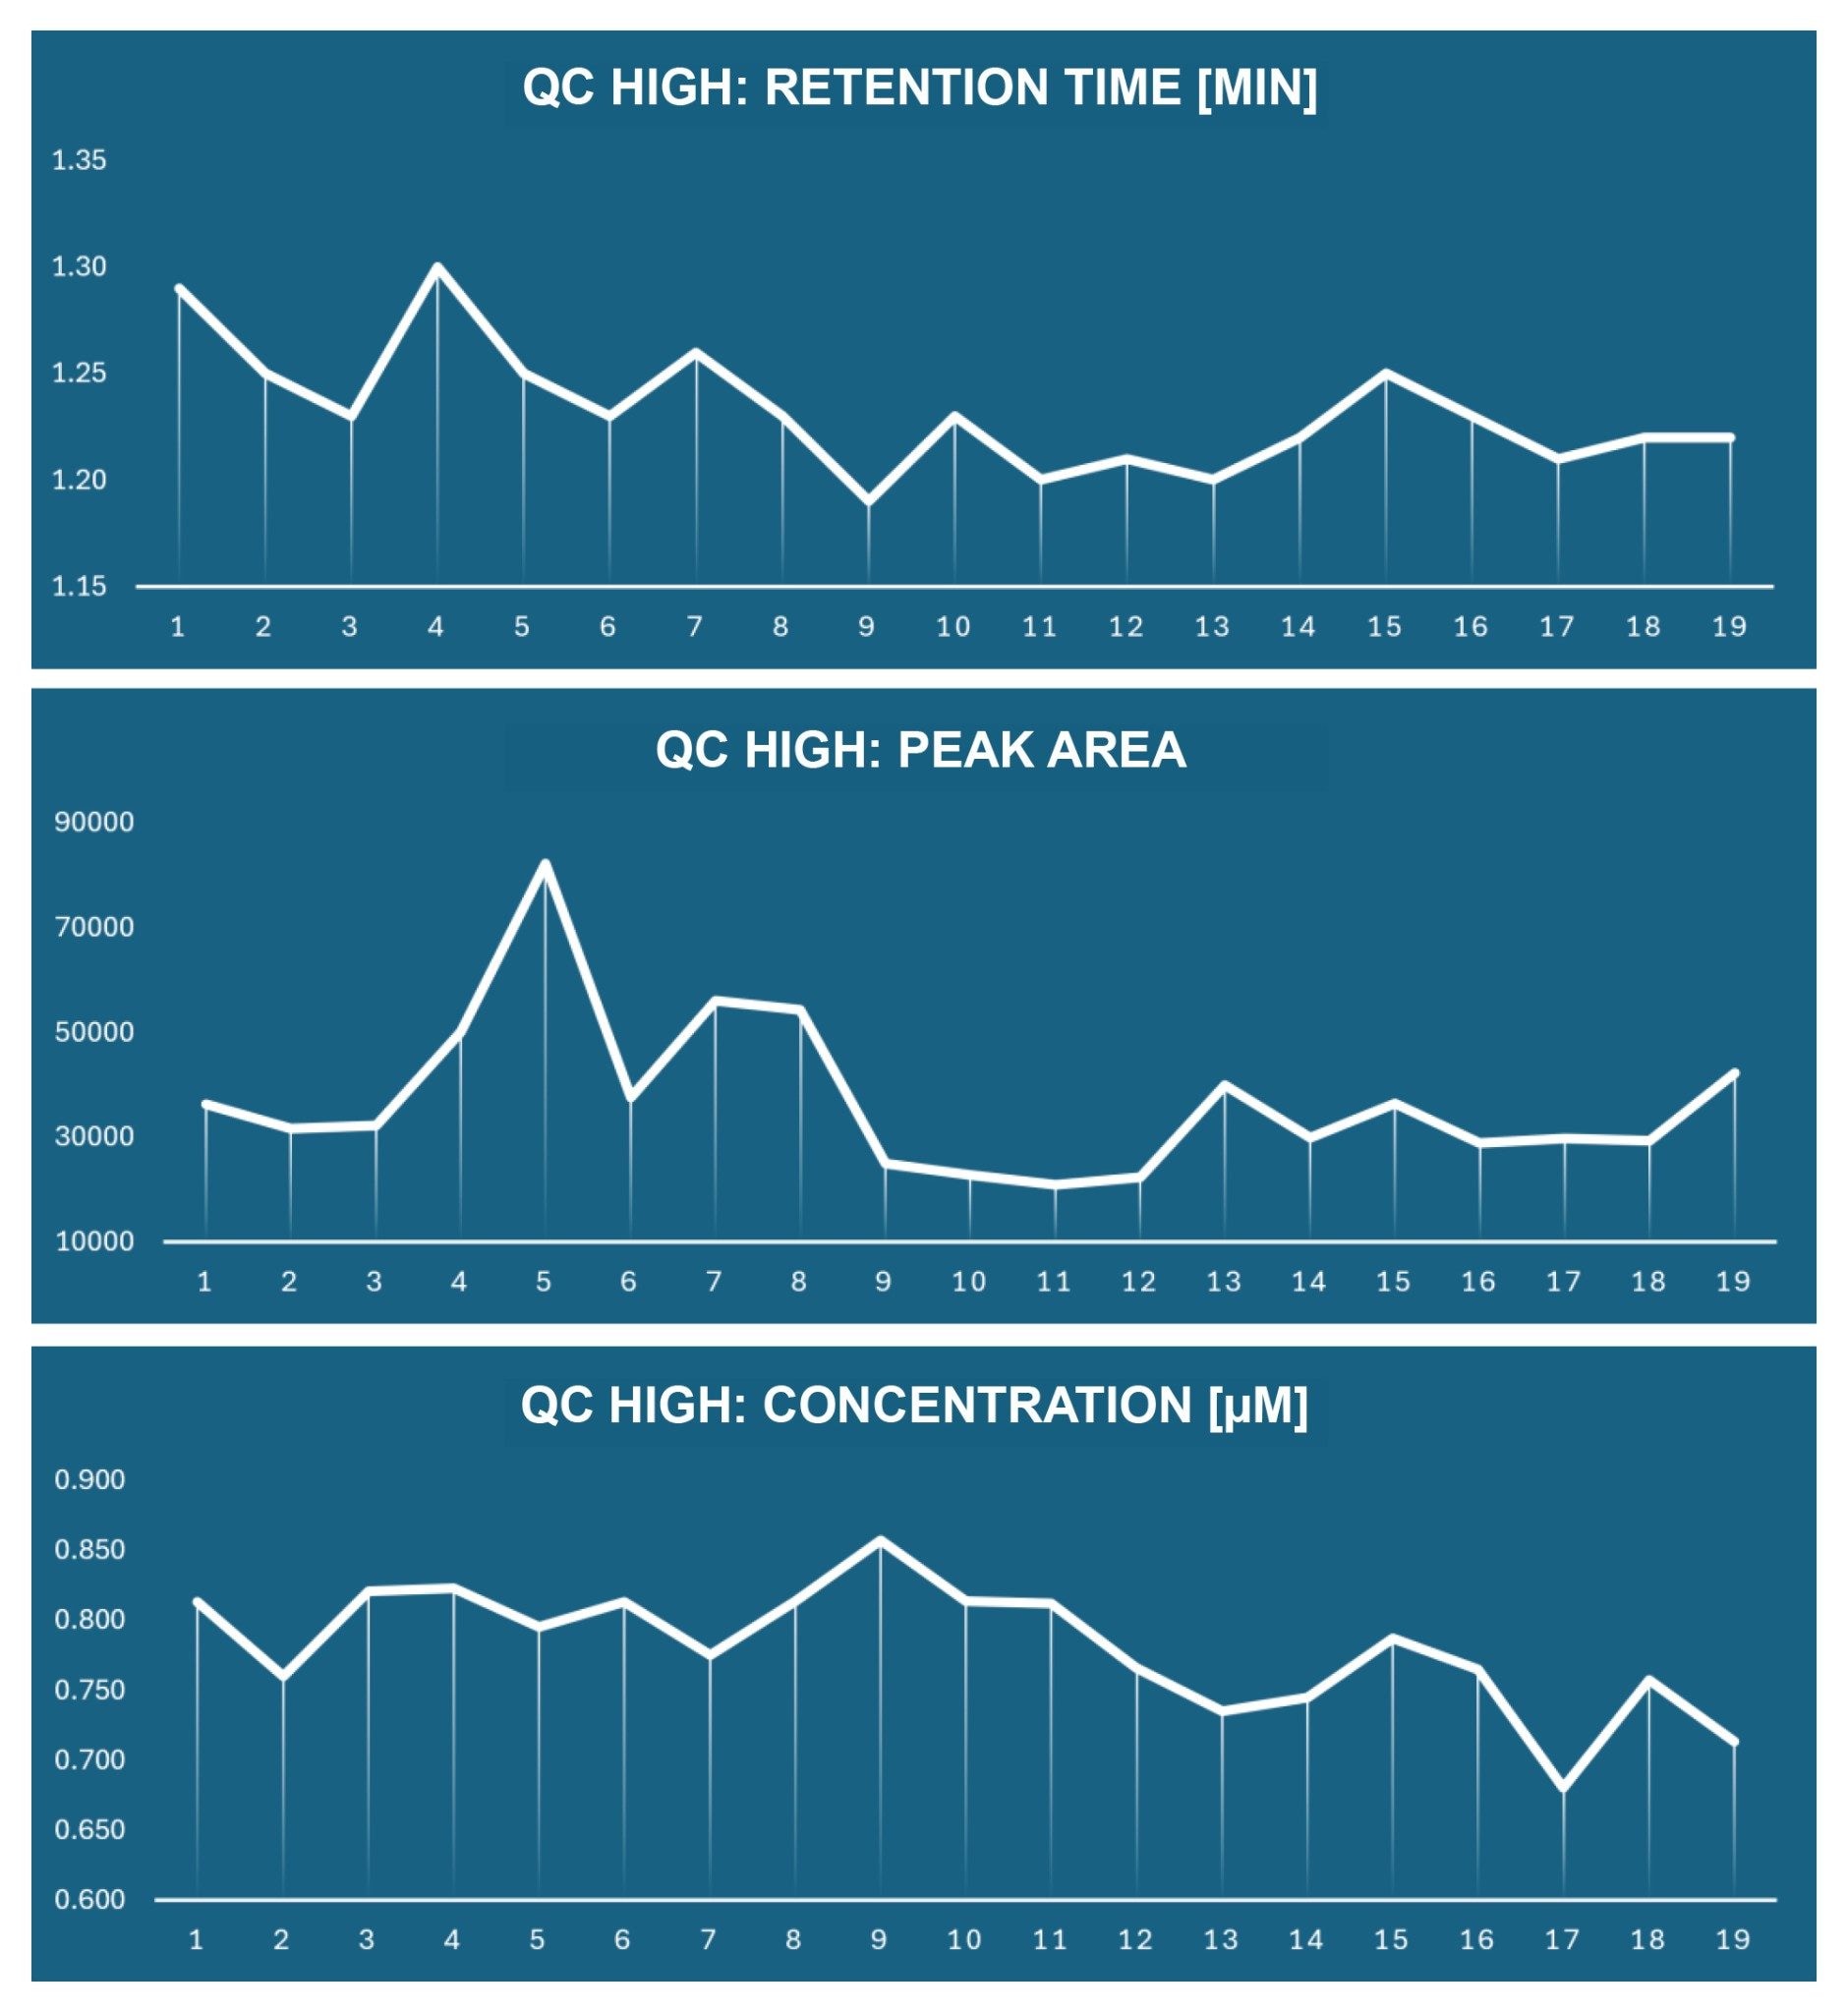
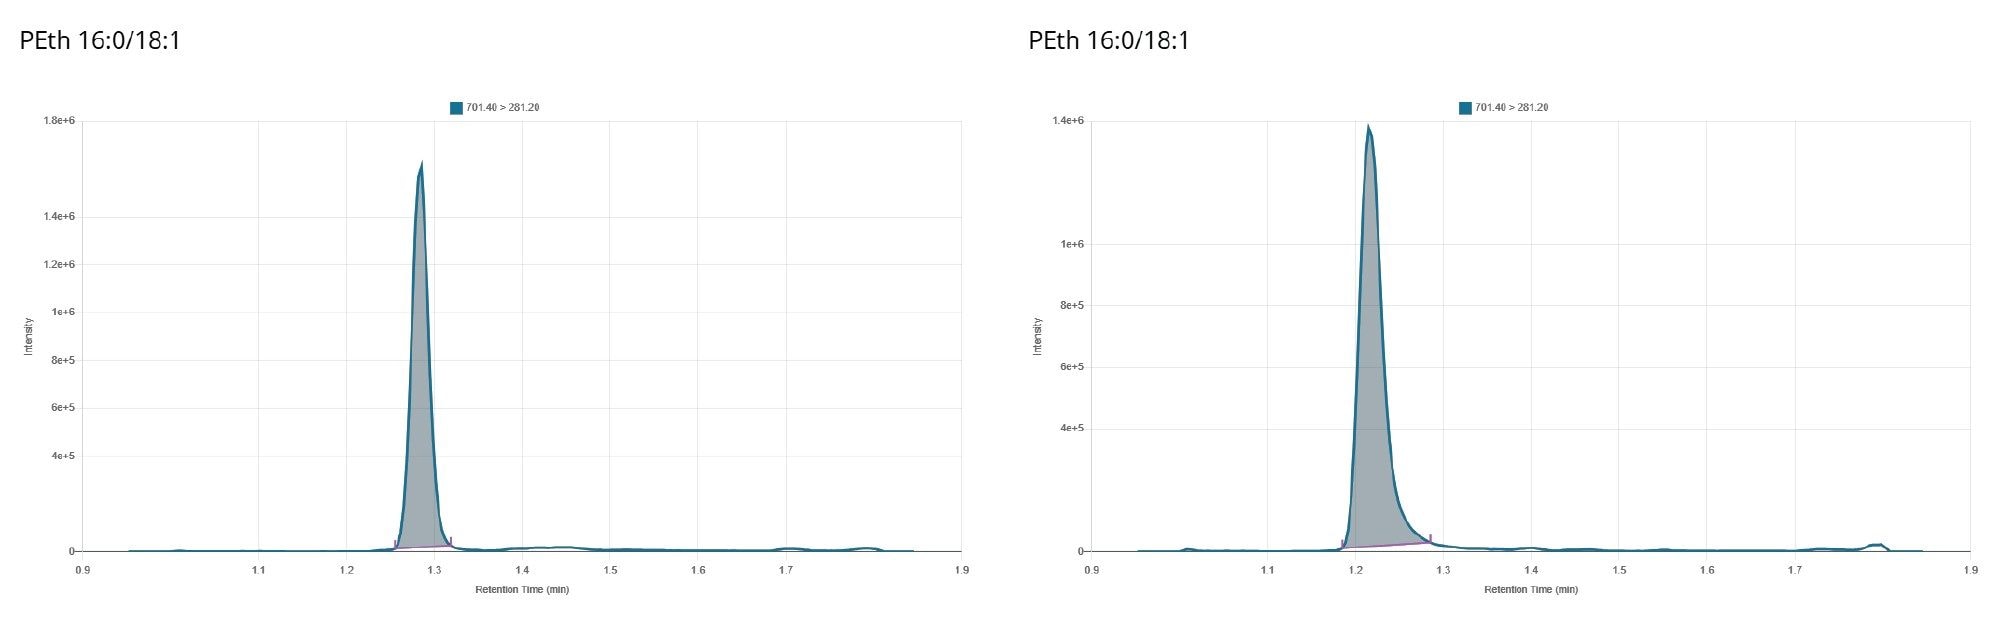
The in-between run retention time varied only between 1.2 and 1.3 minutes. A slight downward trend is observed towards the end of the column lifetime, which is a logical consequence of the excessive usage of the column. All measurements were performed using the same analytical column, which was subjected to more than 22,000 injections during the evaluation period. Figure 5 compares representative chromatograms of the QC High acquired near the beginning (injection 1,220) and the end (injection 22,471) of the column's operational lifetime. Despite the extensive column usage, no appreciable deterioration in chromatographic peak shape was observed, demonstrating excellent column durability and method robustness.
The within run retention time variation was limited to maximum 0.01 minute, in a typical batch of 100 injections, indicating that the in between run variation is related to the excessive column usage and the mobile phase preparation rather than to the method itself. It should be noted that both mobile phases A and B are a pre-made blend of two solvents, water/acetonitrile and methanol/acetonitrile, respectively. The slightest variation in preparing these pre-made blends can impact the retention time.
The mean peak area of the QC High was 36,970 counts, with most measurements ranging between 29,000 and 42,000 counts. A limited number of outliers were observed, with peak areas as low as 20,000 counts or as high as 80,000 counts. Variations in peak response are attributed primarily to routine factors such as differences in mobile phase preparation and the cleanliness of the ion source.
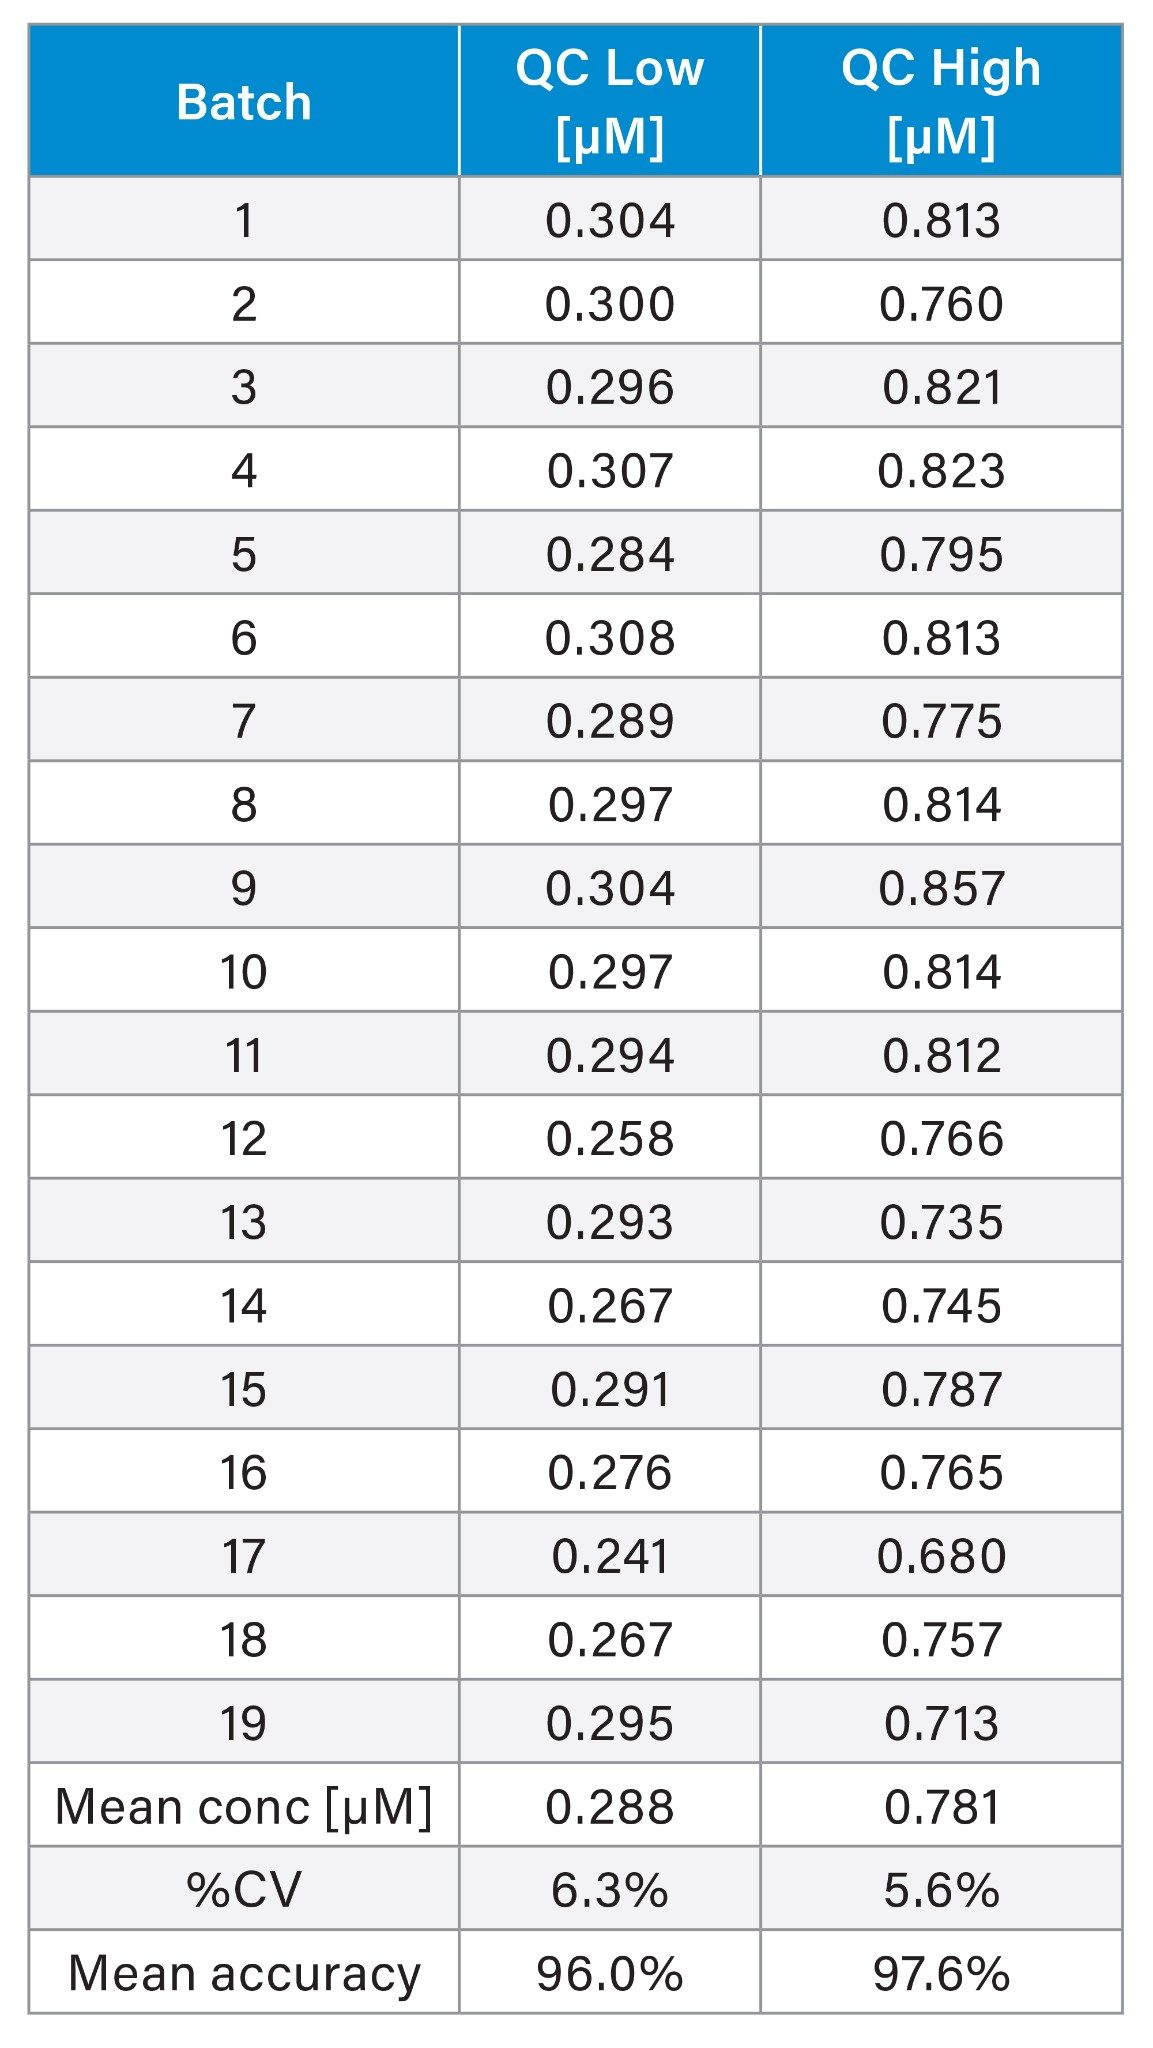
The mean calculated concentration of the QC High sample was 0.78 µM (n = 19), with a %CV of 5.6%. No systematic trend in calculated concentration was observed over the seven-month study period. The measured concentration was in excellent agreement with the assigned target concentration of 0.80 µM, highlighting the long-term accuracy and reproducibility of the method.
In each batch, a low-level QC (0.30 µM) and a high-level QC (0.80 µM) are analyzed at the beginning, middle, and the end of the run to monitor method performance throughout the batch. The measured concentrations remained consistent within individual batches as well as across the entire study period. Table 1 summarizes the accuracy and precision results obtained for both QC levels across the 19 batches included in this evaluation. Precision is excellent with %CV values of 6.3% (QC Low) and 5.6% (QC High). Accuracy is equally excellent with mean accuracy of 96.0% (QC Low) and 97.6% (QC High).
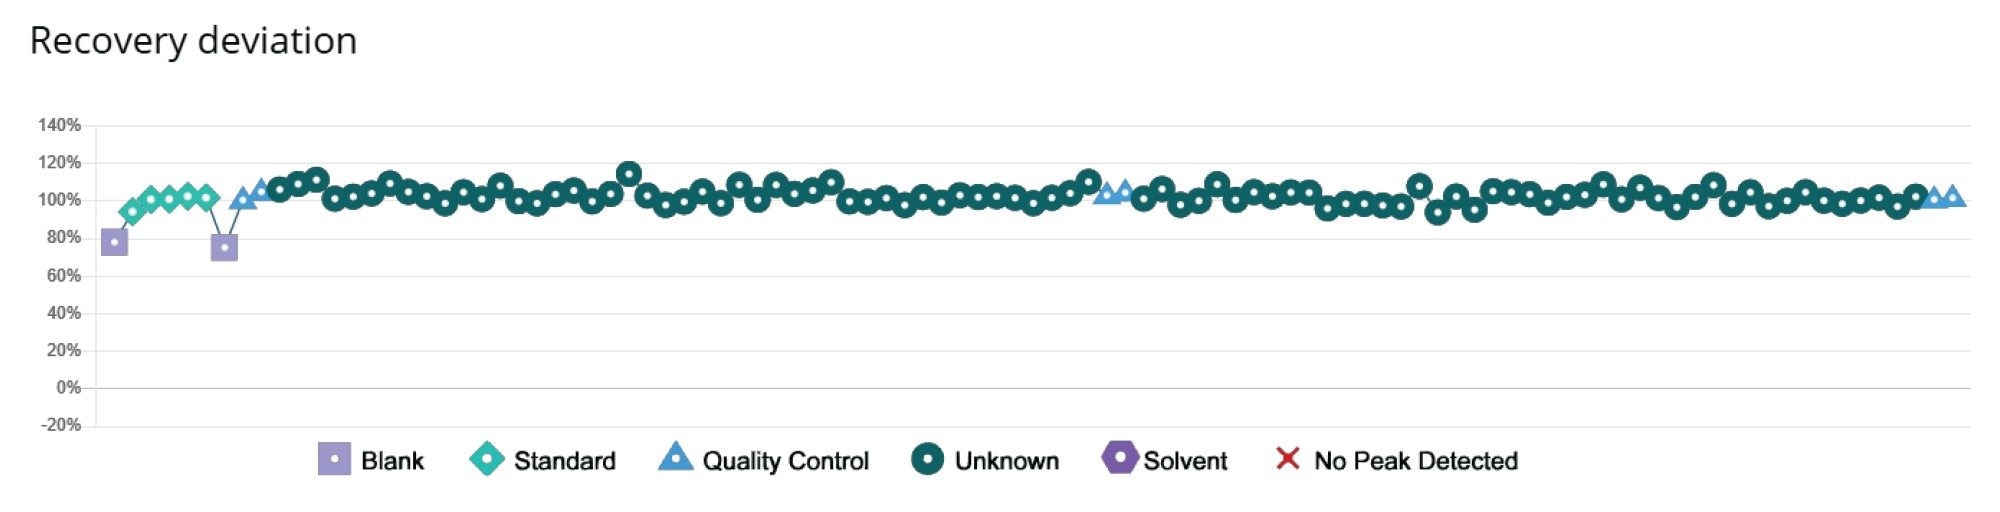
The within-run stability of the internal standard, evaluated based on peak area measurements, is presented in the trend plot shown in Figure 6. The observed %CV was 5.1%. Furthermore, no systematic differences in internal standard peak areas were observed between calibrators, quality control samples, and patient specimens. These findings demonstrate consistent method performance across the different sample types, and no need to reanalyze samples because of unexpectedly high matrix effects.
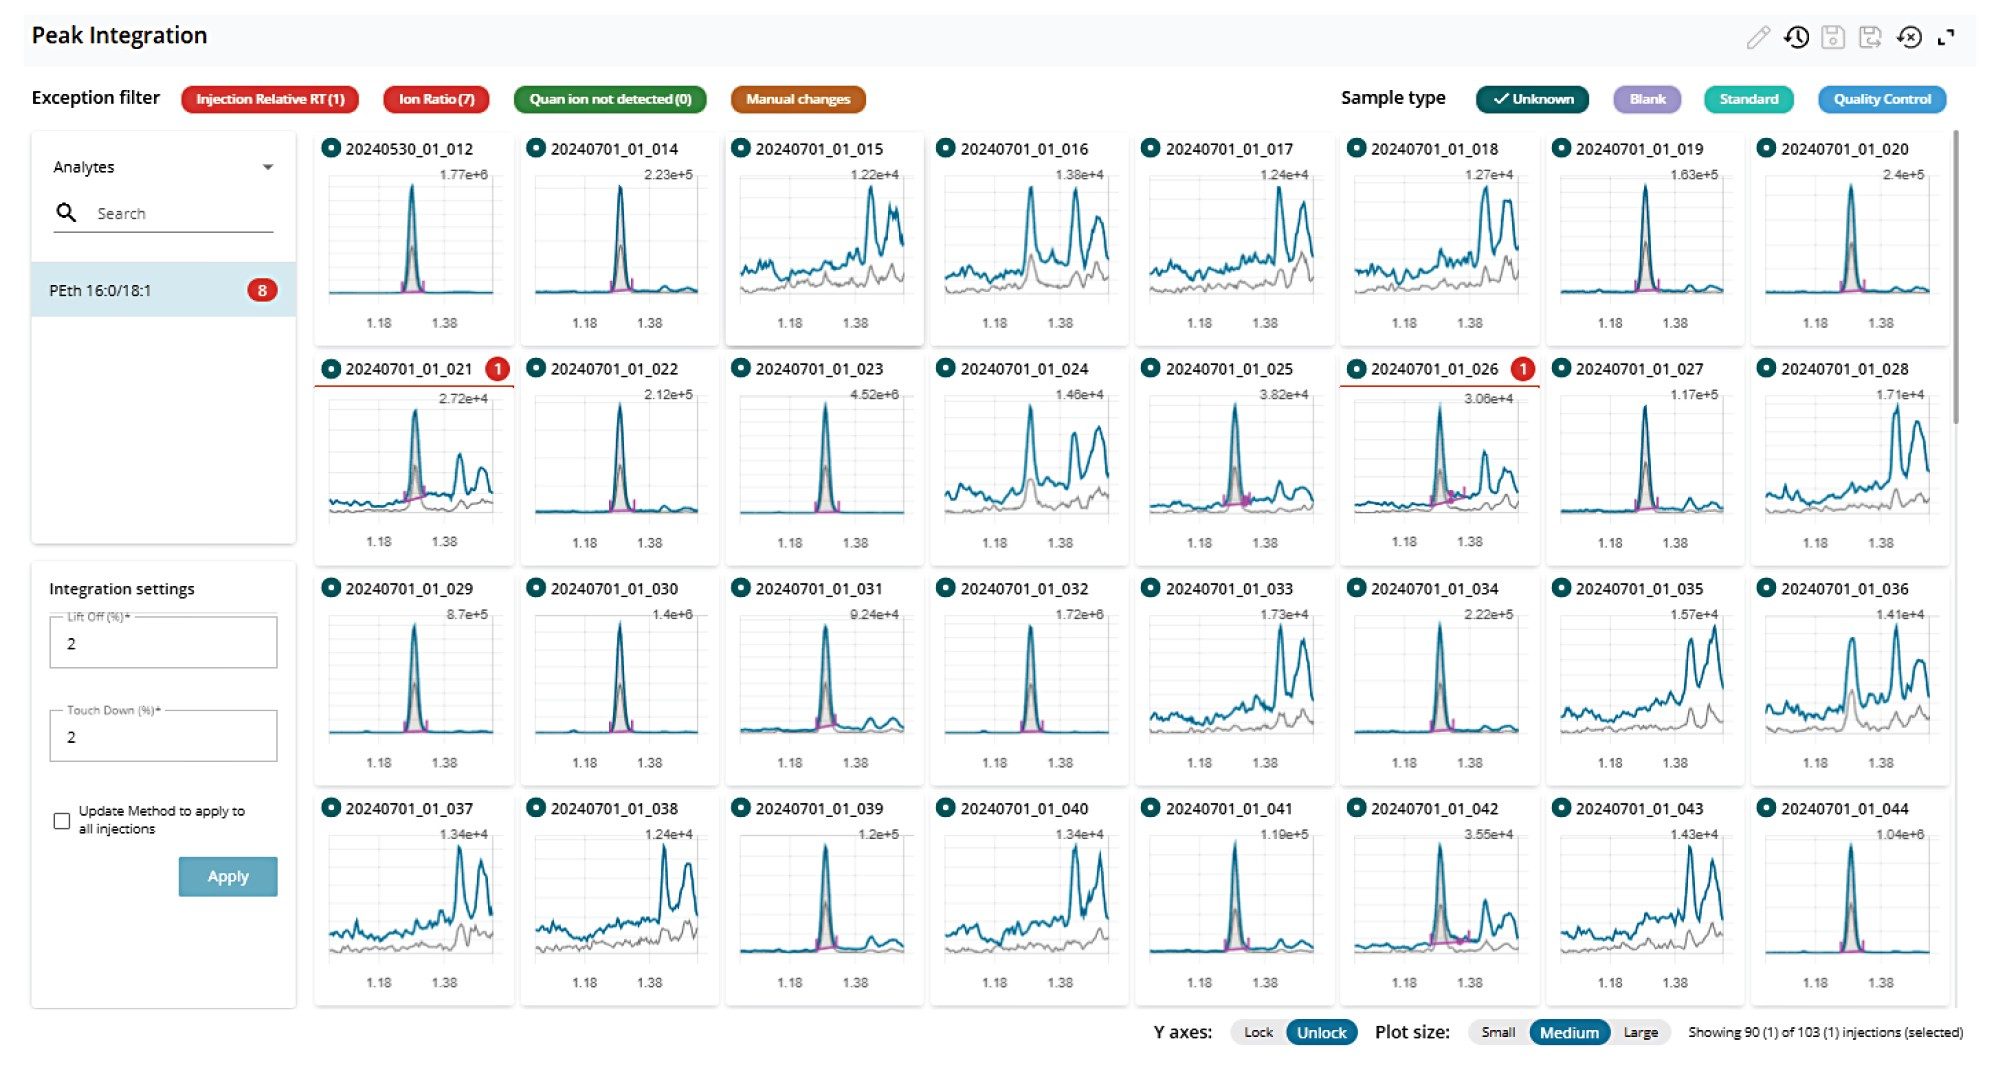
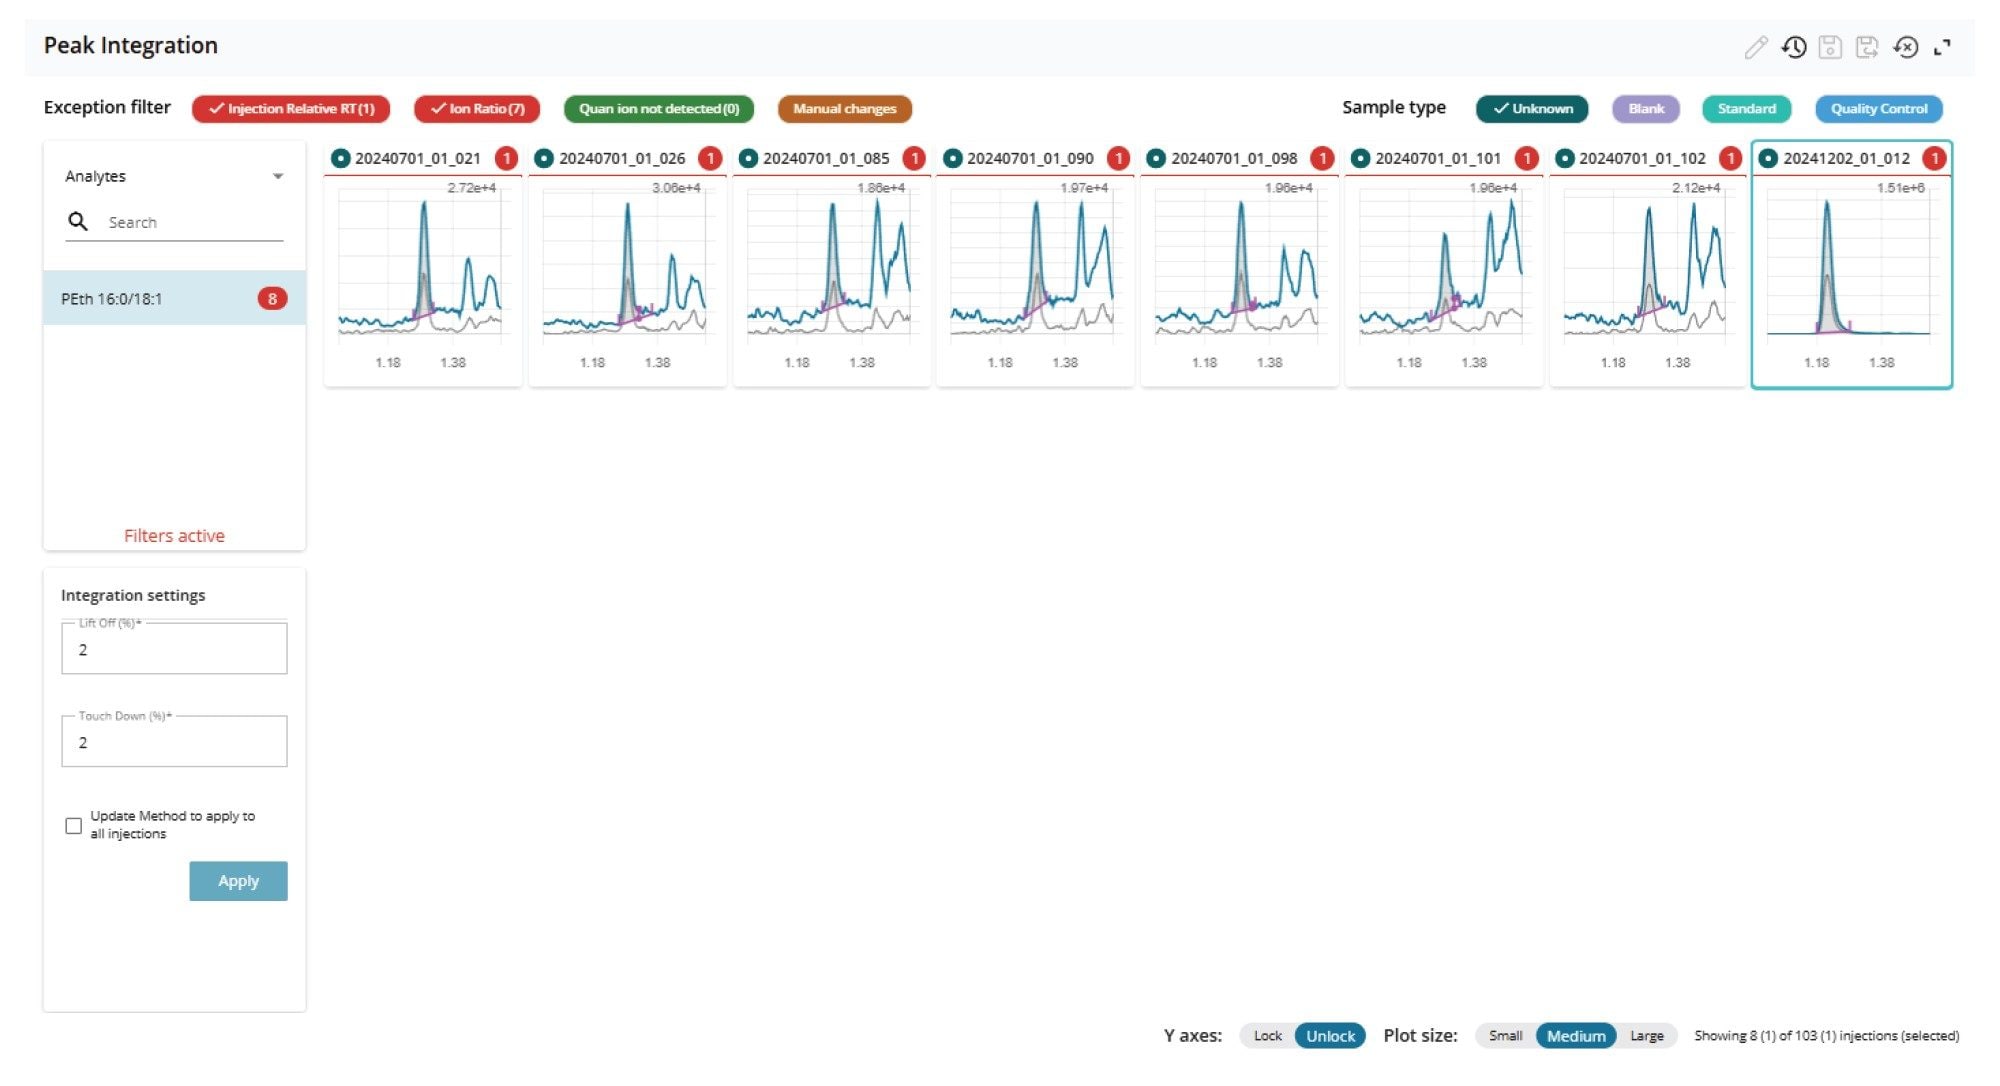
Quantitative data processing was done with the MS Quan Application, Waters newest quantitation application within the waters_connect Software. The MS Quan Application contains modern workflows that rely on automated, rule-based evaluation and exception-focused review. By applying predefined analytical criteria such as calibration performance, ion ratios, retention time, S/N thresholds, and internal standard behavior across the entire dataset, outliers can be identified and attention is directed only to results that require scientific judgment. This ensures that critical findings are not overlooked while significantly reducing the burden of reviewing compliant data. The screenshot in Figure 7 shows the comprehensive peak integration page that allows for quick evaluation of the samples. Data can be filtered so that only the exceptions are visible (Figure 8).
The LC-MS/MS method provides a robust, accurate, and sensitive approach for the quantitative determination of PEth 16:0/18:1 in whole blood. Excellent chromatographic stability was demonstrated over a seven-month evaluation period and more than 22,000 injections on a single analytical column, with minimal retention time variation and no significant deterioration in peak shape. Quantitative performance was equally strong, with calibration curves routinely achieving R2 of 0.999 with low residual errors, stable internal standard response and excellent accuracy and precision of QC samples. No carryover was observed.
The method combines simple sample preparation with excellent analytical sensitivity, enabling reliable quantitation at 0.05 µM while maintaining S/N ratios exceeding 100:1. Importantly, the assay delivers the accuracy and precision required for decision-making around clinically and forensically relevant PEth concentrations, where test results may influence rehabilitation monitoring, driver's license reinstatement, occupational assessments, monitoring relapse, child custody cases and safeguarding, transplant medicine, and the management of alcohol-related hypertension.
Overall, the combination of long-term robustness, excellent quantitative performance, straightforward workflow, and substantial analytical sensitivity makes this method well suited for routine implementation in high-throughput clinical and forensic laboratories.
Beck, O.; et al. Volumetric dried blood spots for determination of phosphatidylethanol: validation of a liquid chromatography tandem mass spectrometry method and clinical application. Drug Test. Anal. 2025, 17, 231–237.
Danaceau, J. P.; Wood, M. Analysis of Phosphatidylethanol (PEth) in Whole Blood Using SPE and UPLC-MS/MS for Forensic Toxicology. Waters Application Note. 720007120. January 2021.
The authors would like to thank Dr. Ingrid Almkvist and her team from Falu Lasarett in Falun, Sweden, for providing us the data on which this application note was based.
720009601, October 2026


