• Application Note

Detection, Identification, and Structural Elucidation of Unknown Contaminants During ToF Screening for Pesticides in River Water Using an Integrated Software Approach

Detection, Identification, and Structural Elucidation of Unknown Contaminants During ToF Screening for Pesticides in River Water Using an Integrated Software Approach

  • Eleanor Riches
  • Keith Worrall
  • Hilary J. Major
  • Waters Corporation

Abstract

This application note describes a method where non-targeted contaminant species can be detected and successfully identified in river water using ToF screening and a structural elucidation workflow.

Benefits

  • ChromaLynx XS, Elemental Composition, and MassFragment are powerful structural elucidation software tools for true non-targeted, unknown compound identification.
  • Reliable, precise, and accurate exact mass ToF data, along with high resolution UPLC, affords added confidence in compound identification.
  • MSE data acquisition allows the simultaneousacquisition of both low energy precursor ion (MS) data and high energy fragment ion (MSE) data in a single injection, for unequivocal compound identification.

Introduction

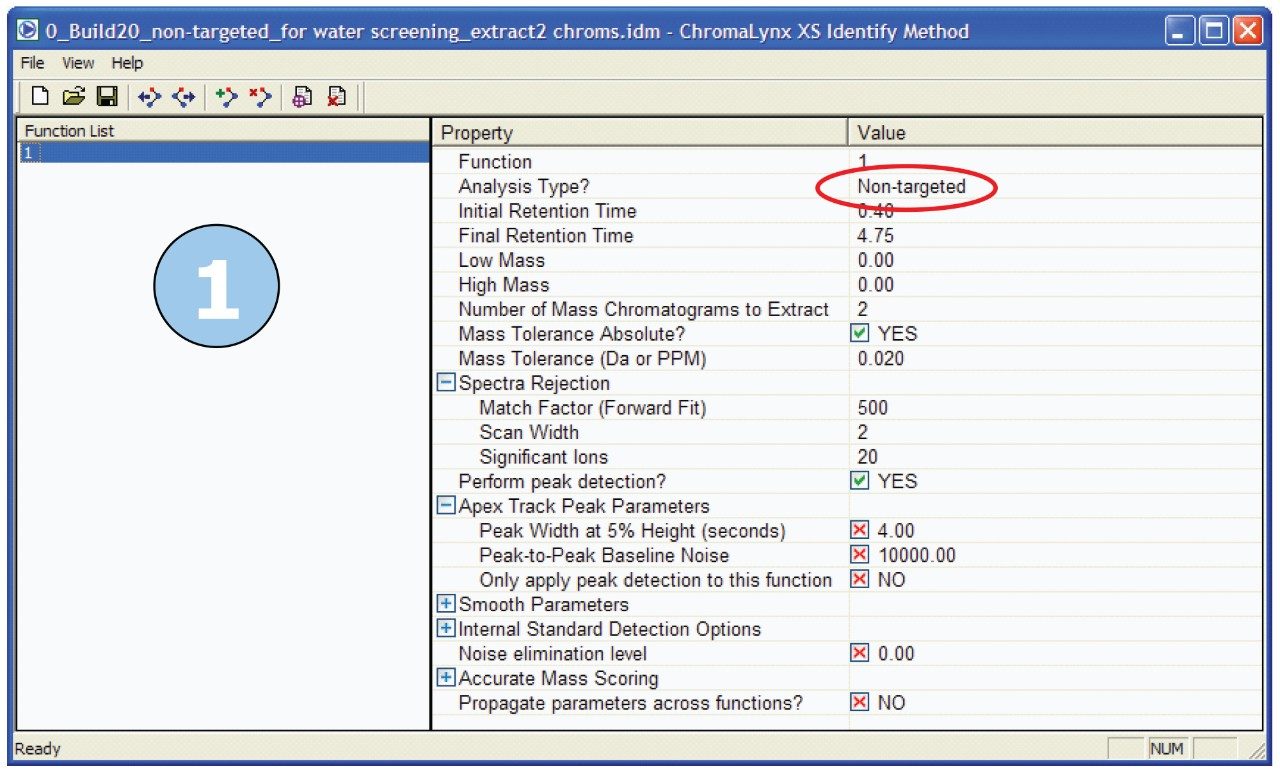
The use of Time-of-Flight (ToF) screening approaches has steadily increased in both food safety and environmental monitoring laboratories. ToF screening can either be used for targeted screening activities – where an extensive database is used to target key compounds of interest after the screening acquisition stage, or it can be used in a non-targeted way – using deconvolution software to identify all peaks present in a sample after non-targeted data acquisition.

When analyzing environmental waters, pesticide contamination screening is one of the most important analyses carried out. However, other contaminant species, such as veterinary drugs or human pharmaceuticals and their metabolites, may also be present at similar ultra-trace levels as pesticides, and could be equally as harmful to the aquatic ecosystem.

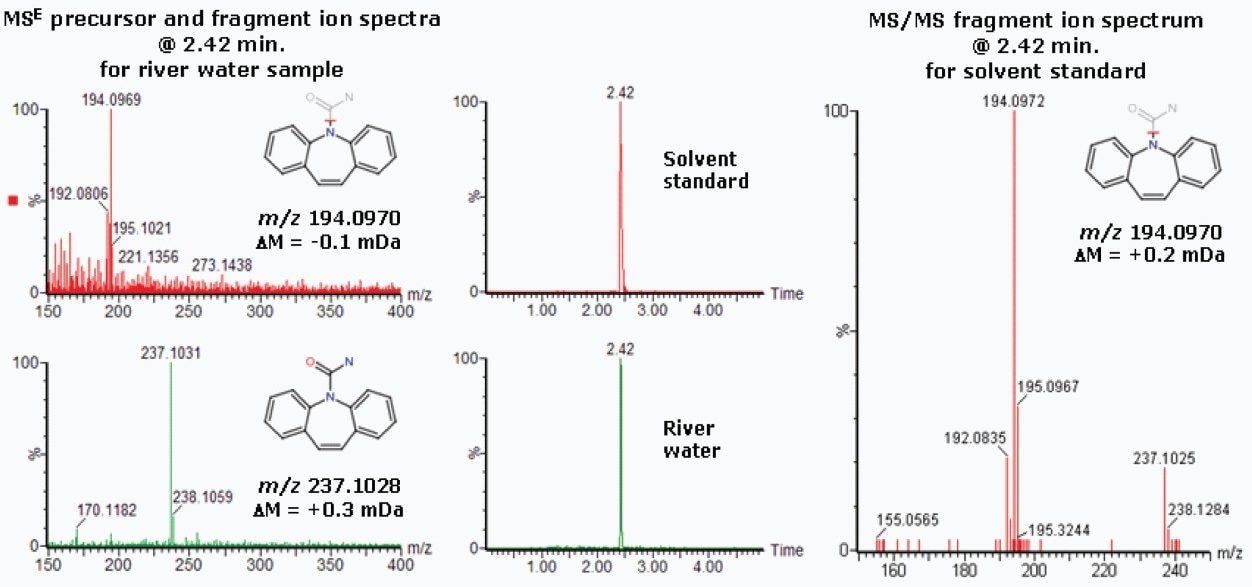
Discovery of a non-targeted, unexpected compound subsequently entails the confirmation and identification of that compound. The ToF instrumentation must be sufficiently sensitive and accurate to ensure that the unknown compound is correctly detected and identified, while at the same time maintaining exact mass accuracy for components at very low concentrations in the presence of high levels of challenging matrices. Accurate and precise exact mass data on both the low energy precursor ion and the MSE high energy fragment ions, together with an integrated, multi-component software approach, provide increased confidence in the identification of the non-targeted species.

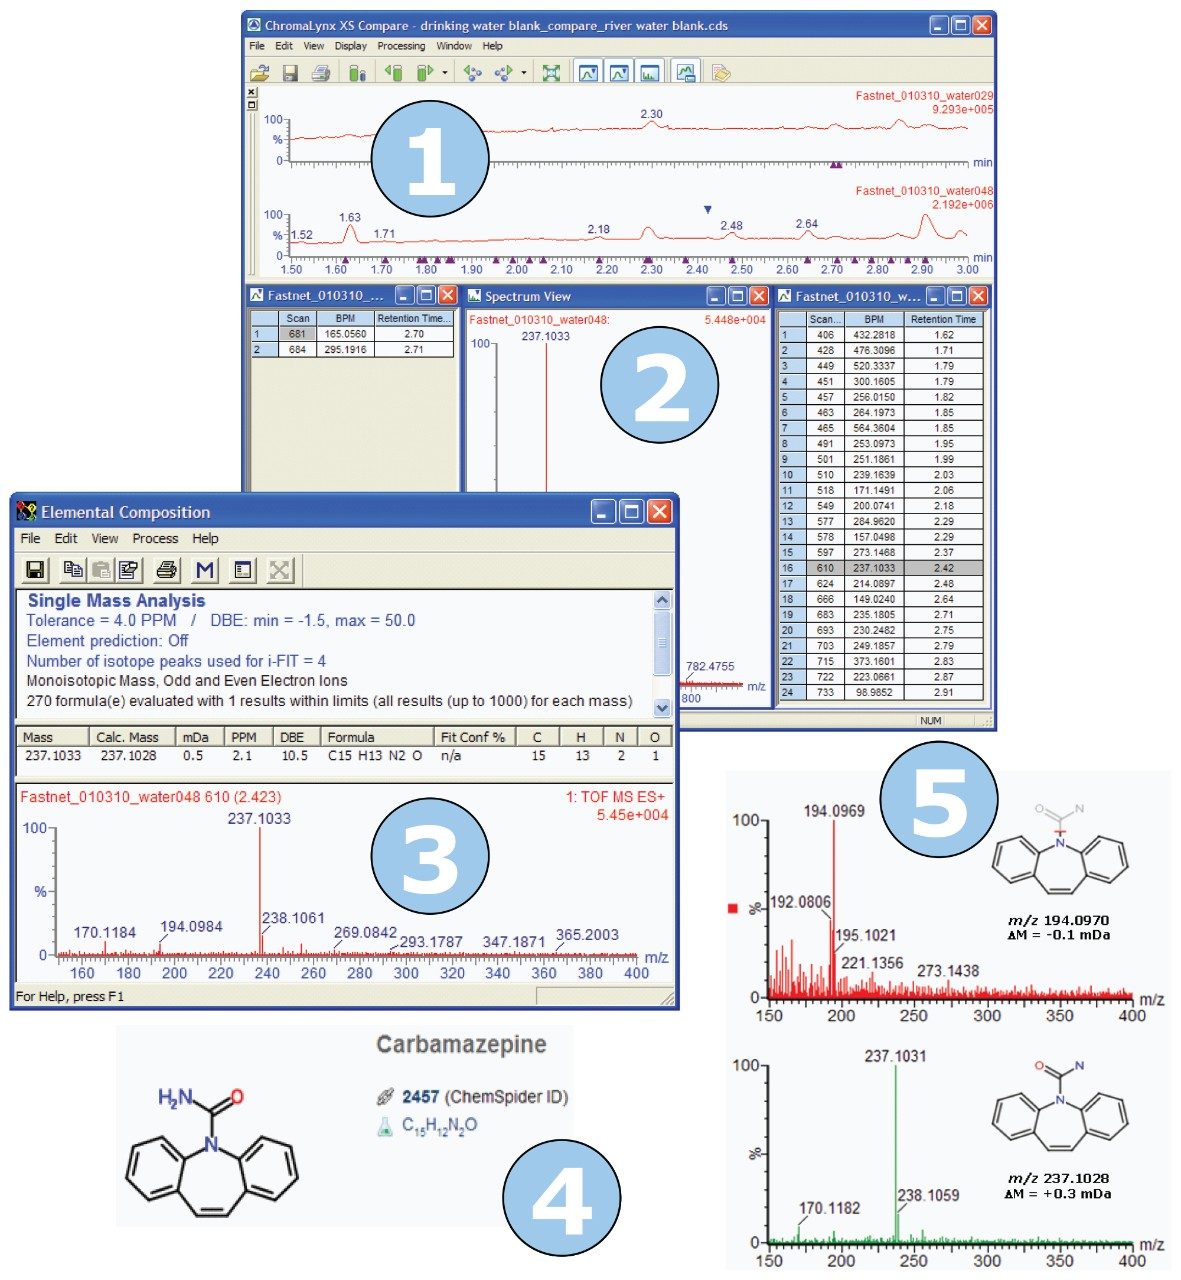
This application note describes the non-targeted screening of water samples using Oasis HLB Cartridges for SPE clean-up and pre-concentration, followed by analysis using Waters ACQUITY UPLC System coupled with Xevo G2 QTof. Data were processed using ChromaLynx XS Software, along with MassFragment and the Elemental Composition tool in MassLynx v. 4.1.
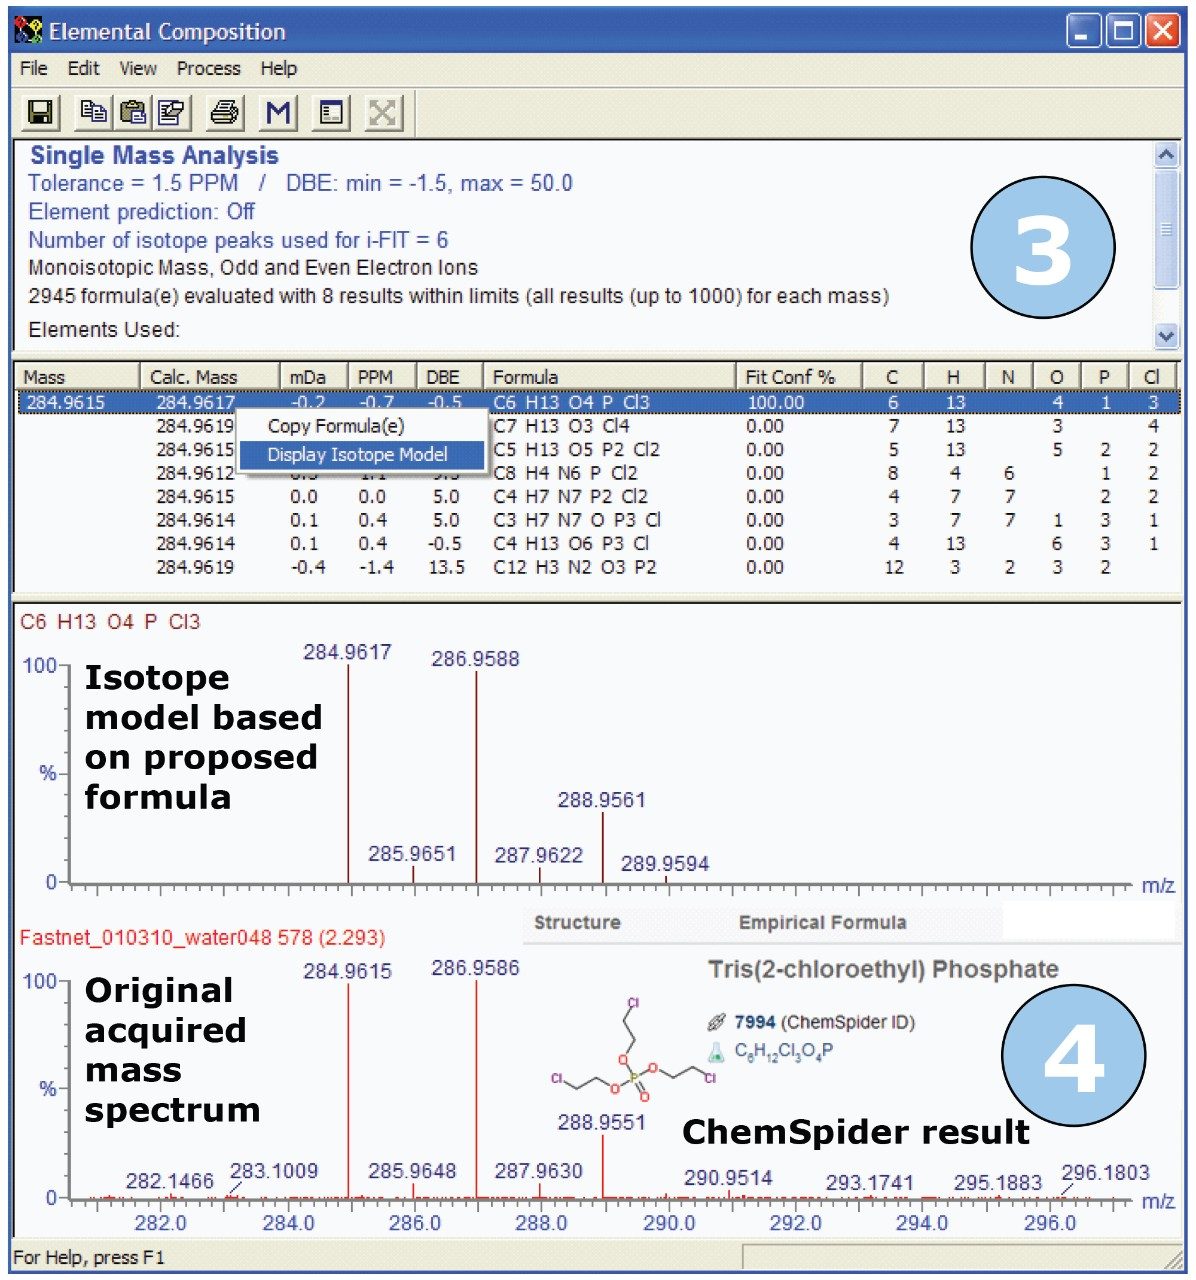
Experimental

SPE sample preparation

A sample of surface water was collected from a UK river. A 200 mL aliquot of this surface water was extracted using Oasis HLB SPE Cartridges. A 200x concentration was achieved. This constituted blank river water matrix.

A similar procedure was carried out with drinking water, collected at the Waters Corporation Manchester site. Na2S2O3 was added to the drinking water sample at 200 mg/L, to ensure dechlorination prior to analysis. This constituted blank drinking water matrix.

Sample preparation conditions

Cartridge:

Oasis HLB 30 μm 60 mg/3 cc

Condition:

2 x 1 mL methanol

Equilibrate:

2 x 1 mL water

Load:

200 mL river water or drinking water sample (<10 mL/min)

Wash:

2 x 1 mL 5% methanol in water

Elute:

2 x 1 mL methanol

Evaporate:

Under nitrogen – reduce 2 mL to 1 mL volumetrically

LC conditions

LC system:

ACQUITY UPLC

Runtime:

5 min

Column:

ACQUITY BEH C18, 1.7 mm, 2.1 x 50 mm

Column temp.:

45 °C

Mobile phase A:

10 mL of 1 M aqueous ammonium acetate solution and 990 mL water

Mobile phase B:

10 mL of 1 M aqueous ammonium acetate solution and 990 mL methanol

Flow rate:

0.6 mL/min

Injection volume:

3.0 μL

UPLC gradient is detailed in Table 1.

Gradient

Table 1. ACQUITY UPLC gradient for five-minute screening run.

MS conditions

MS system:

Xevo G2 QTof

Ionization mode:

ESI positive

Analyzer:

Resolution mode

Scan time:

0.1 s

Capillary voltage:

1.0 kV

Sampling cone:

30

Source temp.:

120 °C

Desolvation temp.:

550 °C

Desolvation gas:

1000 L/hr

Cone gas:

50 L/hr

Mass range:

m/z 50 to 1000

MSE conditions

Low energy:

6

High energy ramp:

25.0 to 35.0

LockSpray conditions

Compound:

Leucine enkephalin

Masses:

m/z 556.2771 and m/z 278.1141

Flow rate:

20 μL/min

Capillary voltage:

3.0 kV

Collision energy:

21

Results and Discussion

The generic screening method described above was used to carry out non-targeted data acquisition, and screen samples of UK river water and drinking water. Following acquisition, the river water blank and the drinking water blank were processed according to the workflow shown in Figure 1, for detection and structural elucidation of non-targeted unknown compounds. 

Figure 1. Workflow for the detection and structural elucidation of non-targeted unknown compounds.

1.

First, the samples were processed using ChromaLynx XS Software in non-targeted mode. The software deconvolutes all peaks in the sample above a certain noise threshold, without targeting specific masses or formulae. The ChromaLynx XS method used for these analyses is shown in Figure 2.

Figure 2. The ChromaLynx XS method for non-targeted peak deconvolution.

Key areas of the chromatograms were identified where peaks were found in river water but not found in drinking water. An example of one such area is shown in Figure 3. In the timeframe between one and a half minutes and three minutes, the ChromaLynx XS Software deconvoluted only seven peaks in the drinking water, but 29 peaks in the river water. 

Figure 3. In the time-frame between one and a half minutes and three minutes, ChromaLynx XS deconvoluted only seven peaks in the drinking water (left-hand results browser), but 29 peaks in the river water (right-hand results browser).

2.

We are then able to use the “Compare” functionality within ChromaLynx XS to carry out an automated comparison between the deconvoluted drinking water peaks and the deconvoluted river water peaks. Compare allows the analyst to view either all the common peaks shared within the two samples, or the unique peaks for the two samples under investigation. Figure 4 shows the Compare browser window, illustrating unique peaks, for blank drinking water compared with blank river water.

In Figure 4, we can see that, of the seven peaks found in drinking water, two peaks are unique since there are only two entries in the left-hand list for drinking water. Similarly, 24 unique peaks are seen in the right-hand list for river water. The spectrum associated with each deconvoluted peak can be reviewed in the Spectrum View window, shown in the center of Figure 4.

Figure 4. An example of the Compare browser window for the comparison between blank drinking water and blank river water.

3.

The identities of unique peaks of interest may be established by using a range of structural elucidation tools. Initially, the most intense ion in the mass spectrum for the peak of interest is selected. This ion is then processed using the Elemental Composition tool within MassLynx 4.1. Figure 5 shows the Elemental Composition result for the ion m/z 300 shown in Figure 4. The software provides suggested formulae for the ion under investigation, based on the measured exact mass and isotope ratios, and gives an indication of the associated mass error.

Figure 5. Elemental Composition proposed formula for the [M+H]+ ion at m/z 300. 

4.

The molecular formula, based on the formula generated by the Elemental Composition tool, can then be searched in a comprehensive molecule database such as the ChemSpider on-line database. Figure 6 shows a section of the results generated for the formula obtained from the m/z 300 ion ([M+H]+). We can see that the top hit on ChemSpider is codeine – a widely used analgesic.

Figure 6. The top hit for the formula suggested by the Elemental Composition tool is the analgesic compound codeine.

5.

After a possible molecular structure has been discovered, MSE high energy fragment ion data – acquired simultaneously with the low energy precursor ion data – is utilized for further confirmation of unknown contaminant identification. The time-aligned MSE fragment ion data is processed using MassFragment Software. MassFragment allows analysts to use the proposed molecular structure to automatically assign fragment ion structures to the acquired spectra. 

Figure 7 shows the MSE fragment ion spectrum for the precursor ion m/z 300, and includes fragment ion structures proposed by MassFragment Software.

Figure 7. MSE high energy fragment ion spectrum for the codeine ion m/z 300, with proposed fragment ion structures taken from the MassFragment report.

Of the unique peaks found in river water, the one with m/z 284, showed an interesting isotope pattern. The isotope ratios suggest the presence of a number of halogen atoms in the molecule. Figure 8 shows the Compare browser window with the mass spectrum of interest highlighted.

Figure 8. Compare browser with the mass spectrum for a unique chromatographic peak found in river water, which shows an unusual isotope ratio.

Following a similar approach to that used to identify codeine, we selected the ion with m/z 284 and processed it using the Elemental Composition tool. Figure 9 shows the Elemental Composition results for the ion of interest. Within the Elemental Composition tool, it is also possible to generate predicted isotope models based on proposed formulae. Figure 9 illustrates the isotope model for the formula generated for this ion, which was very easily produced by clicking on the proposed formula with the highest i-FIT Confidence. We can see that the isotope ratio in the acquired spectrum very closely matches that of the theoretical isotope model. The acquired exact masses and the calculated exact masses also match closely, which provides added confidence in the predicted formula.

Figure 9. Elemental Composition results for the ion at m/z 284, along with the predicted isotope model for the best i-FIT formula and ChemSpider search result.

The predicted formula was once again searched in ChemSpider database, and the top hit from the ChemSpider search was tris (2-chloroethyl) phosphate. This molecule is widely used as a flame retardant in polyurethane foams, and previous publications have identified this compound as a contaminant in river water.1,2 The time-aligned, high-energy MSE fragment ion spectrum was processed by MassFragment using the proposed structure, and further structural confirmation was provided by fragment ion assignment. The result for MassFragment processing of the fragment ions from the precursor ion of interest is shown in Figure 10.

Figure 10. The low energy MSE precursor ion spectrum (lower: green) and the time-aligned high energy MSE fragment ion spectrum (upper: red) for the ion m/z 284, with proposed structures from MassFragment.

A third unexpected contaminant was identified as the anti-convulsant pharmaceutical compound carbamazepine, using the structural elucidation workflow previously described in Figure 1. Figure 11 illustrates the workflow for the carbamazepine contaminant. 

Figure 11. The structural elucidation work flow was followed for an additional non-targeted contaminant species, which was identified as carbamazepine.

To further confirm the presence of carbamazepine in the river water, a solvent standard was prepared for this compound and analyzed by MS/MS using ACQUITY UPLC coupled with Xevo G2 QTof. The extracted ion chromatograms are shown in Figure 12, alongside the MS/MS spectrum for the carbamazepine solvent standard and the MSE spectra for the river water sample.

In Figure 12, the chromatographic peak for carbamazepine was observed at the same retention time in the river water sample and the solvent standard. We could also clearly see that the same primary fragment ion was evident in the spectrum acquired for the carbamazepine solvent standard as the fragment ion seen in the time-aligned MSE spectra acquired for the river water sample. This provided further evidence for the unequivocal identification of carbamazepine contamination in the river water sample. 

Figure 12. Extracted ion chromatograms shown alongside MSE precursor and fragment ion spectra for river water sample and MS/MS fragment ion spectrum for carbamazepine solvent standard.

In this application note, three of the deconvoluted unknown peaks were identified using a structural elucidation workflow. If required, all deconvoluted peaks could have been processed in the same way, in order to fully characterize the sample.

Conclusion

  • Non-targeted contaminant species were detected and successfully identified in river water using ToF screening and a structural elucidation workflow.
  • The MSE functionality of Xevo G2 QTof enables the acquisition ofboth low energy (precursor ion) and high energy (fragment ion) data in a single rapid screening run.
  • MSE fragment ion data can be used to help with unequivocalidentification of detected compounds.
  • Xevo G2 QTof with ChromaLynx XS – incorporating Compare functionality, Elemental Composition, and MassFragment Software– offers powerful tools for screening, detection, and identificationof true non-targeted species in environmental or food matrices.

References

  1. J Regnery, W Püttmann. Water Res. 44 (14): 4097-4104, 2010.
  2. T Reemtsma, et al. Trends in Analytical Chemistry (TrAC). 27 (9):727-737, 2008.

Acknowledgments

With thanks to Chris Hunter and Alan Wainwright, of the Environment Agency — National Laboratory Services (NLS), UK, for providing water samples.

720003927, April 2011

Back To Top Back To Top