
Alliance iS HPLC System with PDA Detector-Driven Characterization of Cranberry Juice Flavonoids Using a USP Monograph: Linking Detector Slit Width to USP Signal to Noise
Amanda B. Dlugasch, Paula Hong
Waters Corporation, United States
Published on July 15, 2026

Abstract
Flavonoids in cranberry juice are commonly analyzed by reverse‑phase HPLC with PDA detection. This work uses the USP Cranberry Fruit Juice monograph1 to evaluate how slit‑width selection on the Alliance™ iS HPLC System with PDA Detector affects baseline stability, USP noise, and signal‑to‑noise (S/N) at 365 nm and 520 nm in which four slit widths (35, 50, 100, and 150 µm) were assessed. Narrower slits improved spectral resolution but increased noise due to reduced light throughput, while wider slits decreased noise and enhanced S/N, producing smoother baselines for low‑level quantitation. These results highlight the practical compromises between sensitivity and spectral resolution when optimizing PDA detection for flavonoid analysis.
Benefits
- The Alliance iS HPLC System with PDA Detector features a variable slit width which can be optimized where wider slits reduce USP noise and enhance S/N; narrower slits improve spectral resolution—enabling application‑specific optimization
- The USP Cranberry Fruit Juice Flavonoids application can be successfully analyzed on the Alliance iS HPLC System with PDA Detector with settings (slit width) that allow improved sensitivity
- PDA detection with dual wavelength acquisition is optimum for flavonoid or natural product methods requiring simultaneous data collection at higher wavelength, such as flavonoid profiling in cranberry juice
Introduction
Flavonoids, a diverse class of naturally occurring polyphenolic compounds found in cranberry juice and other plant‑derived products, are ideally suited for UV/Vis and PDA detection due to their conjugated polyphenolic structures, which produce strong, characteristic absorbance in both the ultraviolet and visible regions.1-3 Thus, their identification and characterization are routinely performed using reversed‑phase HPLC coupled with UV/Visible absorbance or photodiode array (PDA) detection. For the USP Cranberry Fruit Juice monograph, the flavonoids are measured at 365 nm because flavanols and related phenolic compounds exhibit strong UV absorbance from their conjugated aromatic systems, while 520 nm is required because anthocyanins- the pigments responsible for cranberry’s red color- absorb strongly in the visible region at this wavelength.
In this study we will demonstrate the applicability of the Alliance iS HPLC System with PDA Detector for the analysis plant based flavanols and related phenolic compounds. Specifically, the Alliance iS HPLC System with PDA Detector with a wavelength range from 190-800 nm, integrates Waters Taper‑Slit flow‑cell design and a variable slit‑width capability, enabling analysts to fine‑tune both light throughput and spectral resolution to meet these application‑specific requirements. In this work, the USP Cranberry Fruit Juice monograph is used as a framework to demonstrate how slit‑width selection affects chromatographic performance, particularly baseline stability, USP noise, and USP S/N at the method‑specified wavelengths of 365 nm and 520 nm. The Alliance iS HPLC System with PDA Detector provides four user‑selectable slit widths—35, 50, 100, and 150 µm—allowing systematic evaluation of these performance attributes. Narrower slit widths increase spectral resolution but reduce light throughput, resulting in higher baseline noise. Conversely, wider slit widths increase light throughput, reduce noise, and improve S/N, with some trade‑off in spectral resolution. The impact of slit width settings on the analysis of flavonoids will be analyzed focusing on sensitivity for low-level quantitation.
Experimental
The method was based on the USP method of Cranberry Fruit Juice: Section C: HPLC Profile of Flavonoids1, with no adjustments to chromatographic conditions.
The procedure followed USP Cranberry Fruit Juice, Section C: HPLC Profile of Flavonoids with no adjustments to chromatographic conditions. A lower‑concentration standard was prepared to illustrate slit‑width effects on USP noise and USP signal to noise
Sample Description
The USP method requires a standard solution at 2 mg/mL and a sample solution of cranberry juice. The standard solution, USP Cranberry Fruit Dry Extract RS (catalog number 1150218), was prepared at a concentration of 2 mg/mL in Solvent, 50:50 methanol: 0.3% phosphoric acid. From the 2 mg/mL standard, a lower concentration standard was prepared at 0.2 mg/mL of USP Cranberry Fruit Dry Extract. This lower concentration standard is not part of the USP method and was used to show the effects of the different slit widths within the PDA detection.
System Configuration
|
System: |
Alliance iS HPLC System |
|
|
Detection: |
PDA Detector |
|
|
Flow cell: |
Analytical |
LC Conditions
|
Column: |
Waters XBridge™ C18 Column 3.5 µm, 4.6 x 150 mm (Waters, p/n: 186003034) |
|
Column temperature: |
25 °C |
|
Sample temperature: |
10 °C |
|
Injection volume: |
5 µL |
|
UV wavelength: |
365 nm and 520 nm |
|
Data rate: |
2 Hz |
|
Flow rate: |
1.0 mL/min |
|
Run time: |
36 minutes |
|
Mobile phase A: |
0.3% Phosphoric Acid in Water |
|
Mobile phase B: |
Acetonitrile |
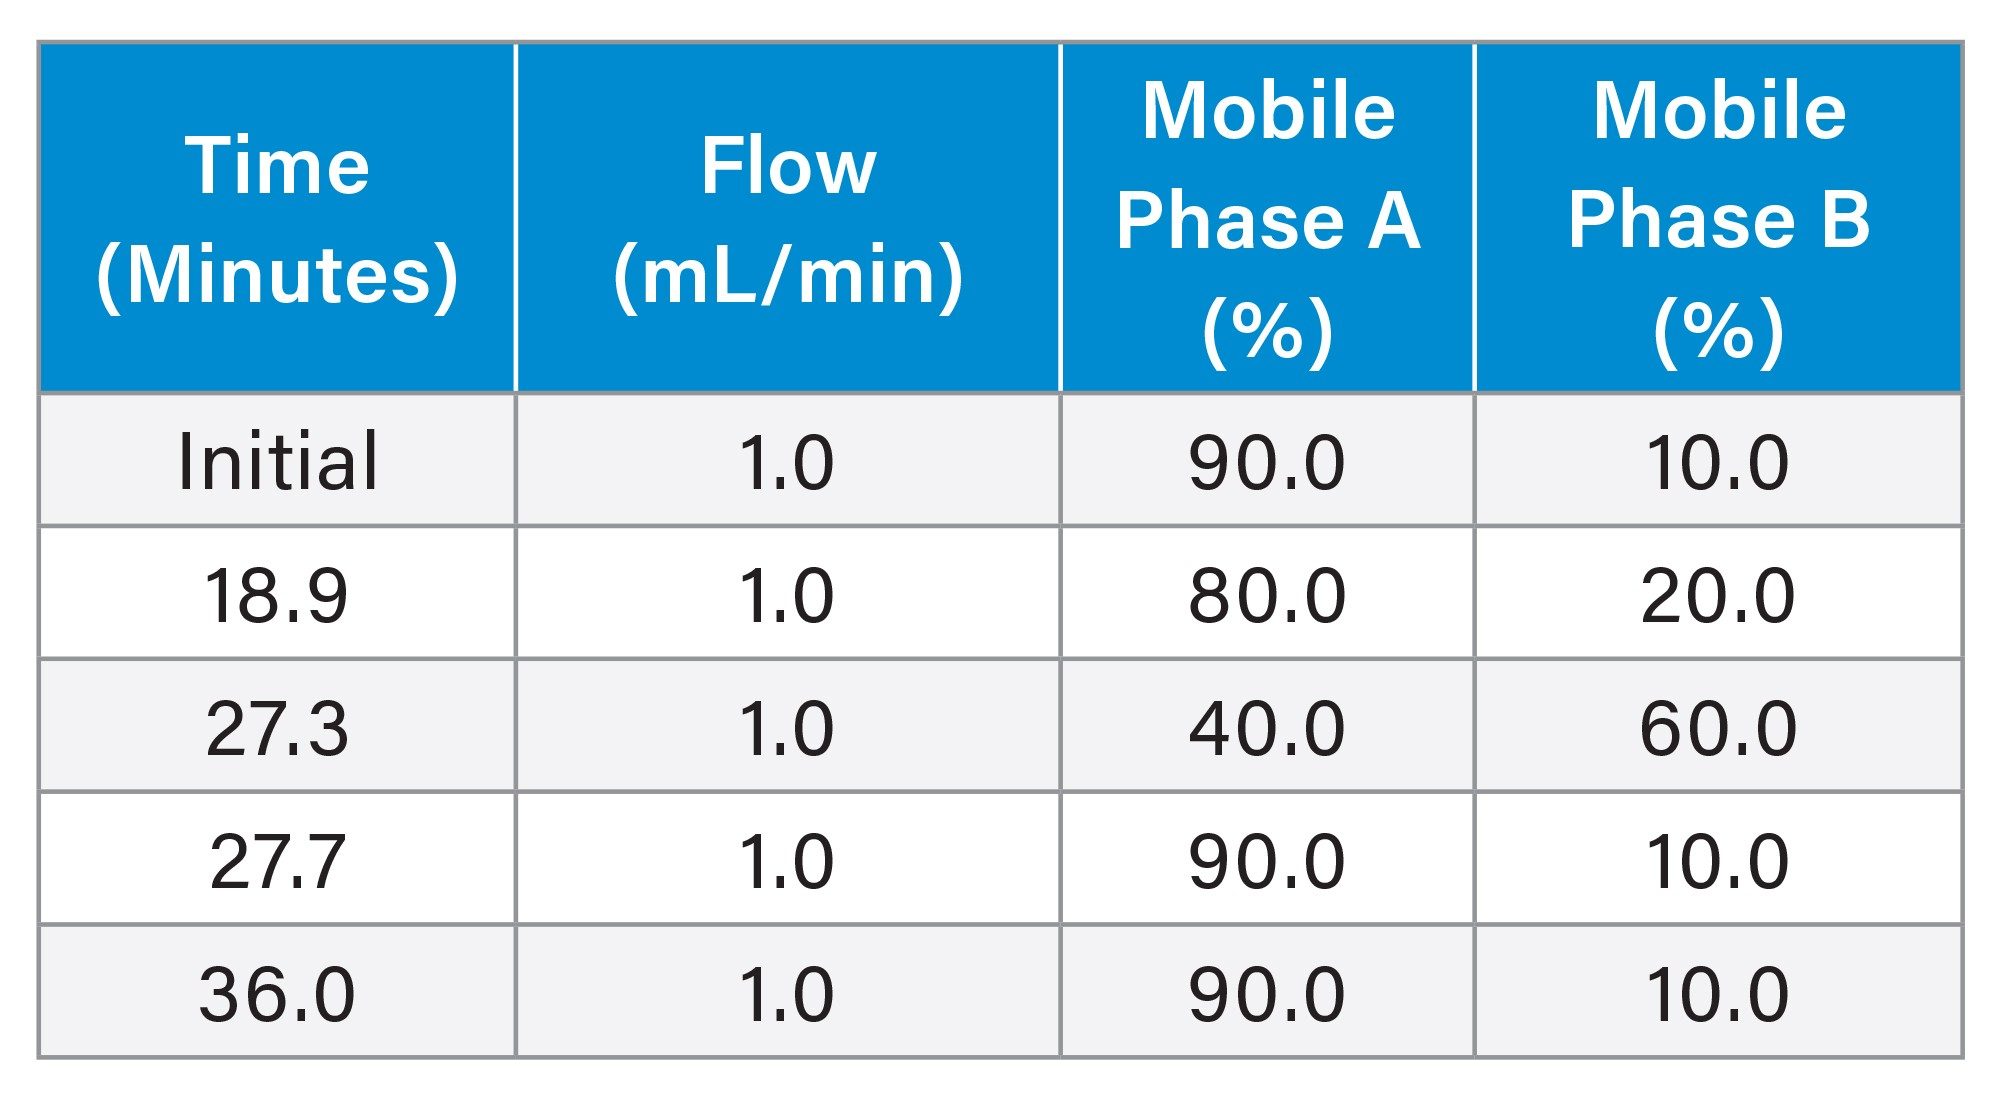
Gradient Table
Data Management
|
Chromatography software: |
Empower™ 3 Chromatography Data Software |
Results and Discussion
USP Method Chromatographic Profile of Cranberry Juice
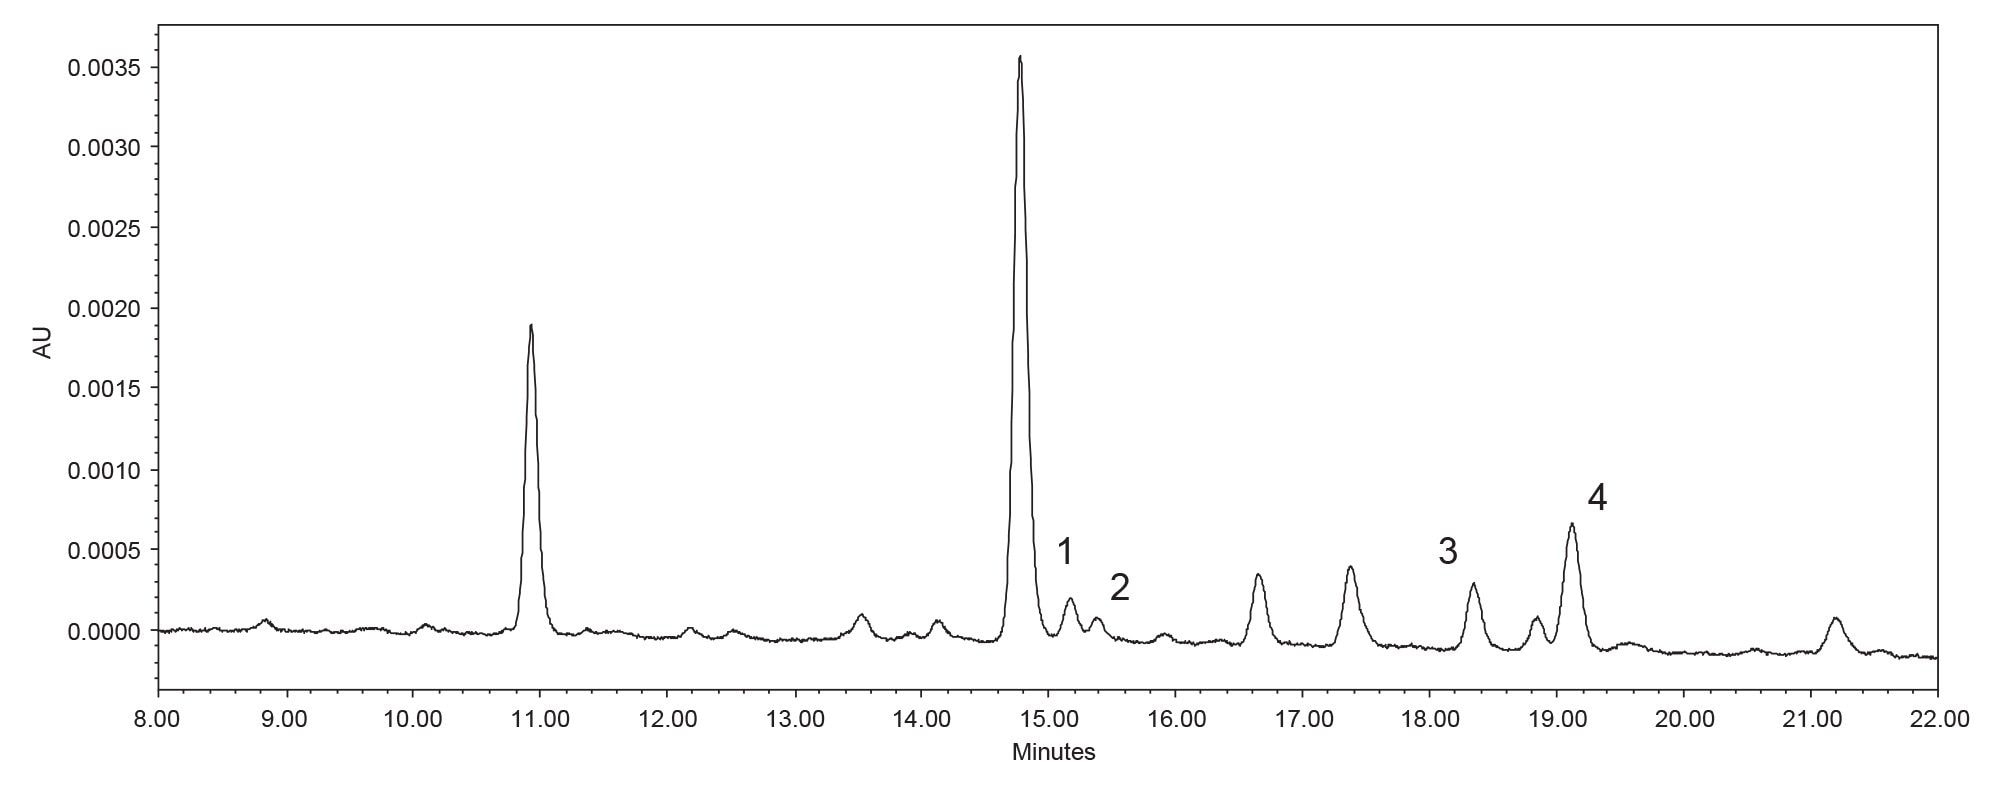
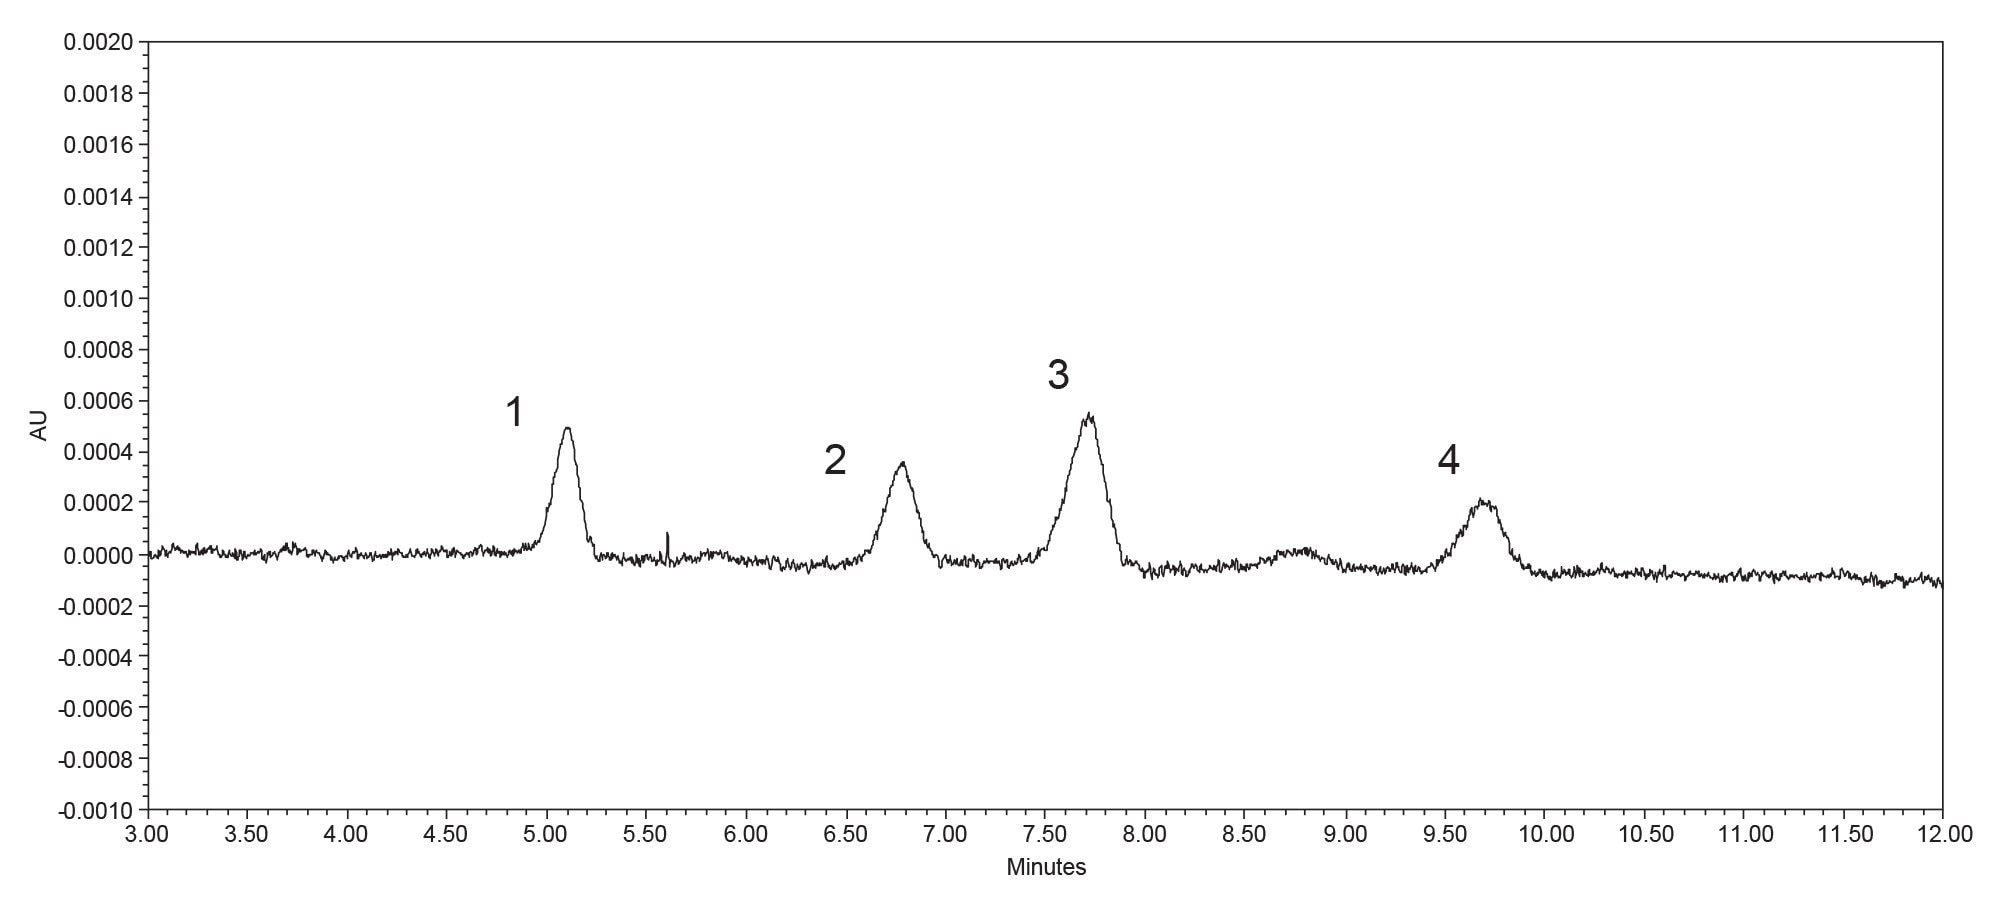
Per the USP method, the flavonoid profile is evaluated at 365 nm and 520 nm. At 365 nm, the chromatogram contains numerous flavonoids peaks. To assess slit width impact, four peaks were selected for monitoring based on lower absorbance range (<0.10 AU) (Figure a). At 520 nm, the chromatogram displayed four predominant anthocyanin peaks, all of which were near limit of quantitation (LOQ) levels (Figure 2).
How Slit Width Affects Baseline Stability and USP Noise
As described previously, the Alliance iS HPLC System with PDA Detector features a variable slit width that is configurable within the instrument method. Slit width directly controls both the amount of light delivered to the photodiode array and the resulting spectral resolution. The Alliance iS HPLC System with PDA Detector offers four user-selectable slit widths- 35, 50 (default), 100 , 150 µm (1.0, 1.5, 2.9, and 4.4 nm respectfully). Narrower slit widths provide higher spectral resolution but reduce light throughput, leading to increased noise, whereas wider slit widths enhance light throughput, lowering noise and improving sensitivity at the expense of some spectral resolution. The extent to which slit width influences chromatographic performance is dependent on application requirements.
To evaluate the impact of slit width, USP noise was selected as the primary performance metric. This system suitability criterion is defined as peak‑to‑peak baseline variability in a defined region of a blank injection, making it a sensitive indicator of detector performance and method suitability. Because slit width governs the amount of light at the photodiodes in the detector, it also governs baseline behavior therefore affecting the noise values:
- Narrower slit → less light → higher noise → baseline appears rougher, amplifying any instability from air bubbles, contamination, or lamp drift.
- Wider slit → more light → lower noise → baseline appears smoother and more stable, reducing peak‑to‑peak variability.
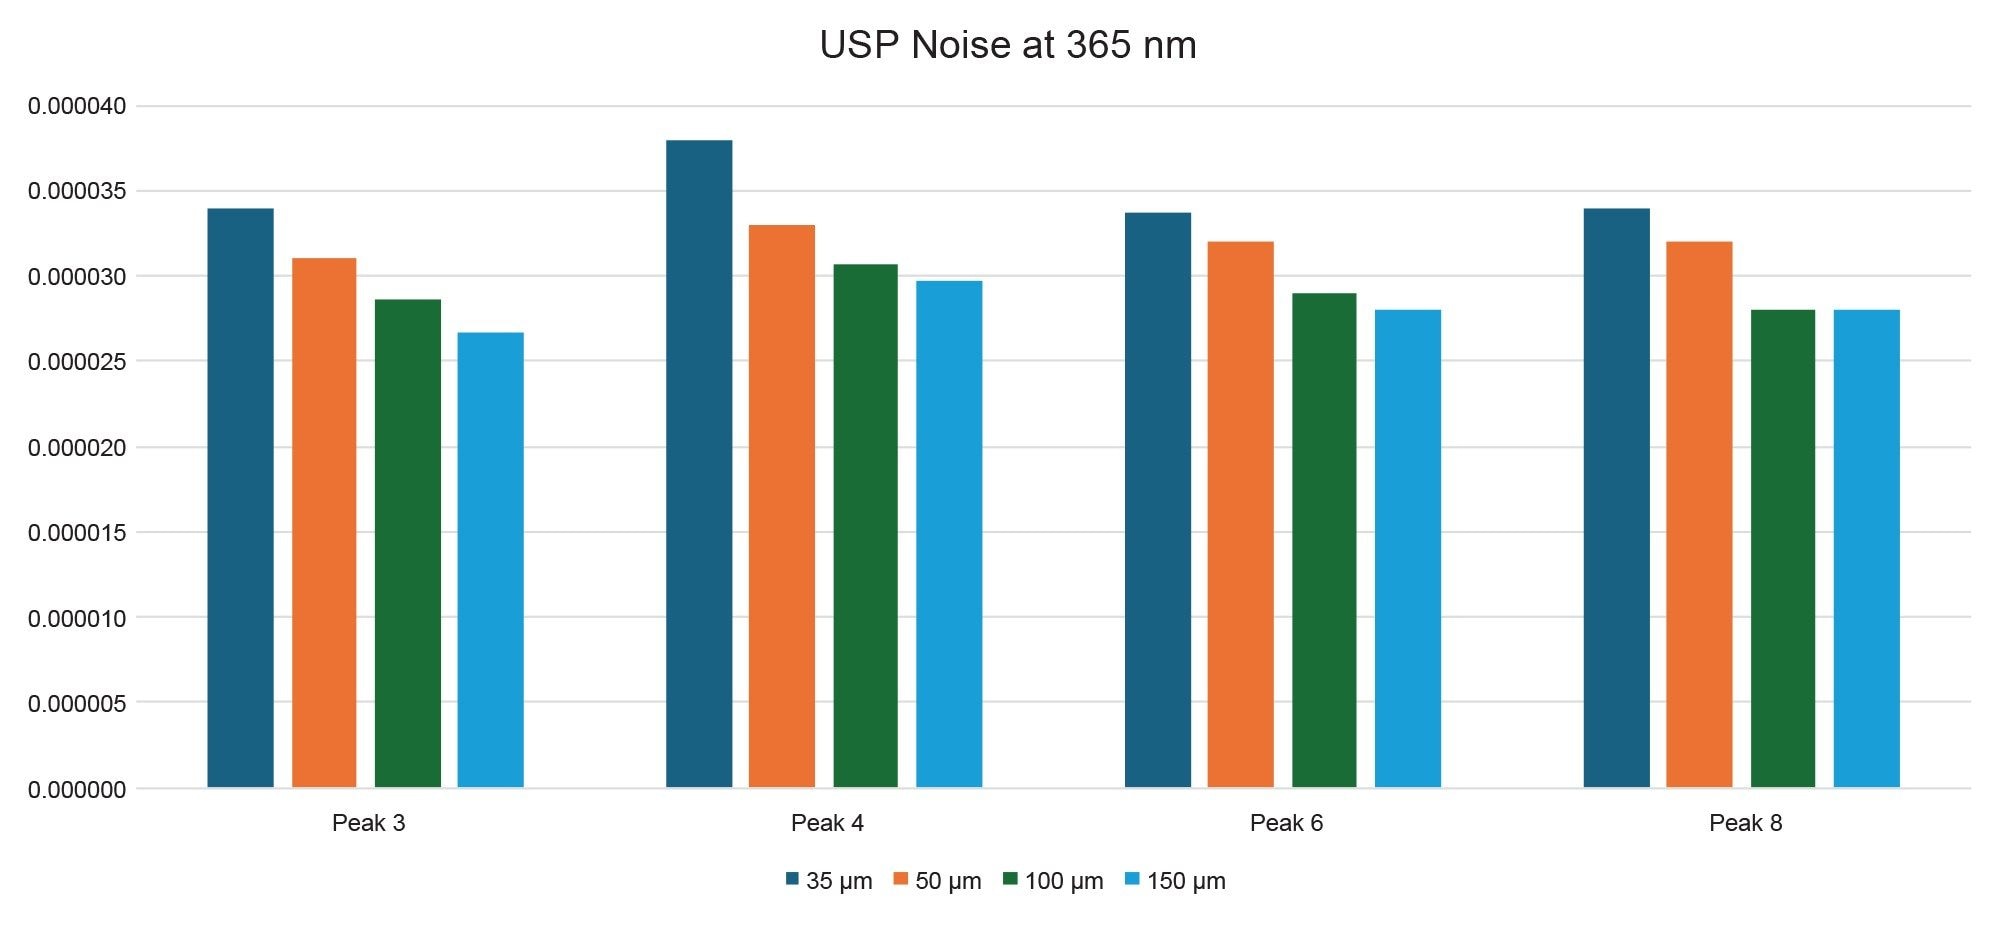
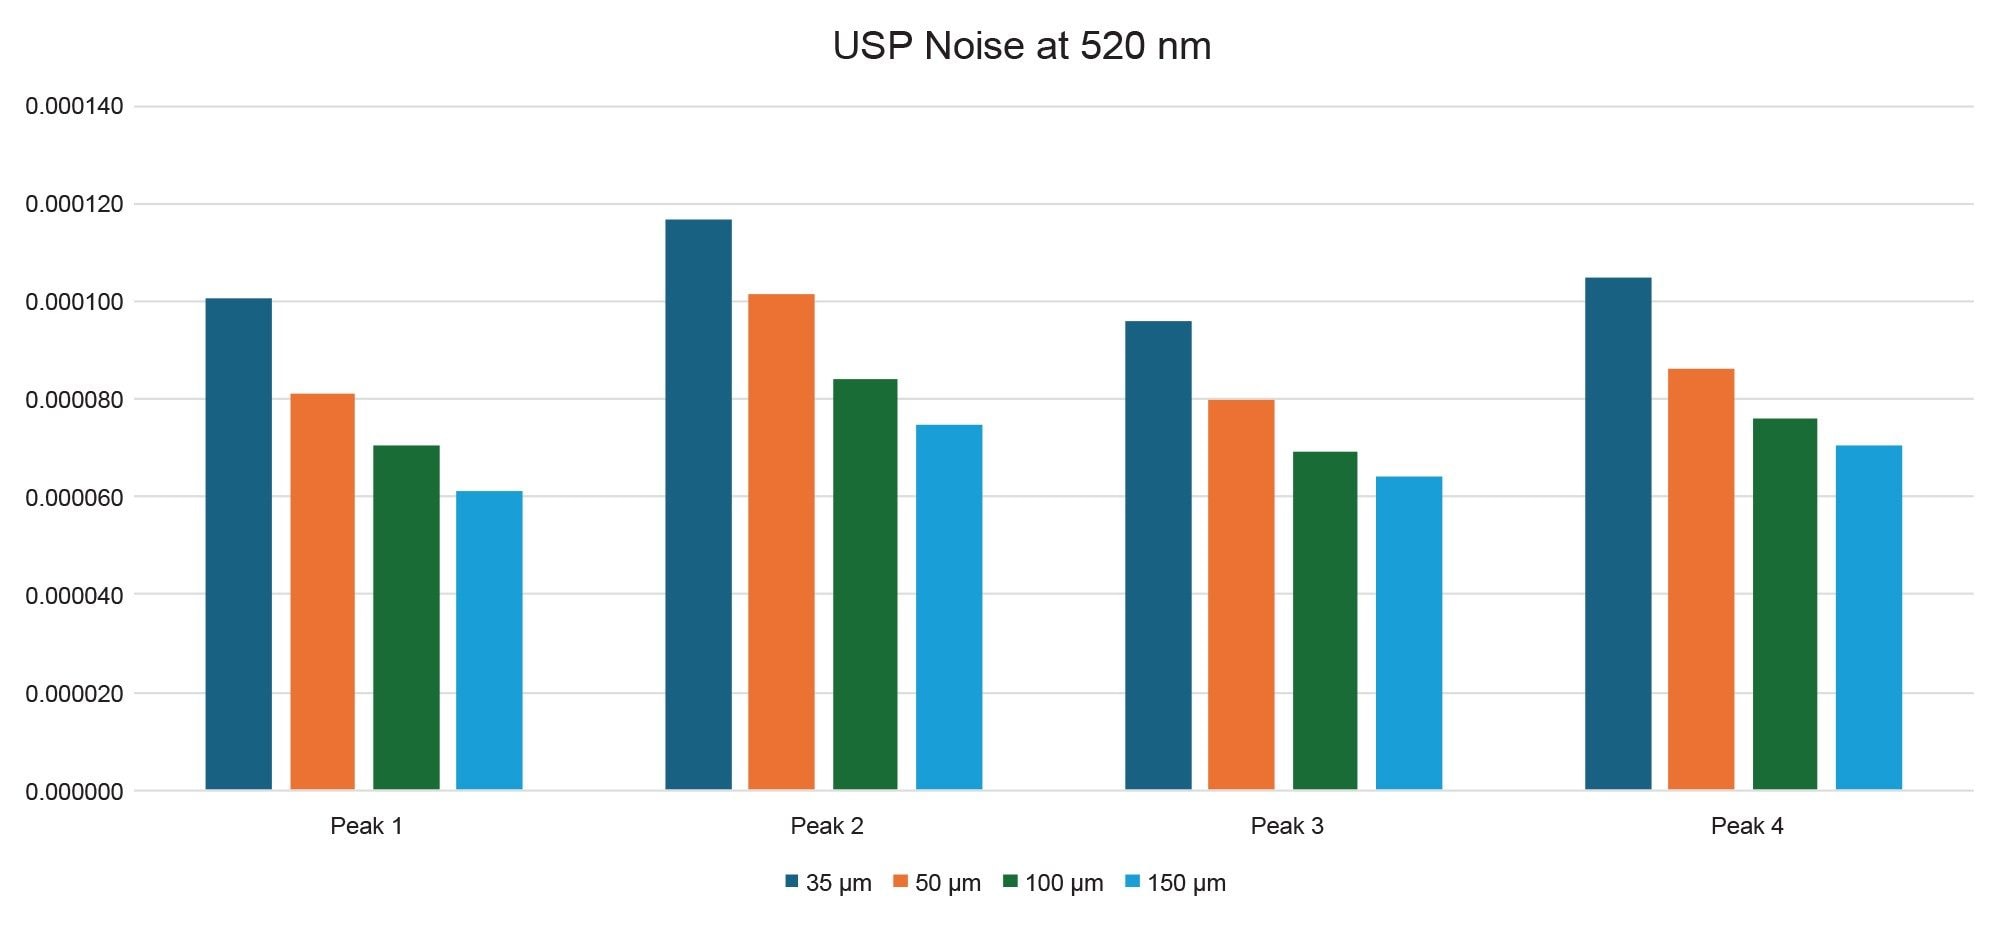
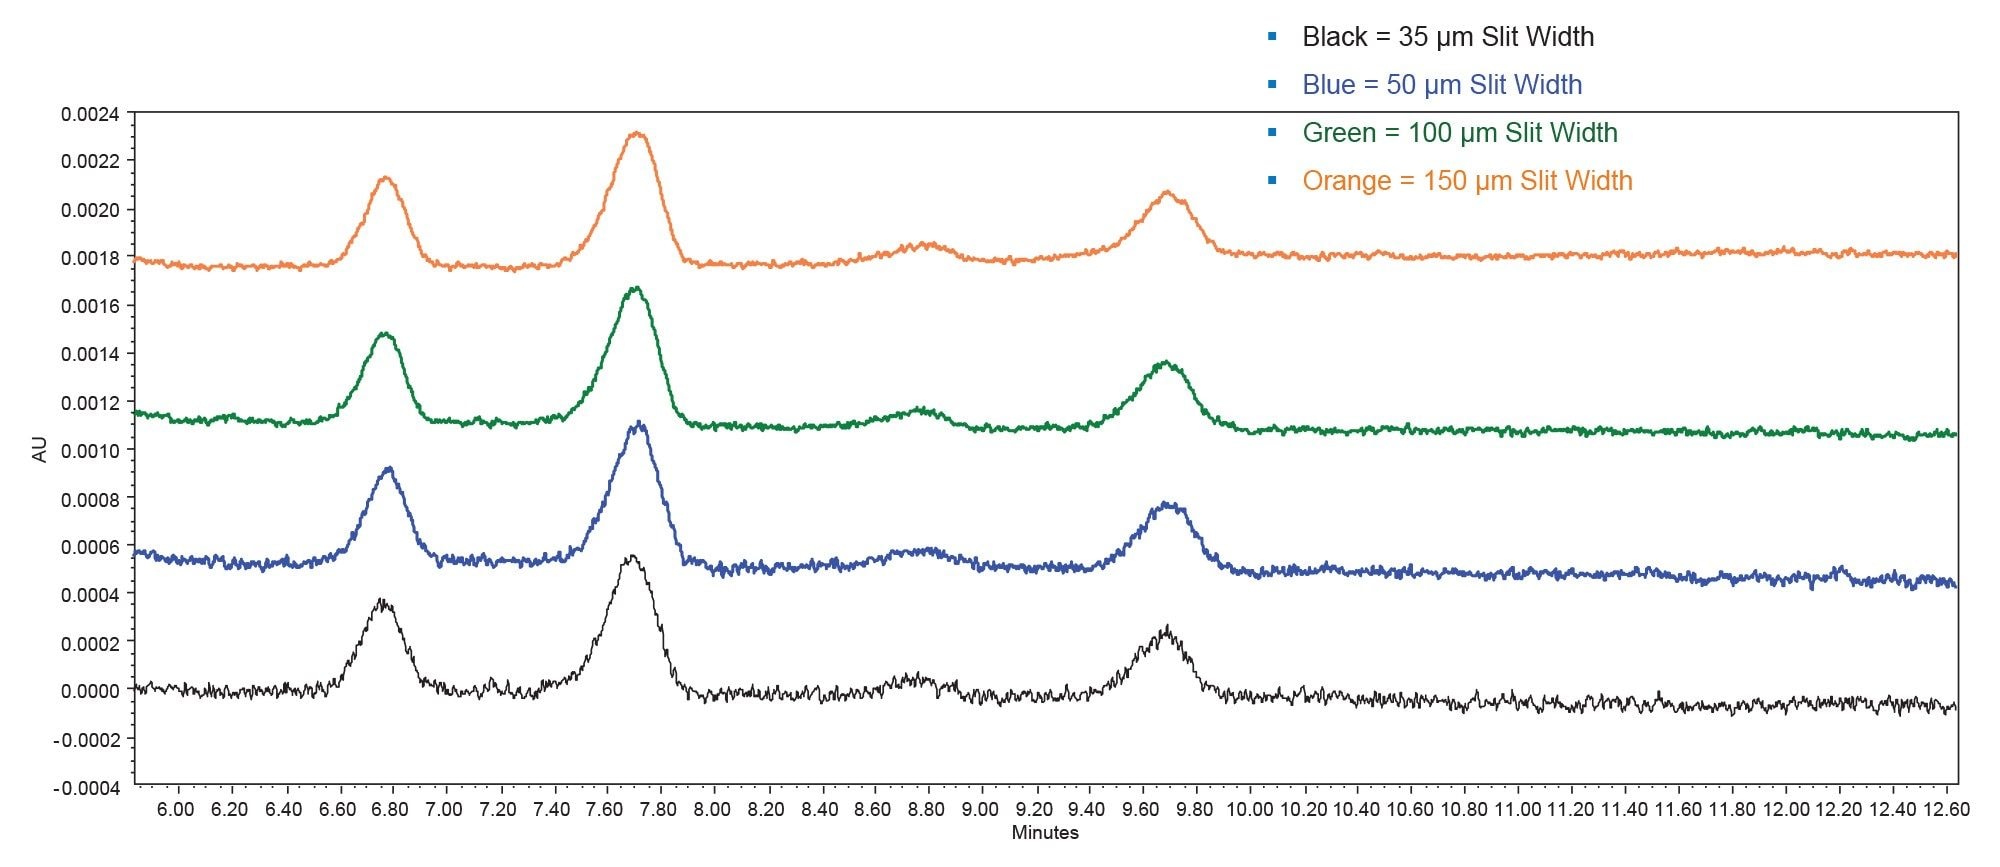
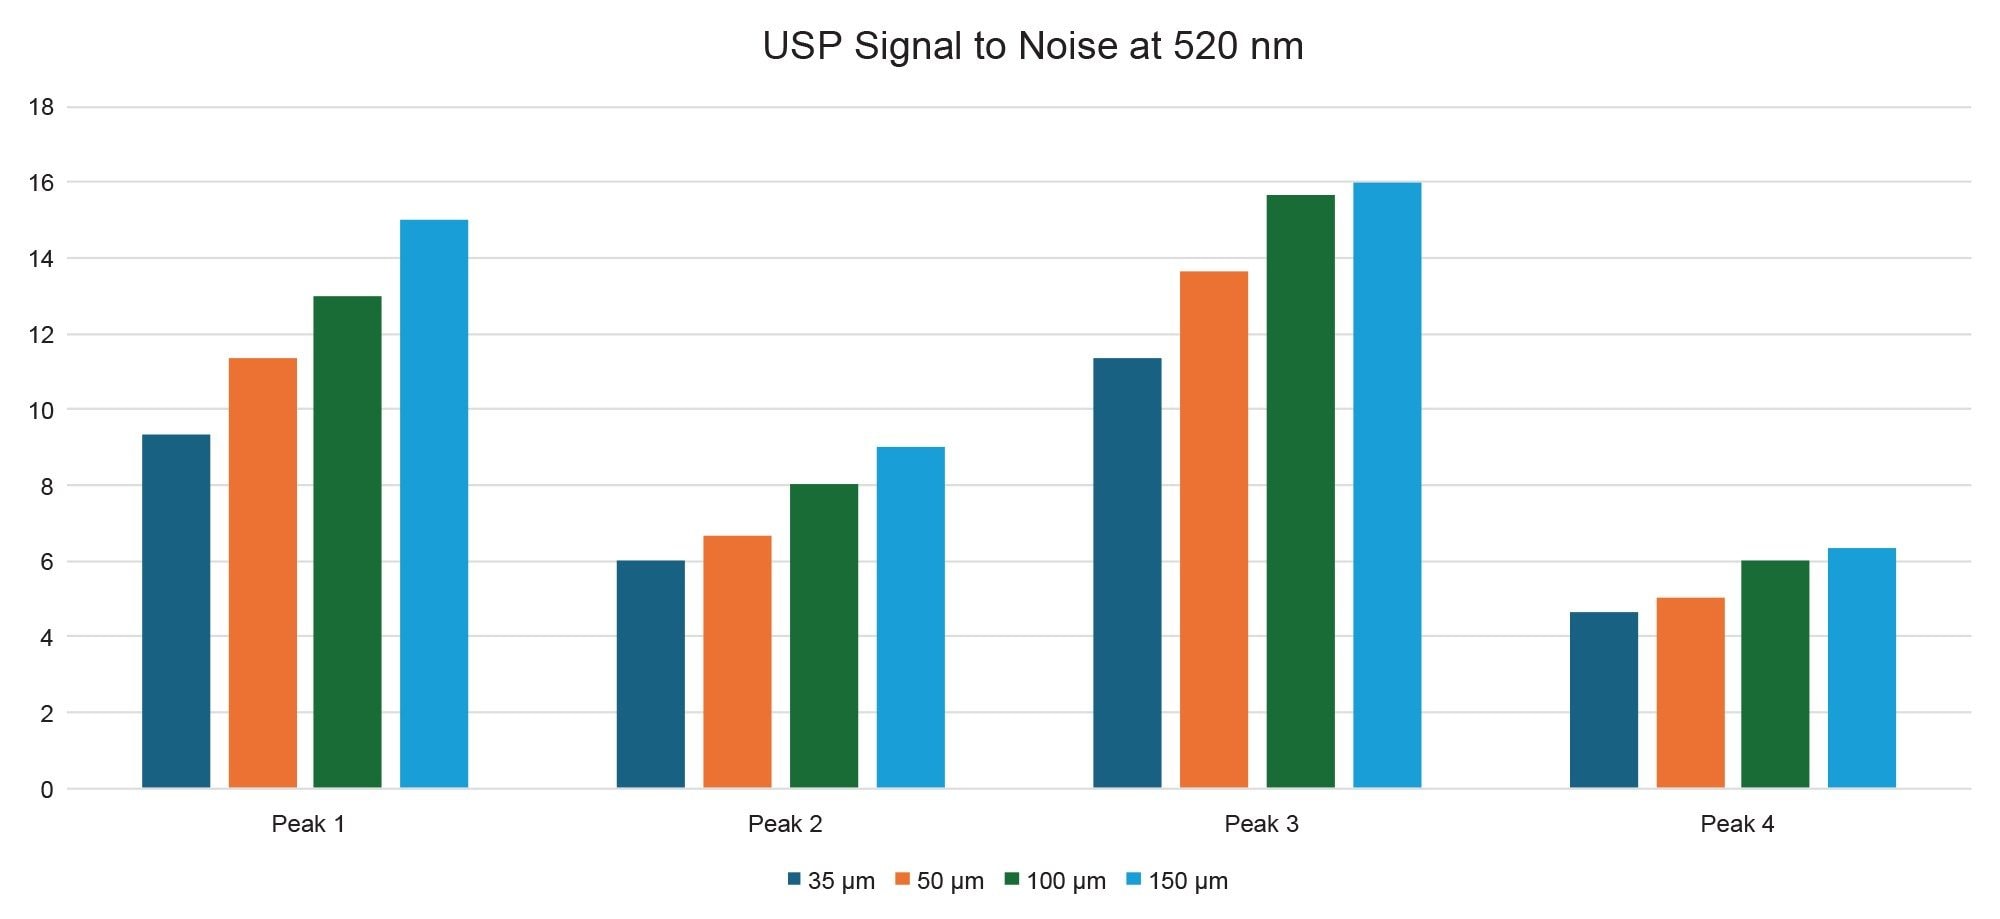
The results show similar results across both wavelengths and baselines: USP noise values at both 365 nm (Figure 3) and 520 nm (Figure 4) decrease consistently as the PDA slit width is increased. This trend is evident across all four evaluated peaks and reflects the expected reduction in baseline variability with broader slit settings. At low analyte concentrations, the chromatographic baseline becomes visibly smoother with increasing slit width (Figure 5), providing qualitative confirmation of the corresponding decrease in noise, which is crucial for quantifying small peaks in low-level detection methods, such as in impurity profiling or trace analysis.
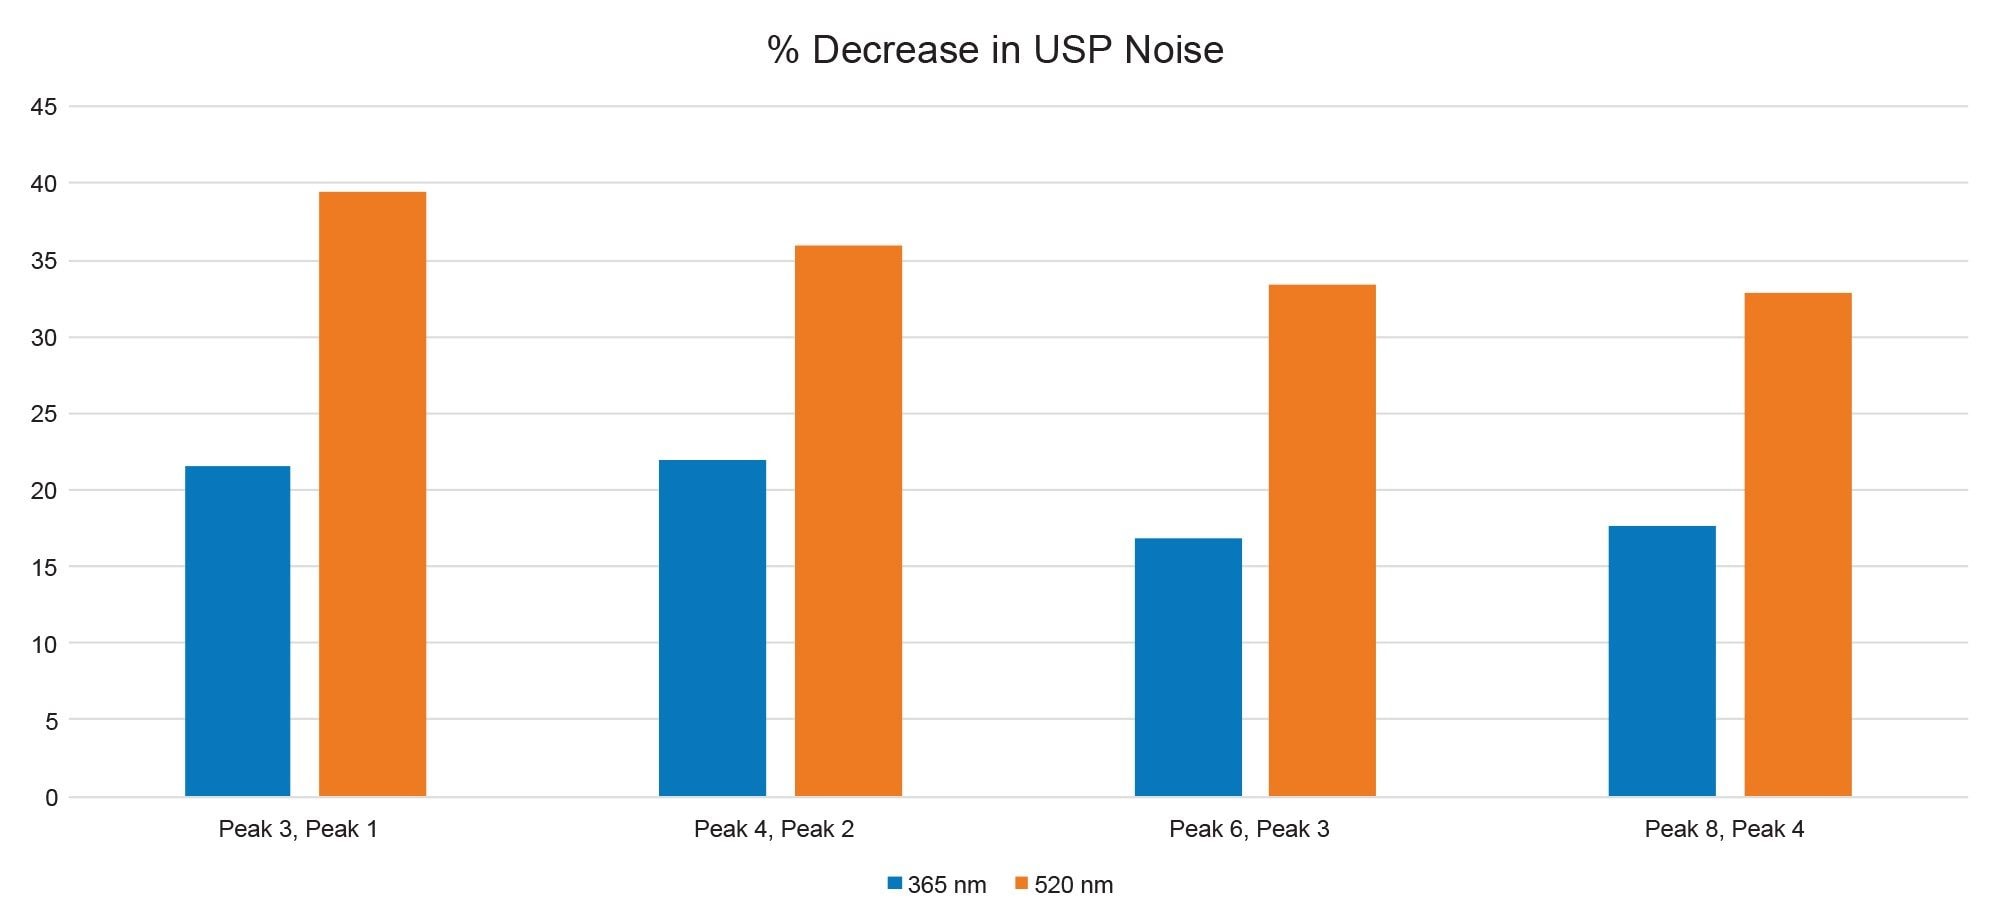
However, closer examination of the data reveals wavelength-dependent differences in the magnitude of the slit width effect. Specifically, slit width affects detector performance differently at lower and higher wavelengths due to changes in lamp output and analyte absorbance across the UV/Vis spectrum. At lower wavelengths such as <360 nm, lamp intensity and absorbance are relatively high, allowing usable signal even at narrower slit widths, which can improve spectral resolution with only a moderate increase in noise. In contrast, at higher wavelengths such as 520 nm, lamp output and analyte absorbance are lower, making chromatographic performance more sensitive to slit width selection; narrow slits significantly increase noise and reduce sensitivity, while wider slits substantially improve light throughput, producing smoother baselines and higher S/N with minimal practical loss of spectral resolution. For these reasons, the magnitude of the impact varies, with up to 22% decrease in noise at 365 nm versus up to 39% decrease in noise at 520 nm (Figure 6).
How Slit Width Impacts USP Signal‑to‑Noise (S/N) and Low‑Level Quantitation
Aside from noise, the analysis was also evaluated for the impact on sensitivity and low-level quantitation. The USP S/N, or the sensitivity, measures the clarity of an analyte signal compared to the baseline noise.
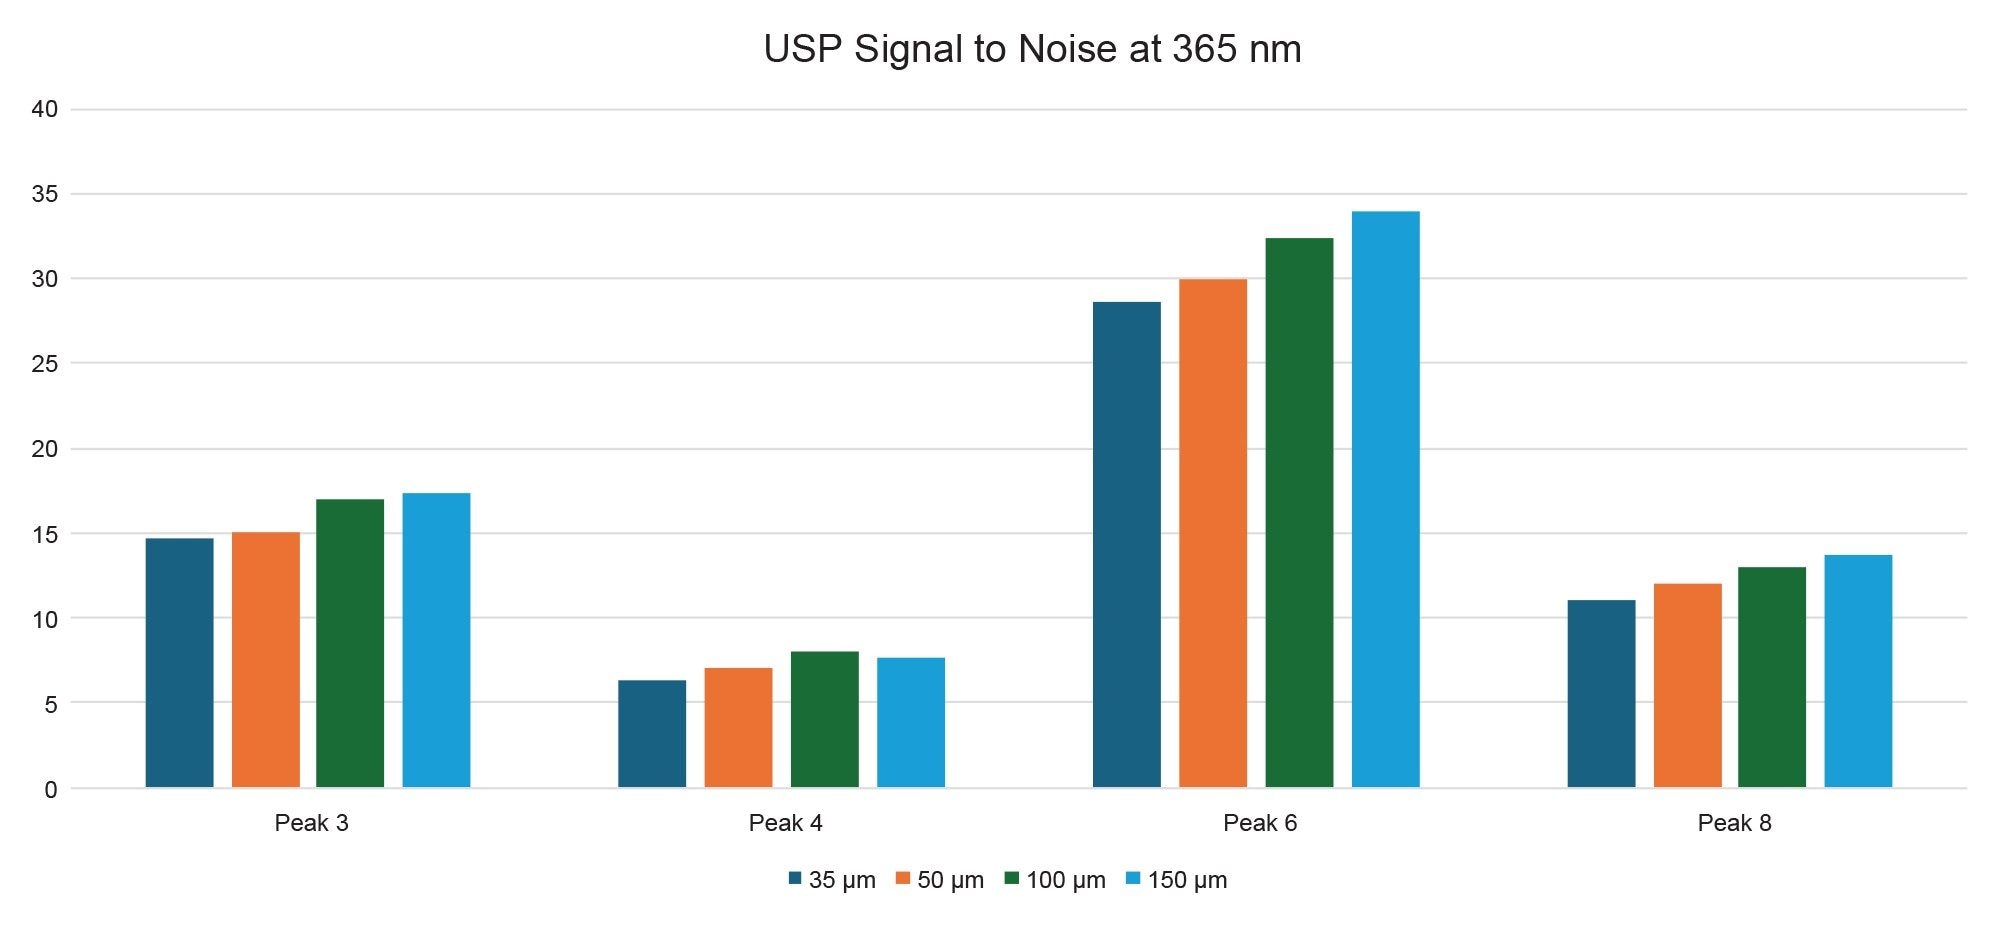
As with the USP noise measurements, the S/N performance was assessed across all four of the varying slit widths on the Alliance iS HPLC System with PDA Detector, following the USP Cranberry Juice method at wavelengths 365 nm and 520 nm. For the USP S/N assessment, a low-concentration standard of 0.02 mg/mL, near the LOQ levels for some analytes, was tested using all slit widths. A clear trend emerged: as slit width increased, the USP S/N ratio also increased, indicating improved sensitivity.
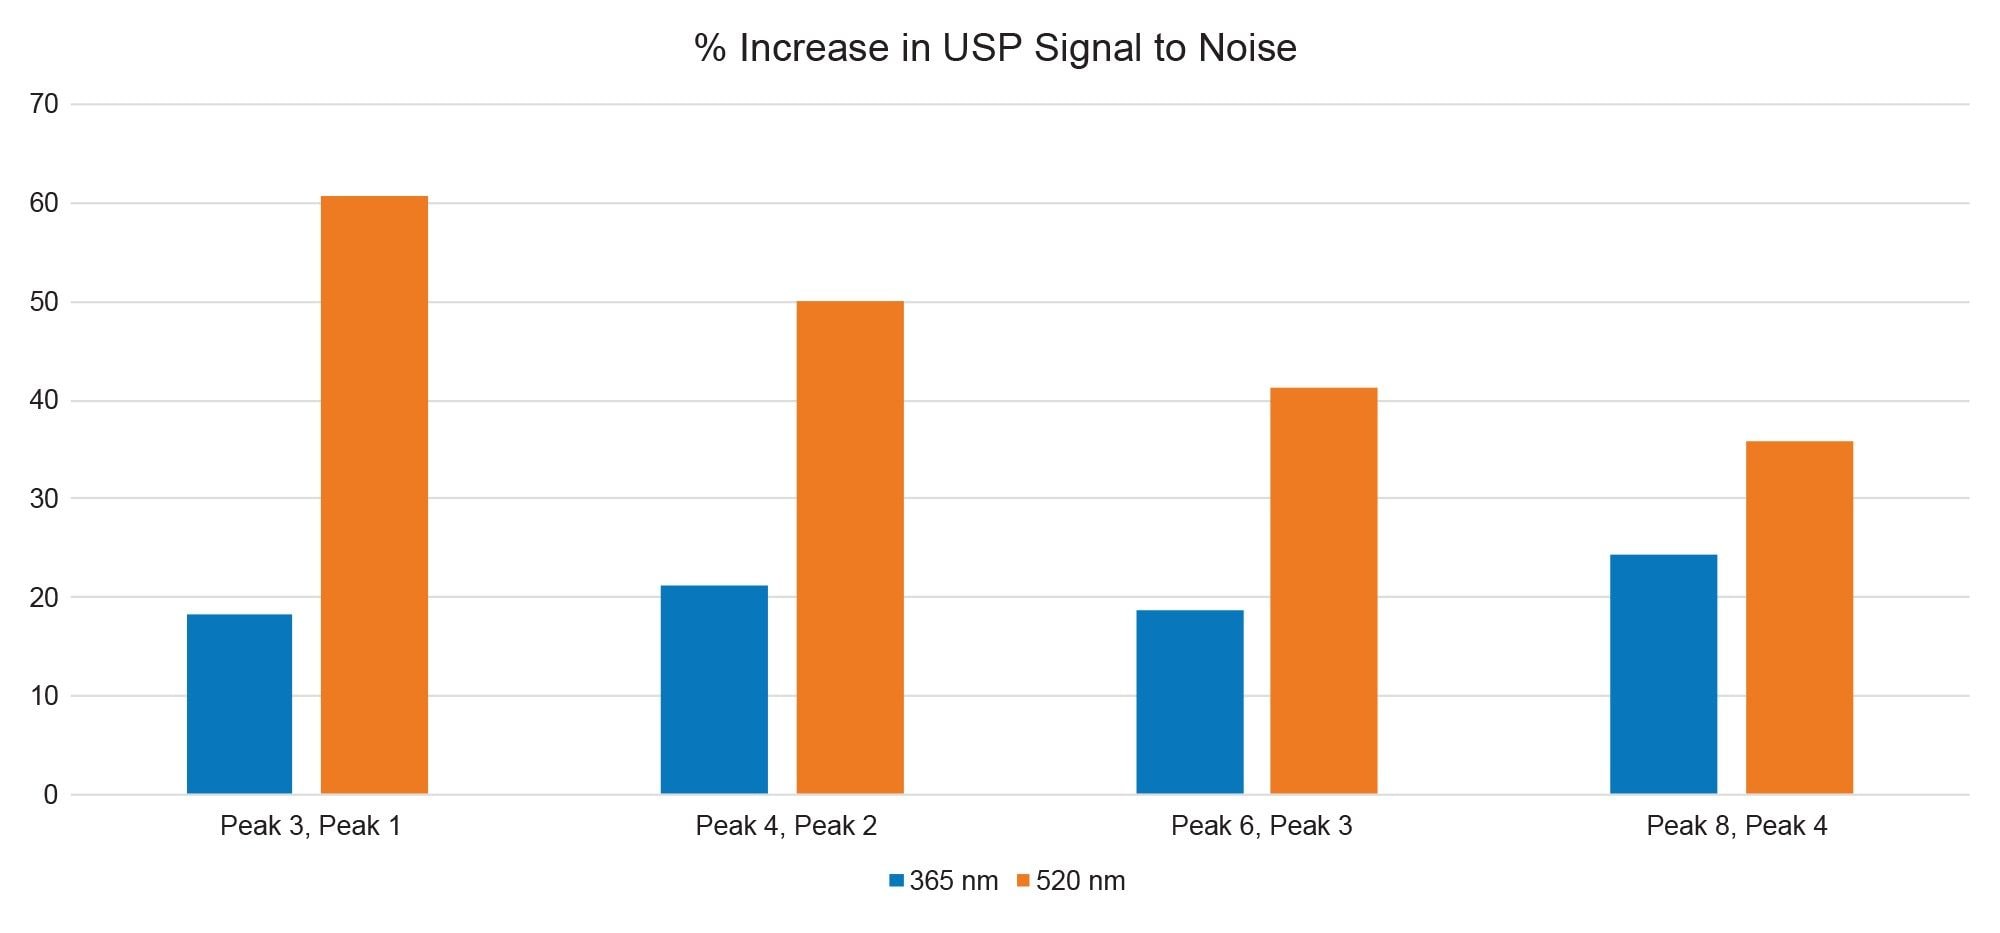
Analysis of the data reveals wavelength-dependent differences in the impact of slit width on detector sensitivity. Although sensitivity increased at both 365 nm and 520 nm, as slit width was expanded, the magnitude of this improvement was not uniform. At higher analyte concentrations and lower wavelengths (365 nm), the influence of slit width on sensitivity was less pronounced than at wavelengths above 500 nm. Therefore, the amount of the impact can be seen with the USP S/N value increasing up to 24% for the compounds at 365 nm and the USP S/N value increasing up to 61% for the compounds at 520 nm (Figure 9). This behavior reflects the combined effects of optical energy and analyte absorbance, both of which vary with wavelength and concentration. At lower wavelengths, lamp output is higher and flavonoids exhibit stronger absorbance, resulting in adequate signal even at narrower slit widths and only modest sensitivity gains with further slit expansion. In contrast at higher wavelengths where lamp intensity and absorptivity are reduced, the analysis becomes increasingly light-limited; under these conditions, increasing slit width substantially enhances photon flux at the detector, leading to more pronounced improvements in S/N ratio and apparent sensitivity. Because wider slit widths reduce spectral resolution, slit width required for peak confirmation or assessment of co-elution risk. To avoid underestimating limits of quantitation, slit width should be standardized for the method so that artificially low noise at very wide settings does not bias sensitivity claims. This relationship is particularly relevant for low-concentration analyses, where maximizing S/N is essential for accurate quantification.
Conclusion
This study demonstrated how the variable slit width capability of the Alliance iS HPLC System with PDA Detector provides a practical and effective means to optimize the USP Cranberry Fruit Juice flavonoid method at 365 nm and 520 nm. Across both wavelengths, increasing slit width consistently reduced USP noise, improved baseline stability, and enhanced S/N performance, supporting more reliable LLQ, while narrower slit widths improved spectral resolution for qualitative assessments. The magnitude of these benefits was wavelength dependent, with slit width having a greater impact at 520 nm where analyzes are more light-limited. By selecting and standardizing an appropriate slit width, analysts can balance sensitivity and spectral detail to strengthen method robustness, maintain USP-aligned reporting, and increase confidence in trace-level flavonoid quantification. Based on the data collected for the optimum slit width for the USP Cranberry Fruit Juice flavonoid method is the 150 µm setting which had the lowest USP Noise and the highest USP S/N. Leveraging the flexibility of the Alliance iS HPLC System with PDA Detector enables enhanced method performance while ensuring compliance and reproducibility across laboratories.
References
Official Monographs, USP-NF Cranberry Fruit Juice, Dietary Supplement Monographs, https://doi.usp.org/USPNF/USPNF_M20454_05_01.html, Printed on 23 Oct 2025.
- Determination of Flavonoids in Fruit Juice. Waters Application Note. WA60197. April 2008.
- Yang, J; DeMuro, R; Romano, J, Analysis of Flavonoids in Juices with the ACQUITY QDa Detector. Waters Application Note. 720004985. November 2016.
- Pullancheri, D; et al. Qualitative and Quantitative Analyses of Water-Soluble Vitamins and Flavonoids in Pomegranate Aril Juice, Skin, and Commercially Available Fruit Juice Using the ACQUITY UPLC H-Class with PDA Detector. Waters Application Note. 720004644. June 2013. United States Pharmacopeia. Cranberry Fruit Juice. In: USP–NF Online. Retrieved 23Oct25. https://online.uspnf.com/uspnf/document/1_GUID-DA742873-0693-401B-B0C8-6B9CECAFE5BE_5_en-US.
- https://help.waters.com/help/en/product-support/alliance-is-system-support/715008450/4C682A2.html.
- https://help.waters.com/help/en/product-support/alliance-is-system-support/715008450/048ABD8.html#:~:text=Variable%20slit%20%2D%20Determines%20the%20resolution,(greater%20than%20345%20nm).
- The Relationship of Noise, Linear Dynamic Range, Optical Resolution and Number of Diodes on Resolution in Photodiode Array Detectors, Dick Andrews, Waters White Paper. October 2017.
Featured Products
720009447, July 2026


