High resolution mass spectrometry (HRMS) techniques are well suited for dealing with large compound lists (non-targeted acquisition) and provide more molecular information (fragment pathways, isotope information, adducts etc.).
Recently implemented for food safety analyses, ion mobility coupled with HRMS affords an additional separation of ions, based on size, shape, and charge. With the Vion IMS QTof System, ion mobility separation (IMS) occurs after introduction of the ions into the source. As a result, a collision cross section (CCS, units of Å2) value is obtained for a compound and represents a unique parameter reflective of the average rotational value of an ion as it travels through the mobility cell. Spectral cleanup is unique to
ion mobility data, which aids the elucidation of unknown compound spectra and confirmation of known compounds.
This application note demonstrates the use of the combination of accurate mass data for both parent and fragment ions, isotopic distribution, ion mobility separation, and high quality UPLC separation to identify targeted pesticide compounds in French green bean, strawberry, jalapeño, and mini sweet pepper extracts employing a large screening library. Also, this approach was harnessed to make an identification of a new insecticide present in a vegetable extract.
The general term ‘pesticide screening’ often involves complex samples and large target lists. The former is a result of generalized extraction methods to maximize compound coverage as well as variation in commodity biochemistry. The latter is a result of thousands of compounds registered for use. In addition to the use of tandem quadrupole MS/MS approaches, high resolution mass spectrometry (HRMS) techniques are well suited for dealing with large compound lists (non-targeted acquisition) and provide more molecular information (fragment pathways, isotope information, adducts etc.). Recently implemented for food safety analyses, ion mobility coupled with HRMS affords an additional separation of ions, based on size, shape, and charge.1 With Waters Vion IMS QTof System, ion mobility separation (IMS) occurs after introduction of the ions into the source. As a result, a collision cross section (CCS, units of Å2) value is obtained for a compound and represents a unique parameter reflective of the average rotational value of an ion as it travels through the mobility cell.2 Spectral cleanup is unique to ion mobility data,3 which aids the elucidation of unknown compound spectra and confirmation of known compounds.
In this application note, the combination of accurate mass data for both parent and fragment ions, isotopic distribution, ion mobility separation, and high quality UPLC separation was used to identify targeted compounds in French green bean, strawberry, jalapeño, and mini sweet pepper extracts employing a large screening list. Using a non-targeted data-independent acquisition, it was possible to identify a relatively new replacement pesticide in the mini sweet pepper extract that was not present in the screening library. All results were cross checked and found to be accurate, and the expected compounds from a previous tandem quadrupole MS/MS analysis were identified.
To ensure optimum system performance the automatic setup was undertaken prior to sample analysis. At the push of a button the detector, resolution, lockspray, and calibration are all set-up. Sample extracts of French green bean, strawberry, jalapeño, and mini sweet pepper were analyzed using both 1 µL and 5 µL injections (in triplicate). Two different chromatography methods were utilized, as described in the UPLC conditions section. Prior to and after the samples were analyzed, replicate QC injections were run to assess the stability of mass accuracy, CCS values, expected fragment ion formation, response, and retention time (RT). Data were acquired using full spectral acquisition with ion mobility separation and alternating high- and low-collision energy states (HDMSE). Automatically following acquisition, data was componentized and processed against a screening library containing compound names, structures, retention times, expected fragment masses and CCS values (for +H ions, as well as +Na/+K adducts in some cases). Library values were generated using LC conditions from Method A (described in Method conditions) and solvent standards. In the case of CCS and RT, multiple inputs were averaged to represent well characterized values. Acquisition, processing, and review of data were performed using UNIFI Software v.1.8.
Sample extracts were provided by a collaborator and prepared using a modified QuEChERS approach. Extracts were stored in 100% acetonitrile, and then diluted 1:1 with water prior to injection.
Method A: |
|
||
---|---|---|---|
LC system: |
ACQUITY UPLC I-Class |
||
Column: |
ACQUITY UPLC BEH C18 1.7 μm, 2.1 x 100 mm |
||
Column temp.: |
45 °C |
||
Sample temp.: |
4 °C |
||
Flow rate: |
0.450 mL/min |
||
Injection volume: |
1 and 5 μL |
||
Mobile phase A: |
10 mM ammonium acetate (pH5.0) in water |
||
Mobile phase B: |
10 mM ammonium acetate (pH 5.0) in MeOH |
||
Total run time: |
17 min |
Min |
Flow rate(ml/min) |
%A |
%B |
---|---|---|---|
Initial |
0.45 |
98 |
2 |
0.25 |
0.45 |
98 |
2 |
12.25 |
0.45 |
1 |
99 |
13.00 |
0.45 |
1 |
99 |
13.01 |
0.45 |
98 |
2 |
17.00 |
0.45 |
98 |
2 |
Method B |
|
---|---|
UPLC system |
ACQUITY UPLC I- Class |
Column: |
ACQUITY UPLC HSS T3 1.8 µm, 2.1 x 100 mm |
Column temp.: |
40 °C |
Sample temp.: |
4 °C |
Flow rate: |
0.450 mL/min |
Injection volume: |
1 and 5 µL |
Mobile phase A: |
4mM ammonium formate in 0.1% formic acid in water |
Mobile phase B: |
4 mM ammonium formate in 0.1% formic acid in MeOH |
Total run time: |
18.5 min |
Min |
Flow rate(mL/min) |
%A |
%B |
---|---|---|---|
Initial |
0.4 |
95 |
5 |
0.50 |
0.4 |
95 |
5 |
3.00 |
0.4 |
57 |
43 |
13.50 |
0.4 |
19 |
81 |
14.50 |
0.4 |
1 |
99 |
16.50 |
0.4 |
1 |
99 |
16.51 |
0.4 |
95 |
5 |
18.50 |
0.4 |
95 |
5 |
MS system: |
Vion IMS QTof |
||
Ionization mode: |
ESI+ |
||
Collision energy (LE): |
3 eV |
||
Collision energy (HE ramp): |
20 to 55 eV |
||
Scan time: |
0.25 sec |
||
Acquisition range: |
50 to 1200 m/z |
||
Drift gas: |
N2 |
||
IMS wave velocity: |
250 m/s |
||
IMS wave height (ramp): |
20 to 50 V |
||
Capillary voltage: |
0.8 kV |
||
Sampling cone: |
20.0 V |
||
Source temp.: |
120 °C |
||
Source offset: |
80 |
||
Desolvation temp.: |
550 °C |
||
Cone gas flow: |
50 L/hr |
||
Desolvation gas flow: |
1000 L/hr |
||
Lockmass: |
Leucine enkephaline (556.2766 m/z) |
||
Data management: |
UNIFI Scientific Information System |
Using a screening library approach to the highly complex data set, full spectrum sample data was interrogated for all extracts against a 500+ target list. Following a review of all samples, identifications were cross-checked against a previously performed LC tandem quadrupole MS/MS analysis and all expected compounds were found. The identifications are displayed via a component plot for mini sweet pepper in Figure 1. Concentration ranges, which ranged from 338 ng/g to less than 10 ng/g (described as “trace” level) were also derived from the tandem quadrupole MS/MS analysis.
In some cases, metabolites of targeted pesticides were present in the library, and were also identified, though not reported in the LC tandem quadrupole MS/MS data (Figure 1). Identifications were arrived at using filters within the Review portion of UNIFI Software. Filters are flexible, automatic criteria that are user defined and applied on top of the processed data. Full integration of the filters in data review is achieved through individual workflow steps in the software, which encapsulate a type of sample (unknown, QC, standard, etc.) and the aforementioned criteria in a specific view. UNIFI filters and workflows are further described in Waters’ 720005436en. To reduce false positives and have confidence in proposed identifications, the filter applied to this data set utilized information in the UNIFI screening library. Specifically, the data displayed was within the criteria listed in Figure 2, namely mass error, CCS% delta (from the library value), RT error (from Method A derived values), and presence of fragment ions.
Although strides have been made to avoid adducting, it is sometimes unavoidable in ESI experiments. Therefore using other points of criteria, in addition to fragment ions such as CCS, to make identifications can be helpful in avoiding false negatives. In order to consider the impact of +Na adducts resulting in some cases in the absence of expected fragment ions, a conditional function in the filter was easily implemented, stating that an expected fragment must be present, or, alternately a +Na adduct is the predominant ion observed. This was achieved using the operator “Match any of these expressions,” in Figure 2. Figure 3 shows how this filter looks from the perspective of the French green bean sample Review tab, where flubendiamide is only showing a +Na adduct, and therefore no fragment. However, other key criteria namely CCS, mass accuracy, and RT were accurate to the criteria specified. Once the filter is created, it is added to a workflow step in the analysis review, so that it will automatically be applied to the data when that step is selected. Only one identification, flutriafol, which was at sub-10 ppb levels in mini sweet pepper, contained a +H adduct and no expected fragment; all other criteria were met.
Following the initial analysis with LC method A, another method (LC method B) was proposed. This method was proposed due to its use of different additives to the mobile phase (formic acid rather than ammonium acetate), column (HSS T3 rather than BEH C18) and gradient as possible mechanisms for improved analysis results. As a result, retention times for various analytes were significantly different than in the screening library used previously. However, because CCS values are obtained in the gas phase, and represent inherent qualities of a molecule, there were no significant differences observed in the measured CCS values between the two LC methods. Figure 4 summarizes the variations between Methods A and B for both RT and CCS, showing the trends described above. By extending the number of identification points through the use of CCS, we were able to reduce the reliance on an experimentally variable parameter such as RT. Altering the filter used to make identifications was performed instantaneously by simply removing the RT requirement. A new workflow step was added to include this filter in the data review approach automatically in order to compare results for when using the two different chromatography methods with correct identifications achieved in both.
The introduction of novel pesticides that may not be available in screening libraries or online databases presents a difficult challenge for screening and monitoring. In addition to searching for a theoretically unlimited number of targeted ions a user is able to interrogate the data for unknown ions of interest using tools such as common neutral loss, halogen match, mass defect, binary compare, and multivariate analysis. The utility of a subset of these tools is demonstrated in the following example of identifying in some of the samples a newly manufactured insecticide, which was indicated by our collaborator to be present in the sample but was not in our search library that contained over 500 pesticides and metabolites.
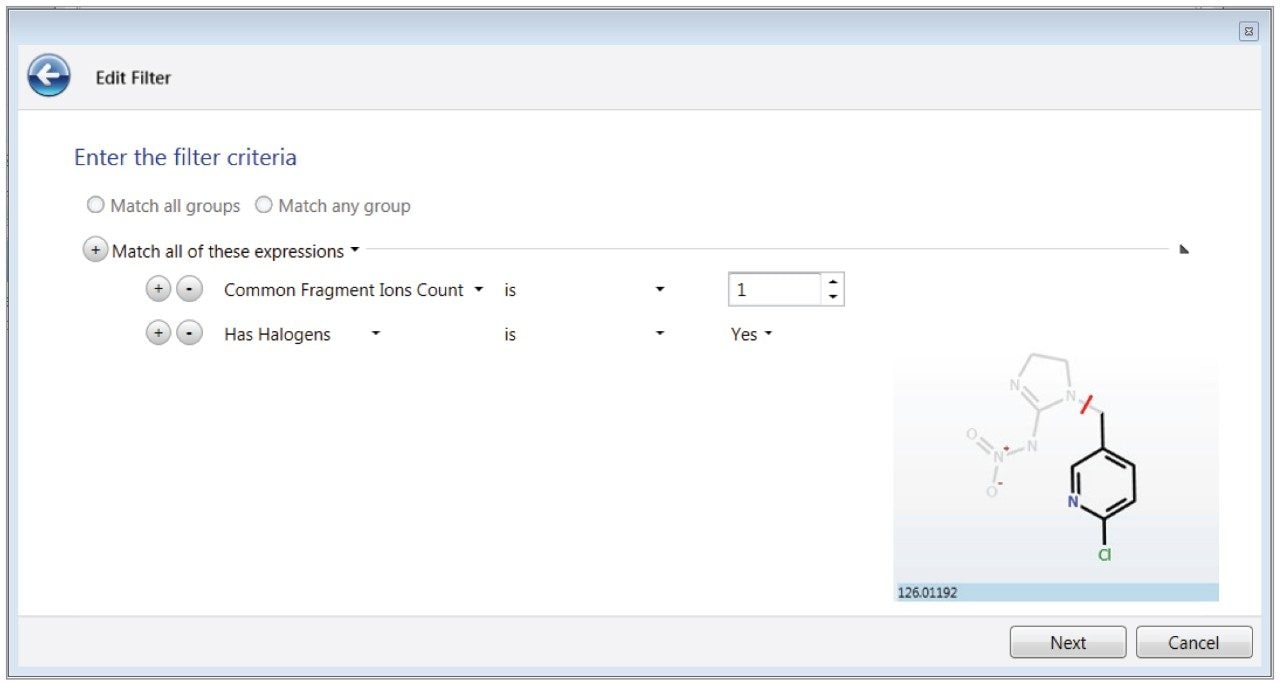
Imidacloprid is a neonicitinoid insecticide that has fallen under recent scrutiny in Europe and North America due to its possible association with colony collapse disorder (CCD) in the honey bee population.4 Data to support this correlation has resulted in the proposed ban of neonicitonoid pesticides, including imidacloprid, in France5 and Canada.6 As with most banned substances, less toxic replacement compounds that have similar actions as neonicotinoid pesticides are therefore in demand to be produced. In an effort to target similar compounds in the samples analyzed for this study, structural comparisons of existing neonicotinoids lead to a possible common fragment that could be present in new chemical formulations. Observed in imidacloprid, acetamiprid, thiacloprid, and nitenpyram, the nitrogen containing ring structure with a single chlorine substitution, shown in Figure 5, is a portion of the molecule that is likely to form a fragment during collision induced dissociation (CID).
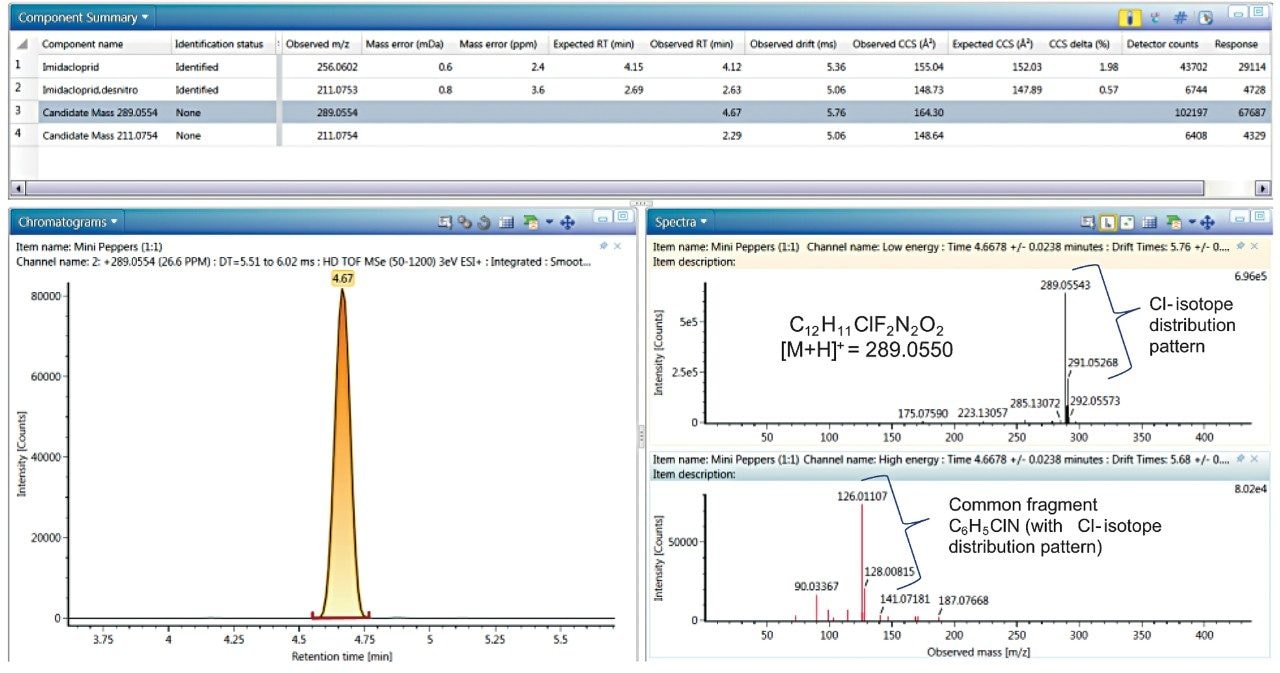
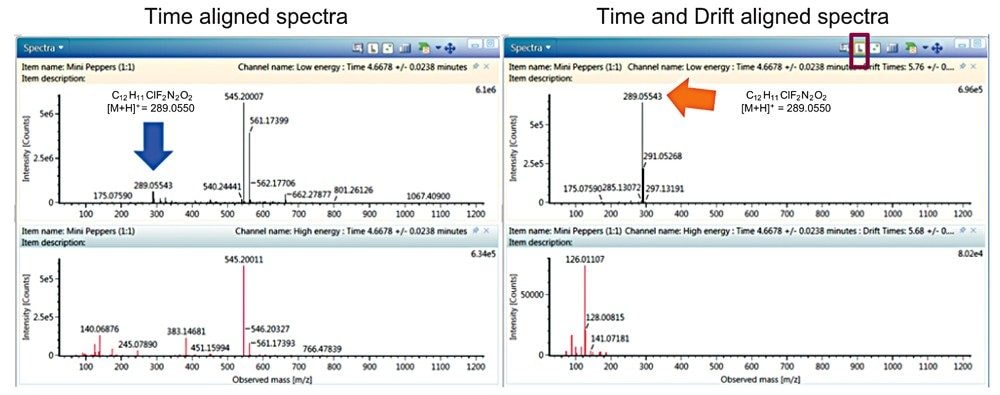
Using UNIFI filters to create criteria by which to view all data, this common fragment, in conjunction with a halogen match tool, were combined (Figure 5). This filter looked both at identified and unidentified components in the full data set for a combination of chlorine isotope distribution patterns in the low collision energy spectrum, and the fragment with a mass of 126.0119 (C6H5ClN) in the high collision energy spectrum. When this filter was applied to the mini sweet pepper data, a candidate mass (unassigned against the target list), as well as imidacloprid and its metabolite imidacloprid desnitro are displayed (Figure 6). The latter were identified in the previous filter for targeted analytes, and understandably fit the new filter, as they demonstrate both the halogen isotope distribution pattern of a single chlorine as well as the common fragment. Upon literature based investigation of the two candidate masses, the mass at 289.0554 was found to be the butenolide insecticide flupyradifurone, which has recently been manufactured. It is an alternative pesticide for treating sucking insect species by targeting nicotinic acetylcholine receptors7,8 which is the same mechanism as taken with neonicotinoids. As previously mentioned, although this pesticide was listed by the collaborator in the sample, it was not included in our original screening list. Therefore, using the tools delineated was a rapid and effective way of identifying flupyradifurone. With a single right click, the compound can be added to the UNIFI scientific library, with a qualifier that it was an incurred residue (e.g. flupyradifurone_incurred green bean).
In addition to the already highlighted advantages it should be noted that HDMSE data is inherently cleaner than comparable MS data, as shown in the comparison of the spectra in Figure 7. Toggling the button highlighted in Figure 7 displays the spectral ions that are now retention time and drift time aligned. Figure 7 also shows a comparison of the two spectrum, and it is apparent that a cleaner, easier to interpret spectrum is made possible when using IMS enabled spectral cleanup.
A pesticide screening experiment performed using an HDMSE approach resulted in the generation of information rich data sets. The data was easily filtered and reviewed based on identification criteria such as accurate mass of both precursor and fragment ions, RT, and CCS. Incorporating IMS in pesticide screening results in the measurement of CCS which improves confidence in compound identification, and can be used as an additional parameter in screening experiments. UNIFI Software seamlessly incorporates the CCS presentation and comparative calculations, making review simple. Using this UNIFI library screening approach which was processed against full spectral acquisition provided an automated means to mine the comprehensive data acquired. Adduct information was also included automatically in the data processing, incorporated into compound information presented to the user. Lastly, non-targeted compounds of interest can be searched for in the data set using intelligent filtering based on chemical properties. This approach was harnessed to make an identification of a new insecticide present in a vegetable extract.
The authors gratefully acknowledge Greg Mercer and William Cooke from the FDA in Bothell, WA, USA for supplying the samples.
720006120, October 2017