For research use only. Not for use in diagnostic procedures.
This application note demonstrates the functionality of hardware and software, along with the accuracy and precision obtained for the quantitative analyses of SILAC-labeled samples using LC/IM-DIA-MS (HDMSE) on a SYNAPT G2-S Mass Spectrometer.
***nanoACQUITY UPLC applications readily transfer to the ACQUITY UPLC M-Class System***
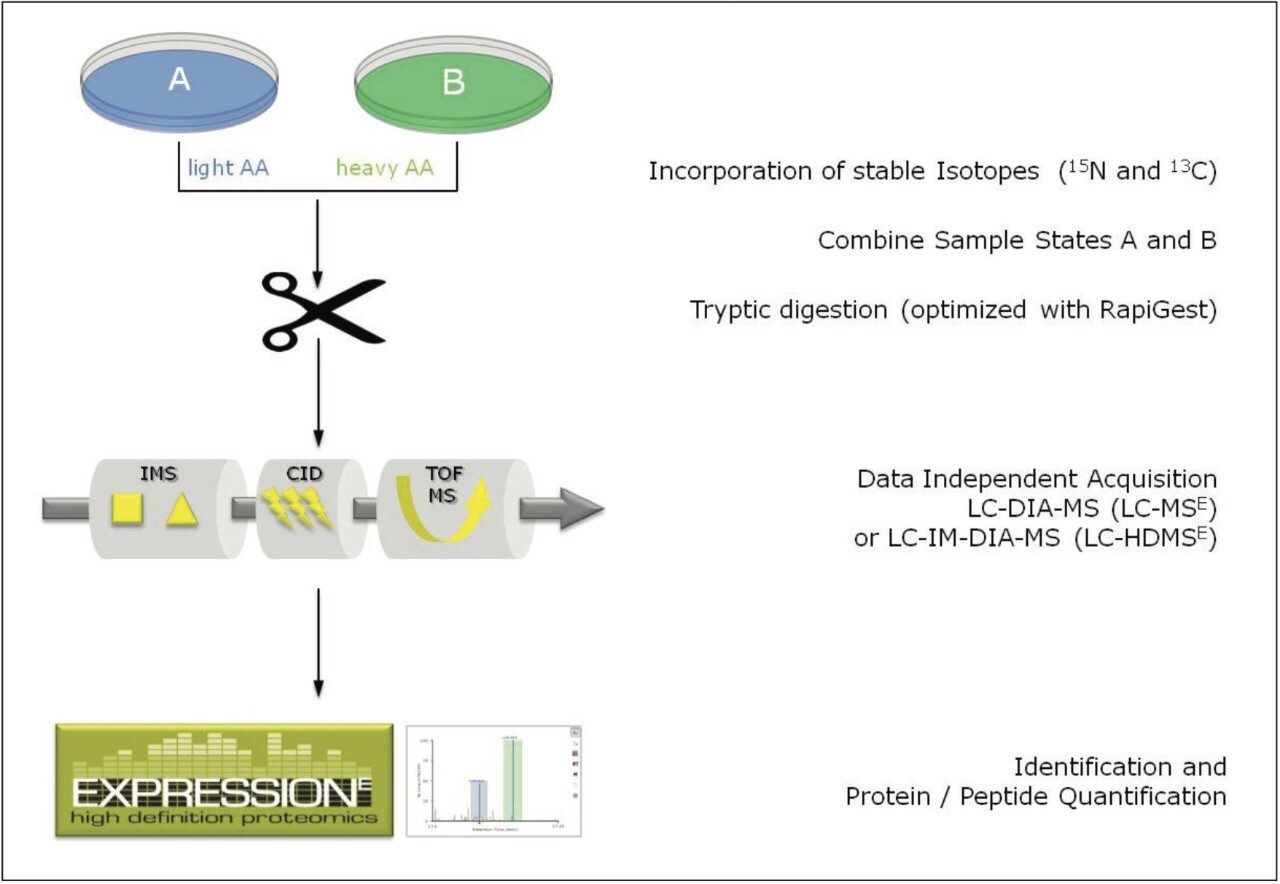
Stable isotope labeling with amino acids in cell culture (SILAC) is a popular metabolic labeling technique for mass spectrometric (MS)-based quantitative proteomics.1 In SILAC, cell cultures to be compared are grown in culture medium containing either naturally occurring, or stable-isotope labeled amino acids. Over several divisions, the amino acids are incorporated into cellular proteins, enabling the comparison of amounts of particular proteins from one cell type to its comparator.
In a comparative shotgun proteomics experiment, differentially labeled samples are mixed early in the experimental process and analyzed together by LC-MS/MS. The labeling does not affect the chemical properties of peptide; hence, they coelute from the LC column and can be analyzed simultaneously in the mass spectrometer. The peptides of the differentially labeled samples can be accurately quantified relative to each other to determine relative protein abundances.
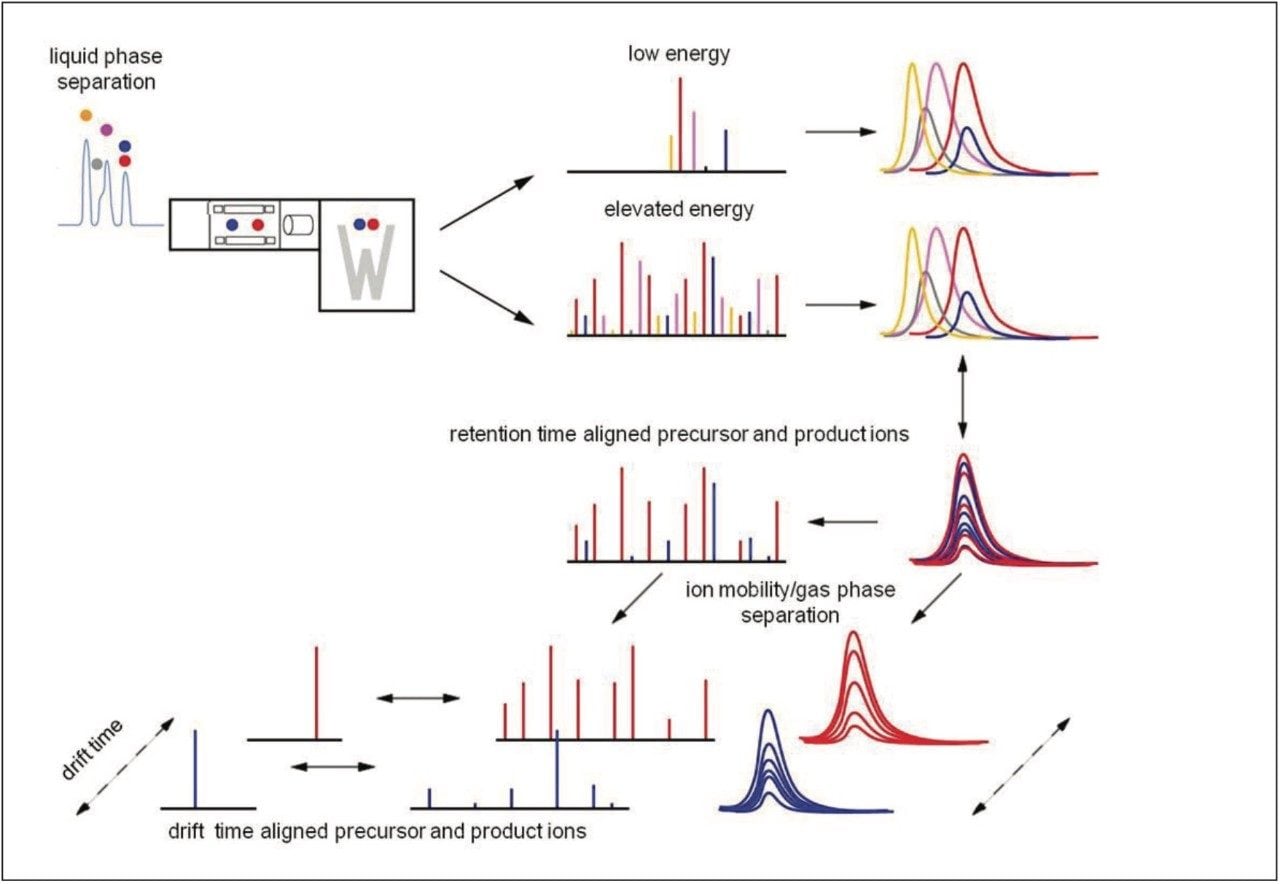
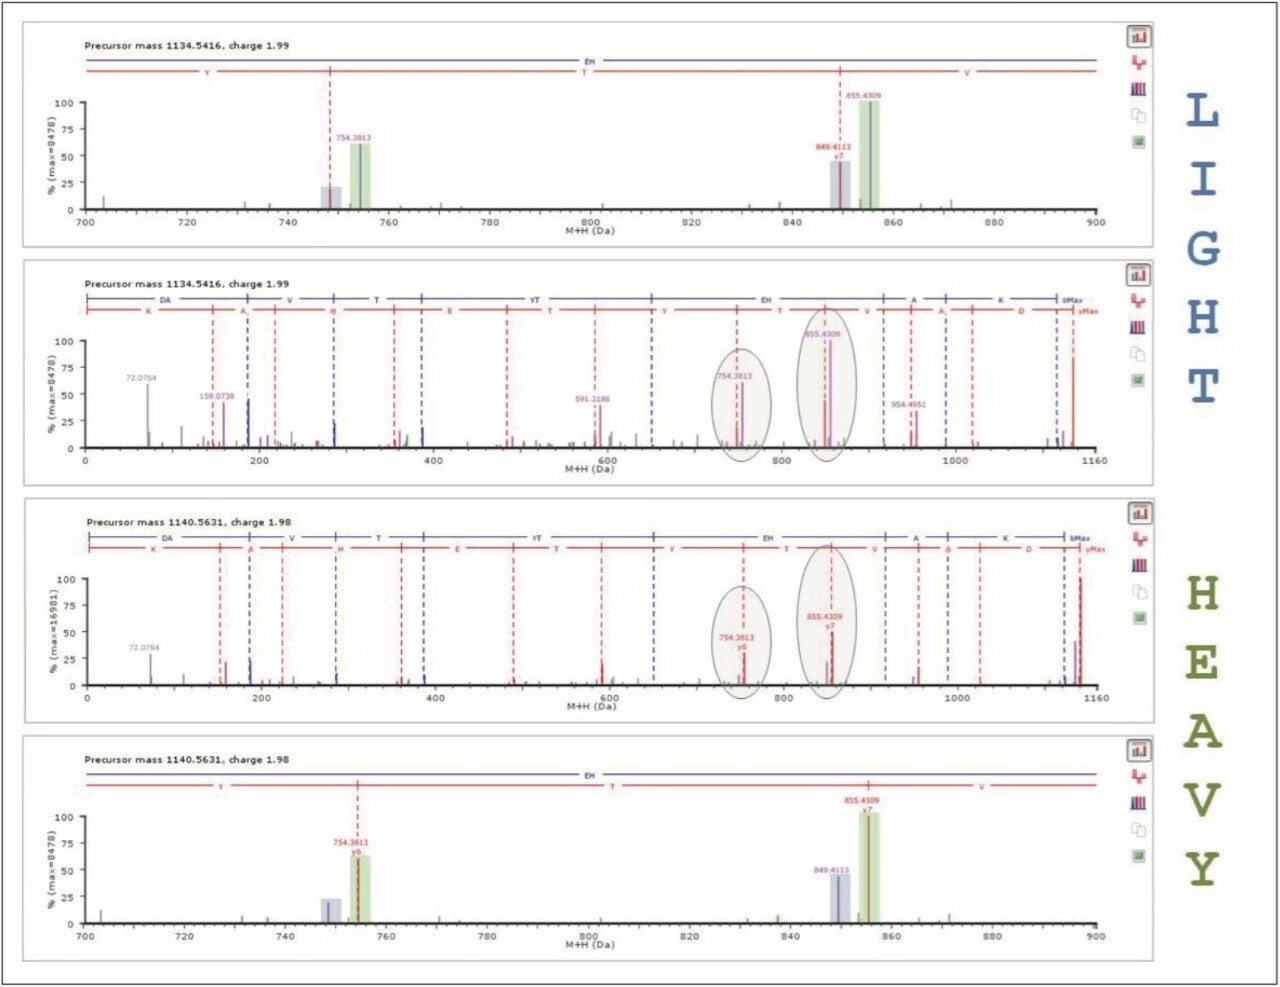
To date, the SILAC method has been predominantly applied to analyze cell cultures using data-dependent analysis (DDA) MS/MS techniques. However, DDA approaches are limited by issues with chimericy, a phenomenon likely to be more problematic in the increasingly complex samples observed in SILAC experiments.2 In this investigation, ion mobility (IM)-enabled data-independent analysis (DIA) has been utilized to quantify SILAC-labeled mutant embryonic mouse cells.
This application note demonstrates the functionality of hardware and software, along with the accuracy and precision obtained for the quantitative analyses of SILAC-labeled samples using LC/IM-DIA-MS (HDMSE) on a SYNAPT G2-S Mass Spectrometer
The sample investigated was a whole-cell lysate from immortalized murine bone marrow-derived pro-B-cell line which expressed a Jak2 V617F mutation. The Jak2 V617F mutation has been identified in 96% of patients with polycythaemia vera, a myeloprolioferative blood disorder in which the bone marrow makes too many red blood cells, leading to overly viscous blood. Investigation of proteomic and phosphoproteomic alterations in this cell line model will help to understand the disease, its genesis and progression, and potentially highlight opportunities for drug intervention. For this study, to illustrate the capacity to perform accurate SILAC experiments, Jak2 mutant mouse embryonic cells were SILAC-labeled with either naturally occurring light lysine, or heavy 13C6-lysine. Samples were digested with trypsin, and combined at a ratio of approximately 1:1 based on protein assay of the lysed cells.
System; |
nanoACQUITY UPLC |
Columns: |
Symmetry C18 180 μm x 20 mm 2G trap, 5 μm and BEH C18 75 μm x 150 mm, 1.7 μm NanoEase analytical |
Column temp.: |
35 °C |
Flow rate: |
300 nL/min |
Mobile phase A: |
Water (0.1% HCOOH) |
Mobile phase B: |
Acetonitrile (0.1% HCOOH) |
Gradient: |
3% to 40% B in 90 min |
Injection volume: |
1 μL |
Mass spectrometer: |
SYNAPT G2-S |
Ionization mode: |
ESI (+) at 3 kV |
Cone voltage: |
25 V |
Acquisition mode: |
HDMSE 50 m/z to 2000 m/z both functions (low and elevated energy) |
Acquisition rate: |
2 Hz/function |
Collision energy: |
5 eV (low energy function) and ramped from 25 eV to 45 eV (elevated energy function) |
Resolution: |
25,000 FWHM |
IMS T-Wave velocity: |
700 m/s |
IMS T-Wave pulse height: |
40 V |
ProteinLynx Global SERVER Software
A sample with estimated relative protein amounts was analyzed to investigate and demonstrate the utility of an HDMSE acquisition for the analysis of SILAC-labeled samples. This was achieved by combining tryptic digests of light lysine-labeled and heavy lysine-labeled mouse cell line samples. As the cell types are identical, the relative abundance of all quantified proteins should be approximately the same, tolerating for experimental variability introduced by cell harvesting, lysis, and liquid handling.
The workflow of the complete process is shown in Figure 1, starting with the metabolic labeling of the samples, combining and digesting them, followed by the LC-MS analysis using either MSE or HDMSE, and finally the qualitative and quantitative analyses using ProteinLynx Global SERVER Software.
In this instance, the data were acquired in LC-HDMSE mode, an unbiased mobility assisted TOF acquisition method, switching between low and elevated energy on alternate scans, and initially correlating precursor and product ions by means of both retention and drift time alignment, as shown in Figure 2. An additional level of correlation of precursor and product ions is achieved during the searching of the processed data.3
Searching and quantifying SILAC-labeled peptides is achieved using modification (reagent) groups, as shown in Figure 3. In this particular example, only the K (lysine)-containing peptides were labeled. An HDMSE identification example is shown in Figure 4. The top left panel illustrates a labeled, charge state reduced and deisotoped peptide pair, displaying an abundance ratio of approximately 1:2, and eluting within a very small chromatographic window smaller than 0.02 minute. The two middle panels represent the complete y'' annotated DIA spectra of the light and heavy labeled variant of the peptide. Note that the ratio of the ions is preserved at the product ion level, providing an additional level of relative peptide and protein abundance validation. Details of the product ion spectra are shown in the inset.
The qualitative results are automatically tagged with the modification group information, and quantitatively analyzed by the Expression algorithm for ProteinLynx Global SERVER that offers a probable framework for the quantification of peptides and proteins.4
For example, Figure 4 shows the measured intensities and ratio values for the K (lysine)-labeled peptides that can be used for the quantification of the protein of interest. Here, the quantification algorithm calculated an in-ratio value of -0.92 ± 0.11 for Profilin-1, which was identified on the basis of a total of 10 peptides with a precursor and product ion RMS mass error of 3.2 and 4.2 ppm, respectively.
The protein quantification results are summarized in Figure 6, showing a distribution with a median and average value of 0.47 and 0.48, respectively. The variance of the ln ratio of the distribution equals 0.05. As expected, the majority of the proteins exhibit the same fold-change. Approximately 80% of the data exhibited a relative fold-change value between 0.4 and 0.6, which differs from the expected ratio of approximately 1:1. However, this data is not normalized as ordinarily done in this type of experiment. These data distributions were further supported by additional measurements not shown, comparing samples at approximate ratios of 1:5 and 1:10.
Other examples of SILAC-based investigations can be seen in published references.5,6
720004725, June 2013