• Application Note

Characterization of Inkjet Printer Cartridge Inks Using a Chemometric Approach

Characterization of Inkjet Printer Cartridge Inks Using a Chemometric Approach

  • Diana Uría
  • Paul Silcock
  • Waters Corporation
Glass with orange juice and fresh fruit on table

Abstract

This application note describes to evaluate the potential of UPLC-ToF/MS combined with a multivariate approach (MVA) to data analysis for the identification of characteristic markers for inks from different manufacturers.

Introduction

The printer cartridge market is a multi-billion dollar industry with inkjet printer cartridges being used in almost every household within the developed world.

Cartridges are generally either genuine manufacturer branded or a generic equivalent. Differences are said to be in the quality and performance of both the cartridge and the ink itself. However, generic versions can be five to six times more cost effective.

Research and development plays an important role in maintaining a competitive advantage within the printer cartridge market. Major manufacturers spend millions of dollars in research, making continual advancements in ink pigments, qualities of light fastness and water fastness, and suitability for printing on a wide variety of media. 

Therefore, companies rely on copyright and patent protection to prevent unauthorized copying and refilling of cartridges in an effort to prevent the development and sales of less expensive generic versions from competitors.

Inkjet inks are complex mixtures that require the speed, sensitivity, and resolution of UltraPerformance LC, combined with the power of exact mass ToF-MS for effective analysis. A chemometric approach to data analysis makes use of advanced statistical tools to help characterize ink samples.

This application note describes a novel UPLC-ToF MS/MS method to identify markers that can differentiate five black inkjet ink samples from top manufacturers and compare them to a generic equivalent ink sample.

Experimental

Sample Preparation

Six different inkjet cartridges were selected for this analysis. Samples were taken from five leading manufacturers and one generic equivalent. Sample preparation was carried out as follows:

  • Extract ink from cartridges
  • Dilute twice 1:100 in a mixture of 10 mM NH4HCO3/Acetonitrile (95:5)
  • Filter with 25 mm GHP Acrodisks filters
  • Inject 2 μl

LC Conditions

LC system:

Waters ACQUITY UPLC System

Column:

ACQUITY UPLC BEH C18 Column, 2.1 x 100 mm, 1.7 μm

Solvents:

A: 10 mM NH4HCO3, pH 9.8,

B: CH3CN

Flow rate:

0.6 mL/min

Temperature:

30 °C

Run time:

5.5 min

Gradient:

Gradient:

MS Conditions

MS system:

Waters LCT Premier XE Mass Spectrometer

Ionization mode:

ESI positive and negative

Capillary voltage:

3000 V (+ESI) / 2800 V (-ESI)

Cone voltage:

30 V

Aperture 1:

5 V

Source temp:

80 °C

Desolvation temp:

400 °C

Desolvation gas:

1050 L/Hr

DRE lens:

Enabled

W-optics:

Enabled

LockMass:

Leucine enkephanline (500 pg/ul)

Scan rate:

0.15 s/scan

Mass:

100-1000 m/z

Acquisition and Processing Methods

The data were acquired using Waters MassLynx Software, v. 4.1 and processed using MarkerLynx XS Application Manager. This software package is designed to interpret multivariate data, such as the complex datasets obtained from mass spectrometers.

Results and Discussion

ACQUITY UPLC enabled rapid run times while maintaining an excellent chromatographic separation of the six ink samples. The LCT Premier XE provided the excellent full-scan sensitivity that was required. Exact mass information is paramount for this type of analysis as it enables the proposal of elemental compositions, and facilitates marker characterization utilizing the database search capabilities integrated into the MarkerLynx XS Application Manager. 

Qualitatively, differences between the different inks can be observed by visual inspection of the UPLC-ToF/MS chromatograms, as shown in Figure 1. However, manual chromatogram-by-chromatogram inspection of multiple samples is very labor-intensive and can be inaccurate.

Negative ESI/ToF chromatograms for six different ink samples.
Figure 1. Negative ESI/ToF chromatograms for six different ink samples.

For this complex task, MarkerLynx XS produced a table of EMRT (exact mass, retention time) pairs associated to the intensity of the EMRT. This resultant table represents a fingerprint for each sample, which can then be used for advanced MVA analysis. These powerful statistical modelling tools, combined with a complete graphical display suite, allow researchers to visualize their data and extract more meaningful information from experimental results.

Multivariate Analysis using MarkerLynx XS

MarkerLynx XS features Partial Least Squares Discriminate Analysis (PLS-DA). This model sharpens the separation between groups and facilitates the identification of the EMRT pairs or markers responsible for differences between groups.

Through MarkerLynx XS, characteristic markers can be identified through distinct clustering of the data when analyzing in both positive and negative ESI mode.

Figure 2 shows the PLS-DA plot of negative ESI data for the six different inks. The tight clustering of each ink sample demonstrates the stability of the analytical system and allows the assessment of the significance of the grouping. In this case, the PLS-DA plot shows the similarity between ink samples 3, 4, 5, and 6 as well as the difference between ink samples 1 and 2.

PLS-DA scores plot.
Figure 2. PLS-DA scores plot showing clear grouping for the different inks.

Identification of Unknowns

The EMRT pairs, which contribute to the clustering, are easily identified on the bi-plot, as shown in Figure 3.

 Bi-plot.
Figure 3. Bi-plot of sample data from all six inks.

In order to identify these unknown markers, elemental compositions proposals were automatically generated by MarkerLynx XS. The excellent mass accuracy and isotopic pattern measurements acquired from the LCT Premier XE minimized the proposal of false candidates. MarkerLynx XS uses both local and online databases to propose chemical structures based on the suggested elemental compositions to facilitate the identification of unknowns.

Figure 4 shows the trend plot (normalized ion intensity versus sample) for several compounds present in the samples at different concentrations. By looking at the plot, it is obvious that these compounds are characteristic markers for ink Sample 2.

 Trendplot.
Figure 4. Trendplot for some of the characteristic EMRTs, or markers, for ink Brand 2.

These markers were then used in a database search based on the suggested possible elemental composition as shown in Figure 5.

Elemental composition and database search results.
Figure 5. Elemental composition and database search results for the markers identified in Figure 4.

As an example of the power of elemental composition information proposed, based on both exact mass and isotopic pattern, we identified the marker as sulforhodamine B (Figure 6), a well known component of inks.

Structure of the proposed marker sulforhodamine B.
Figure 6. Structure of the proposed marker sulforhodamine B.

Ink Cartridge Comparisons

Ink Sample 6 was from a top brand manufacturer’s cartridge and ink Sample 4 was a generic equivalent for the same printer. The data from these two samples was analyzed using Orthogonal Partial East Squarer Discriminate Analysis (OPLS-DA), a data model specialized in finding out what makes two groups different.

In this case, the EMRT differences between the genuine and the generic ink samples were observed. The scores plot in Figure 7 shows the distinctive separation for both groups.

OPLS-DA scores plot.
Figure 7. OPLS-DA scores plot showing clear grouping of the two separate ink samples.

The S-plot in Figure 8 represents the weight of each observation (EMRT) when describing the difference across groups. This is used for easy information extraction of the relevant EMRTs.

S-plot.
Figure 8. S-plot identifying eight potential markers to differentiate ink Samples 4 and 6.

The eight most relevant markers were exported to MarkerLynx XS for elemental composition proposal as shown in Figure 9.

MarkerLynx XS results.
Figure 9. MarkerLynx XS results for elemental composition proposal for the eight identified markers.

The success of a database search critically depends on the quality of data that populates it. In the case of inkjet cartridges, high quality entries are lacking as most companies will try to maintain a competitive advantage by being secretive about the components of their products.

This explains the lack of meaningful database search results in this case, in spite of the specific elemental composition information that was identified through the analysis.

Conclusion

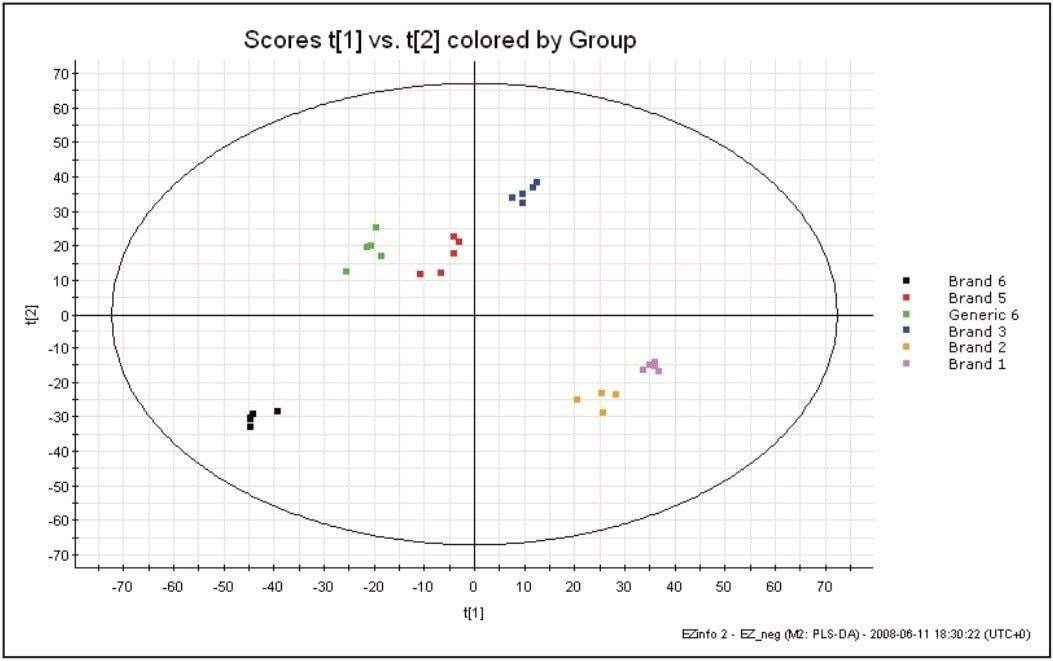
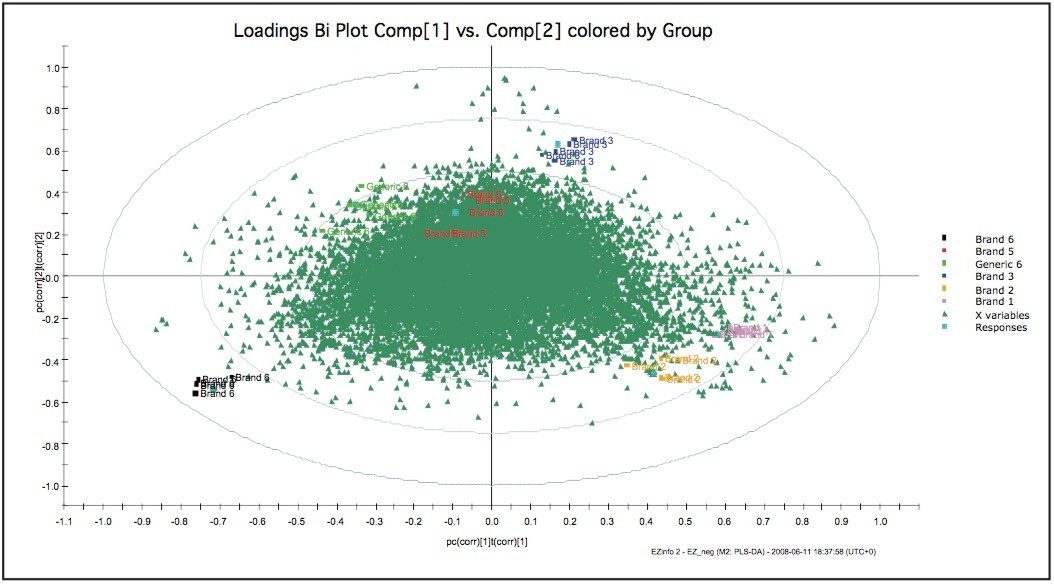
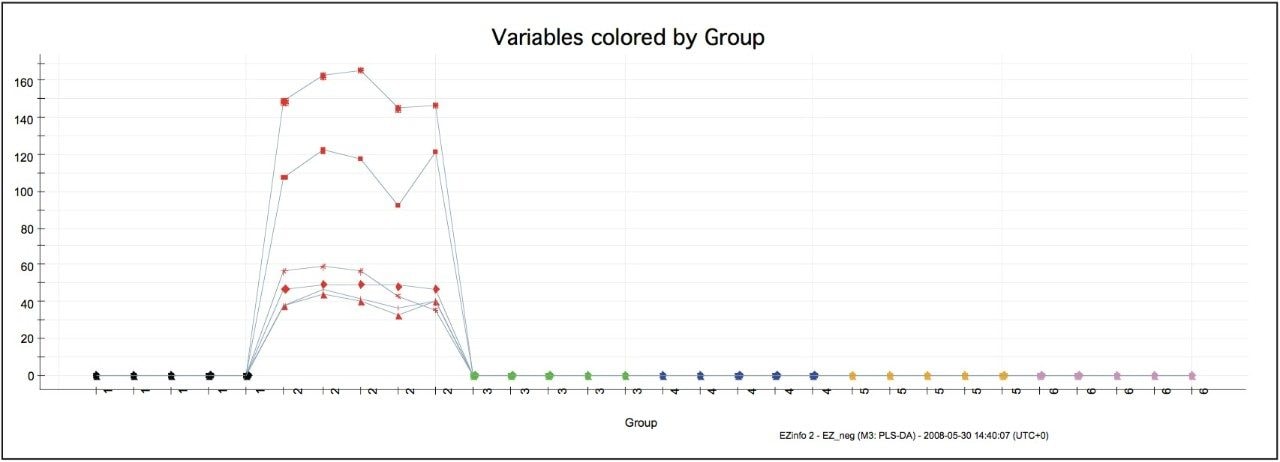
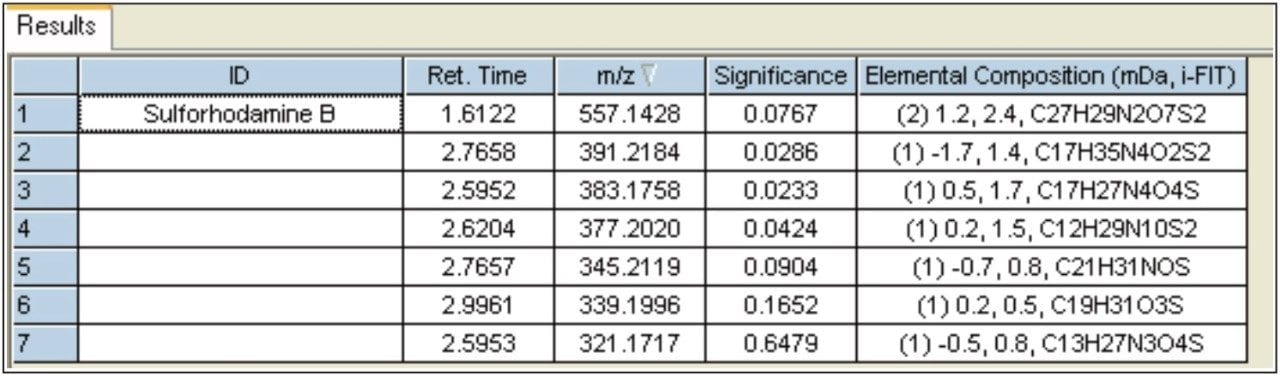
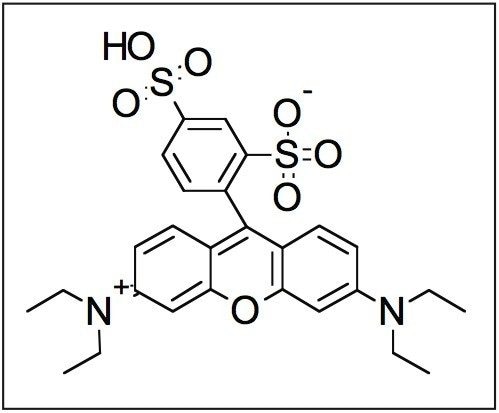
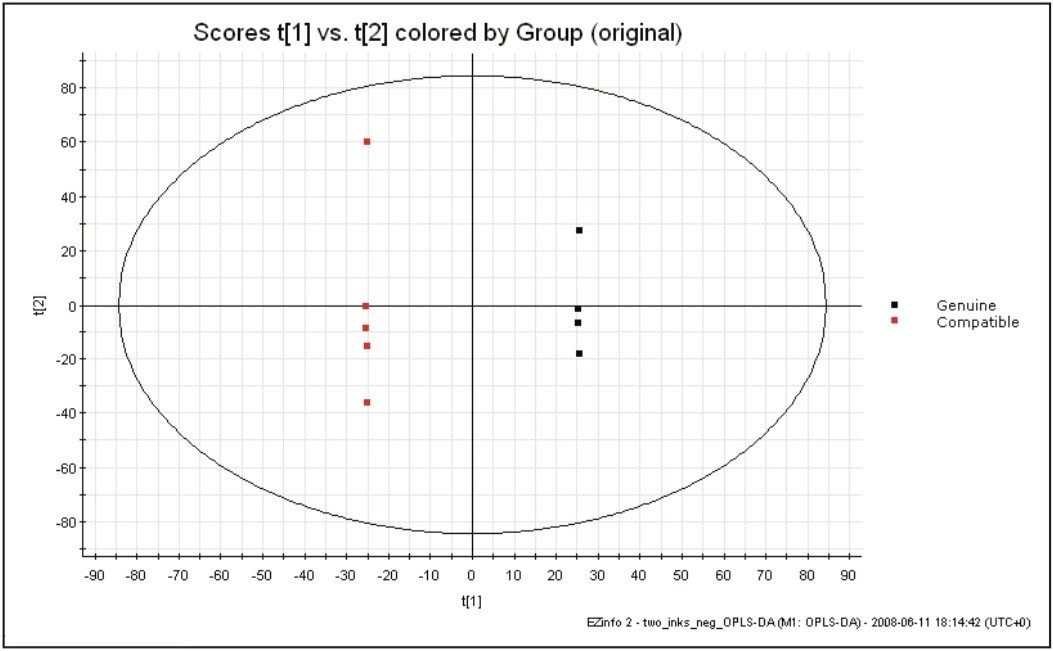
Using ACQUITY UPLC with LCT Premier XE combined with MarkerLynx XS, it was possible to differentiate between samples that look virtually identical. Using this system solution, it was possible to identify the differences between all ink samples through clear cluster grouping. The exact mass and isotopic information obtained was then used for database searching.

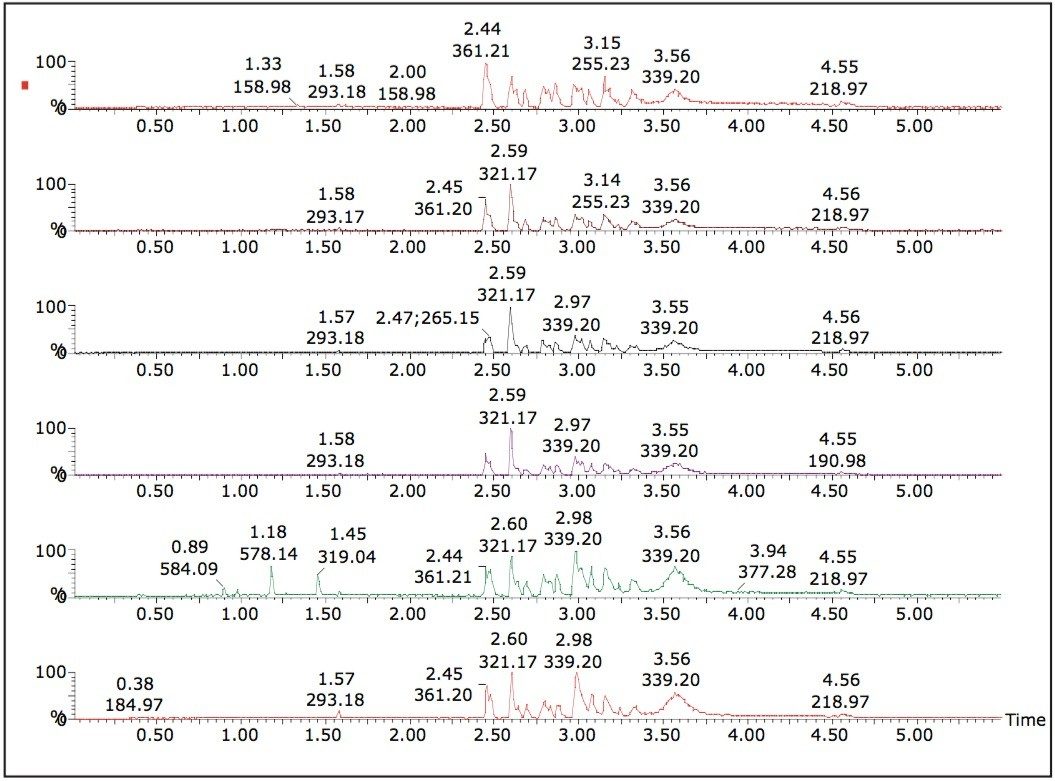
The power of UPLC enabled rapid analysis times, which allowed for many samples to be compared in a very short amount of time. Also, retention times were reproducible from sample to sample — an important factor when looking at this type of comparison technique as it is sensitive to changes between chromatograms.

The ability to quickly characterize complex ink formulas can facilitate increases in production workflow and it is a useful approach for R&D applications, as well as for evaluating competitive products. 

The Waters UPLC-ToF/MS solution provides:

  • UPLC

Rapid throughput with improved sensitivity.

Flexible analyses of multiple compounds in complex matrices.

Improved lab efficiency and excellent return on investment.

  • LCT Premier XE

Maximum full scan sensitivity.

Full UPLC compatibility.

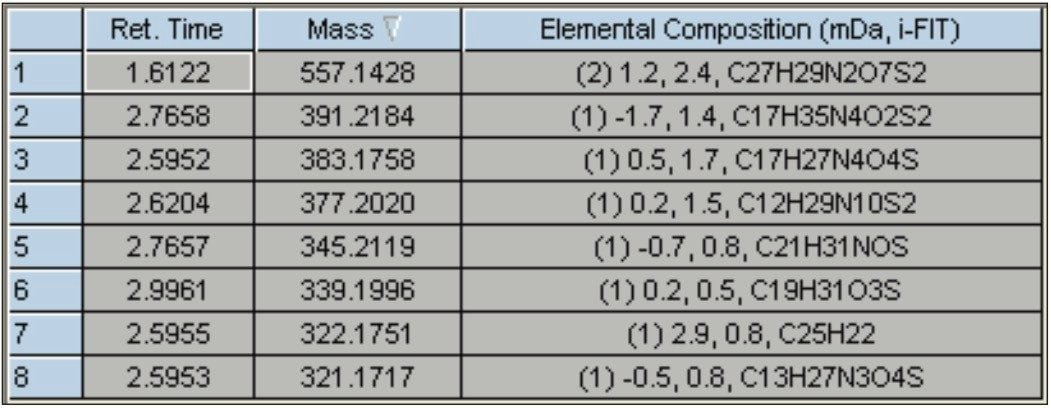
Exact mass and isotopic pattern information enabling the successful identification of unknowns.

  • MarkerLynx XS

Automatic extraction of relevant marker information. and processing of complex multivariate data from LC-MS analyses.

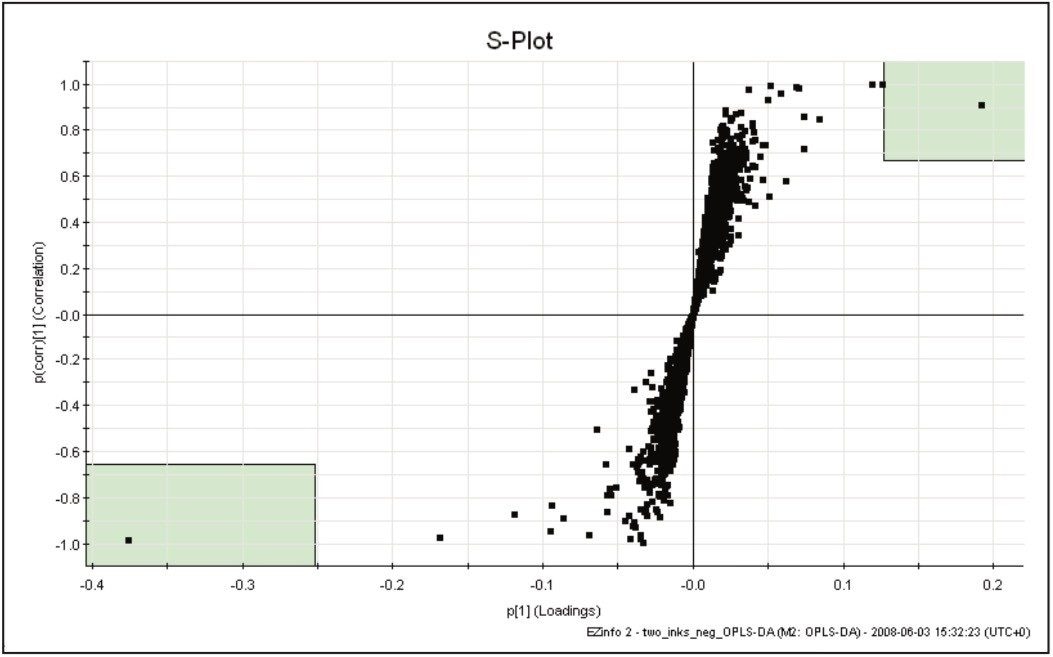
Data reduction and statistical analyses via an interactive browser to identify characteristic markers of specific compounds within similar products, which can then be used to distinguish differences in the properties of final commodities.

720002703, July 2008

Back To Top Back To Top