Virus-Like Particle Characterization by SEC-MALS Using a GTxResolve Premier SEC 1000 Å 3 µm Column
Lavelay Kizekai1, Michelle Chen2, Balasubrahmanyam Addepalli1, Matthew A. Lauber1
1 Waters Corporation United States
2 Wyatt Technology, LLC
Published on June 06, 2025
Abstract
The use of virus-like particles (VLPs) as an antigenic vaccine modality has led to a greater interest in their development over the last two decades. Three human-derived VLP vaccines to treat hepatitis B virus (HBV), human papillomavirus (HPV), and hepatitis E virus (HEV) infections have been approved and several are going through clinical trials.1 In this application note, a VLP derived from bacteriophage QBeta (Qβ) was investigated by size exclusion chromatography (SEC) coupled with multi-angle light scattering (MALS) as means for determining the purity and composition of sample components. Further, various biophysical characteristics that uniquely identify the VLP such as molecular weight, size, and component distribution were also obtained by this technique. Simultaneous collection and documentation of various critical quality attributes ensures the availability of high-quality information related to the efficacy, safety, stability, and reproducibility of batch materials during clinical trials, biological license applications, and release testing of an approved drug product.
Benefits
- The particles and pores of a GTxResolve™ Premier SEC 1000 Å 3 µm Column offer an appropriate and well-matched fractionation range for VLP analysis.
- Bridged Ethylene Polyethylene Oxide (BE-PEO) surface-modified silica provides low MALS noise suitable for high-confidence biophysical measurements.
- The particle size (3 µm) of the applied column is suitable for resolving both smaller and larger components of complex VLP.
- Low absorption surfaces provide flexible and expedient method development.
Introduction
Size-exclusion chromatography is one of the most widely used methods for analyzing biomolecules. It is well suited for the measurement of aggregates in biotherapeutics. It is an entropy-driven process that separates molecules based on their hydrodynamic size. Besides the pore size of the packing material particles, column technology and particle chemistry also play a critical role in affecting peak shape and analyte recovery during the separation process. Waters GTxResolve Premier SEC 1000 Å 3 µm Columns minimize nonideal secondary interactions through the implementation of MaxPeak™ HPS Column hardware. This feature incorporates an organosilica barrier between analytes and metal hardware to prevent nonspecific adsorption and ensure reproducible recoveries and method robustness. The particles of a GTxResolve Premier SEC 1000 Å 3 µm Column are also specially designed and bonded with a hydrophilic, bridged ethylene polyethylene oxide (BE-PEO) modified surface to minimize interactions with between analyses and the packing material.2–3 Its bridged ethylene surface crosslinks enhance its chemical resilience while ensuring low noise levels when a column is coupled to a light scattering detector. The 1000 Å pores provide access to many small and medium-sized molecules and complexes (with monomer hydrodynamic radii up to 50 nm).
VLPs are natural or artificially synthesized noninfectious nanostructures that mimic the shape of a virus. Any virus can be used to develop VLPs because of their unique self-assembly conferred by virion structural proteins, envelope proteins and/or capsid proteins. These capsid structures can be repurposed as a vector to deliver drug-related cargo into the cells or to present conformationally relevant surface antigens for immunization in the case of a vaccine. Unlike live viruses, VLPs do not contain genetic material to support their replication.4 VLPs derived from human, plant, animal or fish viruses, can also be recombinantly expressed as chimera to display foreign peptide antigens. Such an antigen display strategy was used for the treatment of hyperphosphorylated pathological tau protein. Tauopathies are a group of neurodegenerative diseases characterized by abnormal tau protein aggregation within neurons. Tau protein, when hyperphosphorylated, can disrupt normal neuron functions, which can lead to cognitive decline like Alzheimer’s disease or frontotemporal dementia.5
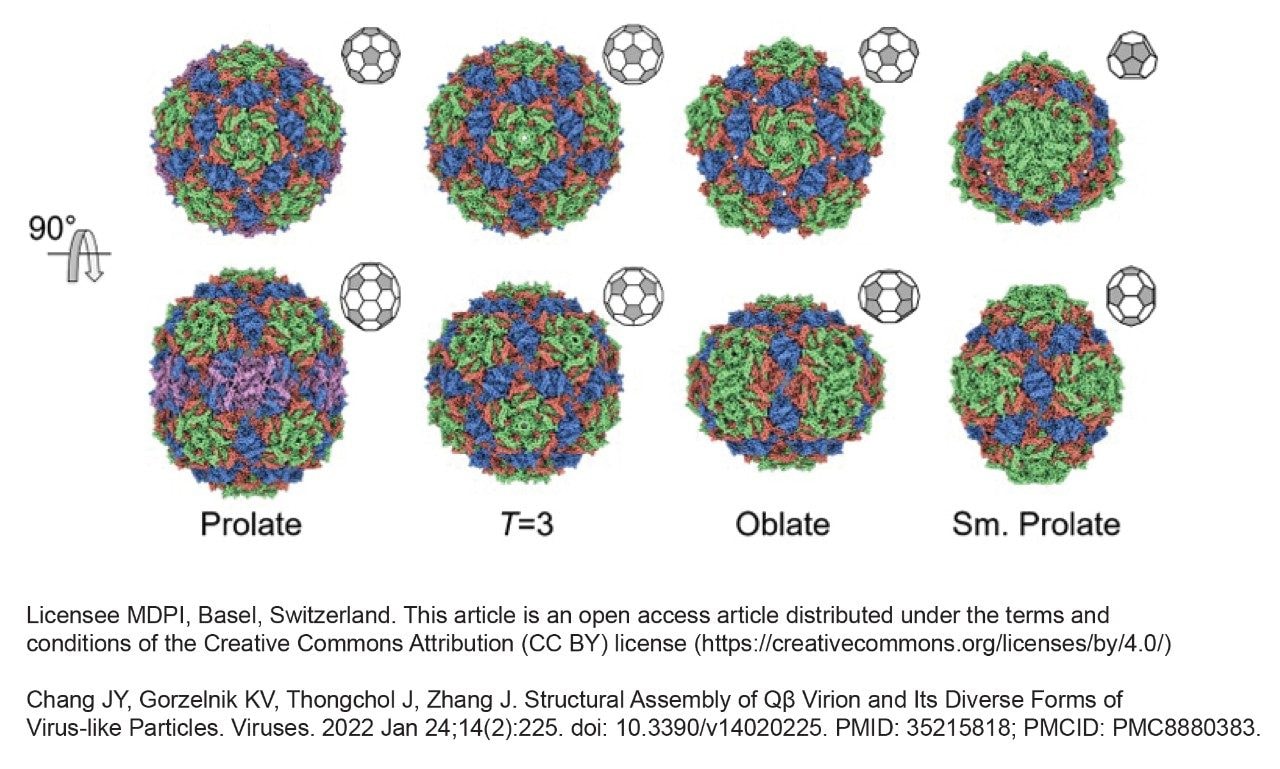
To use a VLP therapeutically, developers must carefully characterize their composition. A VLP prepared as a mimic of an icosahedral bacteriophage called Qubevirus durum (QBeta -Qβ) was analyzed in this work to investigate the utility of a GTxResolve Premier SEC 1000 Å 3 µm Column. Bacteriophage Qβ is a member of the Leviviridae family, forming capsids from 180 coat protein (CP) subunits. In wild-type form, it carries a 4.2 kilobase sense-stranded RNA genome.6 Figure 1 presents an example of Qβ structural assemblies and its diverse forms, which can present as a heterogeneous mixture. The T=3 structure of Qβ comprises 180 CPs arranged into 60 asymmetric, repeating units to form an icosahedron. The “T” represents the triangulation number, which describes the arrangement of the protein subunits in the icosahedral shell.7 T=1 is a much simpler icosahedral and less complex than T=3 forms. When the structure is elongated along the x-axis, it is considered oblate, and when elongated along the y-axis, they are referred to as prolate. The Qβ virus-like particle protein subunits are organized in complex ways, including aggregates, and they have the potential to undergo non-ideal secondary interactions with column hardware and stationary phase. Accurate biophysical and compositional analysis of a VLP is critical to understanding capsid structure/function relationships and defining the quality of a potential therapeutic candidate. This application note evaluates the resolving power of the GTxResolve Premier SEC 1000 Å 3 µm Column vs another commercially available SEC 1000 Å 2.7 µm Column using a complex Qβ VLP sample and MALS hyphenated analyses.
Experimental
The mobile phase for SEC separations was either 1x or 2x strength Dulbecco’s phosphate buffer saline [1x = 10 mM phosphate, 138 mM NaCl, 2.7 mM KCl, pH 7.4 (1x dPBS)] [2x = 20 mM phosphate, 276 mM NaCl, 5.4 mM KCl, pH 7.4 (2x dPBS)]. Mobile phases were filtered through a 0.1 µm membrane before use.
Bacteriophage Qβ VLPs were purchased from Fina BioSolutions, and a 2.0 mg/mL concentration was prepared.
Bovine thyroglobulin (PTG) (Sigma, p/n: T1001–100mg) was prepared at a 5.0 mg/mL concentration and filtered to 0.1 µm.
LC Conditions
|
LC system: |
Arc™ Premier System with Quaternary Solvent Manager (QSM) and Flow Through Needle Sample Manager (SM-FTN) |
|
Vials: |
Max Recovery Vials and Caps (Waters p/n: 186000327C) and Waters 300 µL polypropylene screw neck vial (Waters p/n: 186004112) |
|
Columns: |
GTxResolve Premier SEC 1000 Å, 3 µm, 4.6 x 300 mm Column (Waters p/n: 186010736) Competitor A SEC 1000 Å, 2.7 µm, 4.6 x 300 mm Column |
|
Column temperature: |
30 °C |
|
Sample temperature: |
6 °C |
|
Sample manager washes: |
18.2 MΩ water |
|
Seal wash: |
10% HPLC grade methanol / 90% 18.2 MΩ water (v/v) |
|
Samples and Injection volume: |
Bovine thyroglobulin (BTg): 50 µL Qβ 2 mg/mL: 20 µL |
|
Flow rate: |
0.40 mL/min; 0.1 mL/min |
|
Mobile phase A: |
10 mM phosphate, 138 mM NaCl, 2.7 mM KCl, pH 7.4 (1x dPBS) |
|
Gradient: |
Isocratic |
|
LC system control: |
Empower™ CDS Version 3.8.0 |
Detector Conditions
|
Multi-angle light scattering (MALS): |
DAWN™ Detector with a WyattQELS™ DLS Module. |
|
UV/Vis: |
Arc Premier 2489 UV/Vis Detector Channel 1: 280 nm; Channel 2: 260 nm |
|
Refractive index (dRI): |
Optilab™ dRI Detector |
|
Data acquisition and analysis: |
ASTRA™ 8 Software |
Results and Discussion
Performance of a GTxResolve Premier SEC 1000 Å 3 µm Column by UV Analysis
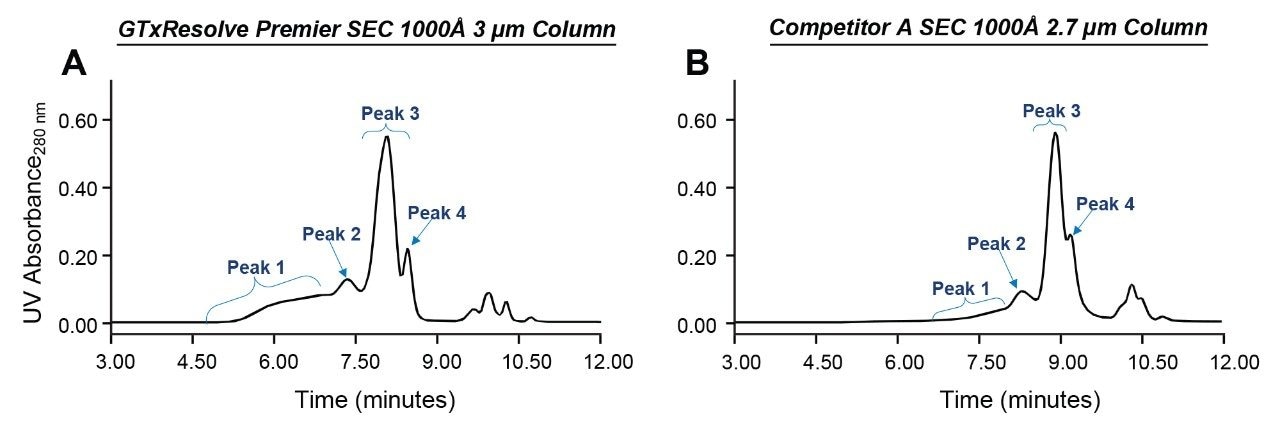
Analyses of the Qβ VLP sample were performed using a Waters GTxResolve Premier SEC 1000 Å 3 µm Column as well as a commercially available SEC 1000 Å 2.7 µm Competitor A column. Identical 4.6 x 300 mm configurations were applied along with 1x dPBS mobile phases and a 0.4 mL/min flow rate. UV chromatograms resulting from these runs are shown in Figures 2a and 2b. Both these columns contain particles with a nominal pore size of 1000 Å, which is adequate for identifying monomer and potential aggregate species of the Qβ VLP sample components. The Qβ capsid comprises 180 copies of coat proteins, which self-assemble into 28 nm diameter icosahedral particles.8 Therefore, this Qβ VLP can access most of the pore volume of the 1000 Å particles. Overall, the Qβ VLP sample presents a very heterogeneous profile. Figure 1 indicates the presence of four distinct peaks based on the elution pattern. The early eluting Peak 1 is likely to be the trimer and other coeluting higher-order aggregates; Peak 2 is putatively assigned to be the dimer formed by aggregation of the isoforms in Peak 3; Peak 3 is the monomer which is a prominent peak, and the closely eluting peak 4 is likely to be a significantly smaller component. Although the peak is not fully resolved in this example analysis, the observed Peak 3 may consist of icosahedral T=3 VLP capsid comprising 180 coat protein subunits (CPs), an oblate T=3 with 150 CPs, and small to large prolate forms with 132 and 210 CPs, respectively (as has been previously reported)8. Peak 4 would likely be the T=1 form with 60 CPs8. The following SEC-MALS analysis lends support to these putative assignments.

Biophysical Characterization of VLP Morphology By SEC-MALS
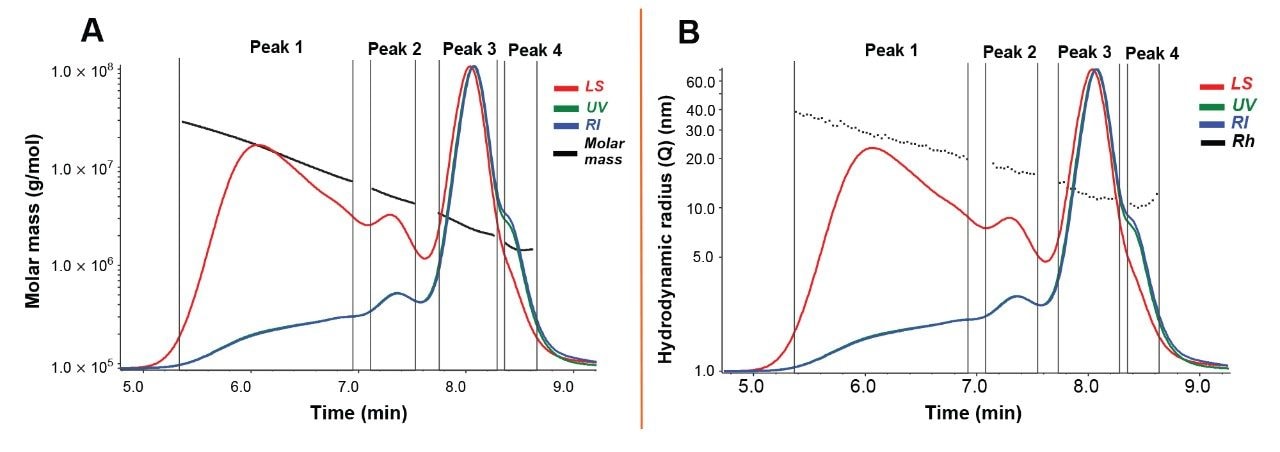
SEC-MALS is a technique that can elucidate biophysical information of macromolecules such as absolute molar mass and size in solution. Molar mass was determined using a UV concentration detector and the intensity of scattered light at various angles by the LS detector. Further, the radius of gyration was determined from the angular dependence of the scattered light and the hydrodynamic radius was obtained from the Brownian motion of the analyte, which is measured by the fluctuations in light scattering intensity due to the diffusion of molecules. The Quasi-Elastic Light Scattering (QELS) module is used here to determine the hydrodynamic radius.10 Bovine thyroglobulin was used to optimize the system parameters, including normalization, band broadening, and alignment (results not shown here) before evaluating the Qβ VLP on the GTxResolve Column. MALS-UV-RI detectors with embedded QELS Module were employed to determine the molar mass and hydrodynamic size. Data traces derived from each detector and corresponding molar mass, hydrodynamic radius and radius of gyration calculations are provided in Figures 3A–3B and Table 2.
Resolution Affects Quantitative Measurements
Table 1 shows the chromatographic data derived from the Figure 2a and 2b chromatograms. The GTxResolve Premier SEC 1000 Å 3 µm Column resulted in earlier elution times for peaks 1, 2, 3, and 4 compared to the Competitor A SEC 1000 Å 2.7 µm Column. This indicates that the nominal pore diameters of the two columns might differ slightly. Additionally, the particle packing efficiencies vary. More significantly, relative peak areas for Peak 1 were determined to be 20.7% and 8.2%, respectively, for these two columns, indicating significant differences in the recovery of aggregates. Higher recoveries from the GTxResolve Column can be attributed to lower levels of secondary interactions, making it possible to separate and elute aggregates with a simple, 1x strength PBS mobile phase.
Other aspects of the SEC profiles examined included the Peak 3 profiles and the resolution between Peak 3 and Peak 4. The GTxResolve Column showed a slightly broader Peak 3 with an area of 54.3%, while the Competitor A column exhibited a sharper Peak 3 with an area of 58.5%. The resolution, measured as the peak-to-valley ratio (p/v), was determined between Peak 3 and Peak 4. The GTxResolve Column provided higher resolution between these peaks compared to the Competitor A column. The poor resolution observed with the Competitor A column likely affects the quantitative measurement of this VLP isoform. We then investigated the sample using MALS and additional slow flow, high-resolution separations (see below).

Molar Mass and Polydispersity Measurements
High-quality SEC separations of sample components based on their solution size allow accurate quantitative biophysical measurements by concentration and light scattering detectors. Figures 3A and 3B show SEC-MALS chromatogram traces of all three detectors (UV, MALS, dRI) of the Qβ sample, highlighting the segments of four chromatographic regions across the profile. The black trace across the defined regions of Peaks 1 to 4 indicates the molar mass (Figure 3A) and hydrodynamic radius (Figure 3B) values across the peaks. Each measurement represents a 0.5-second collection interval across the region. The collection interval is how often the ASTRA software collects the light-scattering data. The continuous decrease observed in the black trace indicates a polydisperse nature, likely due to the variations in different oligomeric conformations and molecular weight distribution. Figure 3A highlights the molecular weight distribution where molar mass values decrease across each region as well as on the individual peak due to the heterogeneity and likely coelution of sample components. If the components in a peak are monodisperse, the measurement trace would have been horizontal across the peak, but the trace exhibited a downward trend indicating heterogeneity of components within the peak. Although the average molar mass can still be computed, it is ideal to provide the range of molar mass values from the start of the peak to the end of the peak as shown in Table 2. Peak 1 exhibited a molar mass range of 28.9 to 7.1 MDa, Peak 2 with 6.0 to 4.3 MDa, Peak 3 with 3.4 to 2.0 MDa, and Peak 4 with 1.7 to 1.4 MDa values. Similarly, the radii information for each of the peaks 1–4 are shown in Table 2.
Data Analysis and Interpretations
Examination of these physicochemical measurements, including average mass values, indicate that the Peak 1 and Peak 2 components eluting between 5.4 to 7.6 minutes are likely to be aggregated forms of Peak 3. While the components of Peak 1 can be classified as higher-order aggregates, the Peak 2 components are highly likely to correspond to dimeric species with some coalition of T=4 species (5 MDa). Meanwhile, Peak 3 showed a molar mass of 2.5 MDa. The capsid proteins of this bacteriophage are assembled into an icosahedral T=3 capsid with 180 protein subunits.6 Peak 3 with the highest signal abundance would likely be this form of capsid. Incidentally, the molar mass distribution ranged from 3.4 to 2.0 MDa across Peak 3 supporting this assignment. Such a distribution of masses is likely due to the additional presence of oblate T=3 form, small and large prolate T=3 forms with 150, 132, 180 and 210 capsid protein subunits, respectively. The Peak 4 that was partially resolved at 8.4 min can be attributed to the T=1 oblate and T=1 prolate forms of the Qβ VLP. The T=1 form was previously reported to have 60 CPs with molar mass of ~1.0 MDa by orthogonal charge detection mass spectrometry (CD-MS) measurements.8 It can be assumed that the measured molar mass between 1.4 and 1.7 MDa was slightly overestimated due to its coelution with Peak 3.
Particle Morphology
The particle morphology of VLPs is typically examined with transmission electron microscopy (TEM), cryo-electron microscopy (cryo-EM), and scanning electron microscopy (SEM). By performing SEC-MALS analysis using the GTxResolve SEC 1000 Å Column, information related to size and morphology of the particle was easily documented along with the molar mass data. Figure 3B shows the hydrodynamic radius (Rh) and radius of gyration (Rg) for the components detected within the Qβ VLP sample. The Rg/Rh ratio typically gives insight into the sample's morphology and was calculated to be 0.97 for Peak 1, 0.94 for Peak 2, and 0.74 for Peak 3. These values indicate that the Peak 1 and 2 components exhibit extended forms compared to the more globular form exhibited by Peak 3 components. This assignment is consistent with the predominately icosahedral forms of Qβ. It should be noted that the accuracy of Rg measurements diminishes when analyses are less than 10 nm in size. Because of the low accuracy of the Rg value (10.4 nm), the morphology of Peak 1 components cannot be predicted.
Confirmation of Multiple Components in Peak 3
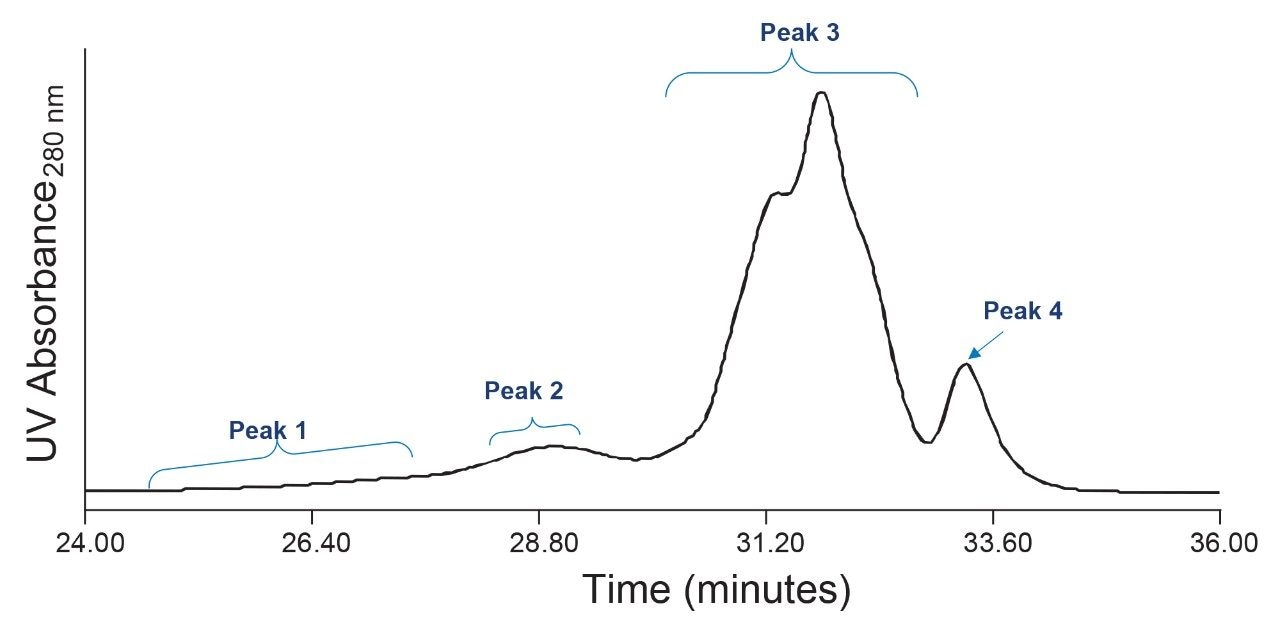
In a final experiment, we reduced the flow rate from 0.4 mL/min (employed in Figures 2 and 3) to 0.1 mL/min to improve the resolution of components eluding from the GTxResolve SEC 1000 Å 3 µm, 4.6 x 300 mm Column. Lowering the flow rate allows for better separation of components within the sample. Here, we demonstrate that the lower flow rate provided more detailed information about the presence of multiple capsid forms within chromatographic Peak 3. Figure 4 depicts the partial resolution achieved for Peak 3 components. This demonstration of partial resolution supports the idea that the Qβ capsid is heterogeneous in nature. In other words, the T=3 form, and its close-in-size isoforms are not uniform and consists of different sub-populations. The reduction in flow rate also improved the separation between Peak 3 and Peak 4 compared to higher flow rate runs (Figures 2 and 3) where these two peaks were largely unresolved. Better separations achieved with the lower flow rate can enhance the accuracy and reliability of biophysical measurements of the Peak 4 component (the T=1 form).
Conclusion
The GTxResolve SEC 1000 Å 3 µm Column exhibited better sizing of the highly heterogeneous bacteriophage Qβ (Qubevirus durum) VLP sample components compared to the Competitor A SEC column. The GTxResolve SEC Column provided higher recoveries of high molecular weight species (aggregates) and improved the resolution of multiple sample components. This improved performance can be attributed to lower levels of secondary interactions that enable more accurate and more precise measurements. Further improvements in resolution were enabled by the lowering the flow rate, which suggests there is sometimes room for method optimization depending on the complexity of a sample. The improved separations achieved with the GTxResolve SEC 1000 Å 3 µm Column enabled accurate documentation of VLP biophysical measurements including the polydispersity of the T=3 capsid and several close-in-size isoforms. Accurate and high quality biophysical measurements can enable faster decision making, which is essential to confirming the suitability of target VLP for antigenic drug development and deployment.
References
- Kheirvari, M.; Liu, H.; Tumban, E. Virus-like Particle Vaccines and Platforms for Vaccine Development. Viruses 2023. 15, 1109. https://doi.org/10.3390/v15051109.
- Camacho, K. J., Tchoul, O., Xu, Y., Finny, A., Kizekai, L., Byrd, S., Addepalli, B., Xu, M., Lauber, M., & McLaughlin, J. Bridged Ethylene Polyethylene Oxide Surfaces to Improve Packing Materials for Widepore Size Exclusion Chromatography. Journal of Separation Science, 2024. 47(20). https://doi.org/10.1002/jssc.202400541.
- Finny, A. S., Kizekai, L., Camacho, K., T'choul, O., McLaughlin, J., Byrd, S., Xu, M., Addepalli, B., & Lauber, M. A. Enhancing Size-Exclusion Chromatography of Large Biomolecular Analytes with Rigorously Designed GTxResolve™ Premier SEC 1000 Å 3 µm Columns. Waters Corporation. 2024.
- He, J.; Yu, L.; Lin, X.; Liu, X.; Zhang, Y.; Yang, F.; Deng, W. Virus-like Particles as Nanocarriers for Intracellular Delivery of Biomolecules and Compounds. Viruses 2022. 14, 1905. https://doi.org/10.3390/v14091905.
- Maphis, N. M., Peabody, J., Crossey, E., Jiang, S., Jamaleddin Ahmad, F. A., Alvarez, M., Mansoor, S. K., Yaney, A., Yang, Y., Sillerud, L. O., Wilson, C. M., Selwyn, R., Brigman, J. L., Cannon, J. L., Peabody, D. S., Chackerian, B., & Bhaskar, K. Qß Virus-Like Particle-Based Vaccine Induces Robust Immunity and Protects Against Tauopathy. npj Vaccines. 2029. https://doi.org/10.1038/s41541-019-0118-4.
- Chang, J.-Y.; Gorzelnik, K.V.; Thongchol, J.; Zhang, J. Structural Assembly of Qβ Virion and Its Diverse Forms of Virus-like Particles. Viruses 2022. 14, 225. https://doi.org/10.3390/v14020225.
- S. Sungsuwan, X. Huang, X. Wu. Chapter Thirteen-Evaluation of Virus-Like Particle-Based Tumor-Associated Carbohydrate Immunogen in a Mouse Tumor Model 2017. https://doi.org/10.1016/bs.mie.2017.06.030.
- Raj A. Parikh, Lohra M. Miller, Benjamin E. Draper, Lavelay Kizekai, Balasubrahmanyam Addepalli, Michelle Chen, Matthew A. Lauber, and Martin F. Jarrold. "Coupling of Size Exclusion Chromatography to High Throughput Charge Detection Mass Spectrometry for the Analysis of Large Proteins and Virus-like Particles." Analytical Chemistry, 2025. https://doi.org/10.1021/acs.analchem.4c06084.
- Singleton, R.L.; Sanders, C.A.; Jones, K.; Thorington, B.; Egbo, T.; Coats, M.T.; Waffo, A.B. Function of the RNA Coliphage Qβ Proteins in Medical In Vitro Evolution. Methods Protoc. 2018. 1, 18. https://doi.org/10.3390/mps1020018.
- Wyatt, P. J. Light Scattering and the Absolute Characterization of Macromolecules. Anal. Chim. Acta 1993. 272, 1–40. DOI: 10.1016/0003-2670(93)80373-S.
- Zeltins, A. (2013). Construction and Characterization of Virus-Like Particles: A Review. Molecular Biotechnology, 53, 92–107. DOI: 10.1007/s12033-012-9598-4.
- Mejía-Méndez, J.L. ; Vazquez-Duhalt, R.; Hernández, L.R. ; Sánchez-Arreola, E.; Bach, H. Virus-like Particles: Fundamentals and Biomedical Applications. Int. J. Mol. Sci. 2022. 23, 8579. https://doi.org/10.3390/ijms23158579.
Waters, GTxResolve, MaxPeak, Arc, Empower, DAWN, WyattQELS, Optilab, and ASTRA are trademarks of Waters Technologies Corporation.
720008761, April 2025