Nontarget Screening Workflow (NTS) for the Analysis of Per and Polyfluoroalkyl Substances (PFAS) in Animal Products Using Xevo™ G3 QTof
Abstract
The rise of concern about Per and Polyfluoroalkyl Substances (PFAS) started in the early 2000 after the detection of organic fluorochemicals in human serum and in the tissue of wildlife animals.1–3 Multiple routes of human exposure to PFAS have been identified, such as contaminated food. In a nine-year study, the European Food Safety Authority (EFSA) reported that the main contaminated food sources are fish and eggs.4 Since, guidelines for PFAS testing in different matrices have been published using liquid chromatography coupled to mass spectrometry (LC-MS).4–5 While these guidelines include both tandem and high-resolution mass spectrometers, the typical methodology is tandem mass spectrometry for its high selectivity and sensitivity. Nevertheless, targeted approaches using tandem quadrupoles remain limited to a certain number of compounds per method.6 The Xevo G3 QTof offers both the sensitivity and resolution for comprehensive nontarget screening (NTS) and discovery workflows within a data independent acquisition experiment.7
Based on the EURL POPs Guidance Document on Analytical Parameters for the Determination of Per and Polyfluoroalkyl Substances (PFAS) in Food and Feed, PFAS were extracted from fish reference material.8 The extracted samples were analyzed using the Xevo G3 QTof followed by NTS and quantification. The acquisition and data processing were performed using the waters_connect™ platform. Four compounds were identified with high confidence and quantified in the fish reference material. These were PFOA, PFNA, PFOS (linear and branched), and PFHxS (linear and branched). The identified and measured quantities were in agreement with the reported values by Fapas© (UK). The study demonstrates the applicability of using the Xevo G3 QTof for identification and quantification of PFAS analysis in food matrix at levels that meet the EU requirements.
Benefits
- Nontarget screening (NTS) workflow for PFAS analysis using retention time and mass defect
- PFAS identification and quantification in fish reference material with high sensitivity at low ng/Kg concentrations using HRMS meeting EURL POPS Guidance on Method Performance
- Analysis beyond targeted and regulated PFAS compounds where no standards are available for de novo identification
Introduction
Whilst the presence of fluorinated compounds in human serum was first reported as early as 1968 by D. Travis, per and polyfluoroalkyl substances (PFAS) started becoming a real concern in early 2000s when two research groups detected organic fluorochemicals in human serum and in wildlife animals.1–2,9 These studies raised the alarm about the impact of bioaccumulation of PFAS on human health and their widespread presence in the environment.1–2 High levels of exposure to PFAS can impact lipid metabolism, reproduction, and development.3,10 The direct link between the toxicity of perfluorooctanoic acid (PFOA) and perfluorooctane sulfonic acid (PFOS) on animals and humans are the most widely proven.11
Different exposure routes were proposed, these include the intake of contaminated food, environmental exposure and to a lesser extent from various consumer PFAS-containing products such as house dust or fire-resistant carpets.12–13 The main source of human exposure remains through food intake. Fish and eggs have the highest PFAS contamination levels compared to other food categories.4,14
To monitor PFAS contamination in food, regulatory bodies such as the American Environmental Protection Agency (EPA) and the Reference Laboratory for Halogenated Persistent Organic Pollutants in Feed and Food in Europe (EURL POP) have a set of regulations and guidelines for the analysis of PFAS in different matrices.5,15 The recommended methods comprehend a solid phase extraction step prior to sample analysis by LC-MS and monitoring up to 45 compounds.5,15 With the constant rise of the number of regulated compounds and the need to monitor non-regulated PFAS, HRMS is ideal as it offers both a quantitative and qualitative overview of the samples.
In this study a nontarget screening (NTS) workflow for the identification and quantification of PFAS was applied on fish reference material (Fapas®, UK) using the EURL POP guidelines for sample preparation and identification. The extracts were analyzed using the ACQUITY™ Premier System coupled to the Xevo G3 QTof. The NTS workflow allowed the identification of four compounds: PFHxS, PFNA, PFOA ,and PFOS. Calibration standards between 0.005 µg/Kg and 125 µg/Kg (equivalent to 5 ng/L and 25,000 ng/L, respectively) were analyzed for quantification.
Here we demonstrate that the Xevo G3 QTof is an ideal tool for NTS screening and quantification of PFAS in food matrix. The identification and quantification were performed following the EURL POP guidelines. In addition, the data generated can be mined retrospectively for de novo identification of PFAS related compounds using UNIFI™’s discovery workflow.
Experimental
Sample Preparation
Homogenized blank white fish, fish QC Material (T0696QC) and fish reference material (TBK011RM) were purchased from Fapas® (UK). Samples were kept at -20 °C and thawed overnight at 4 °C prior to extraction. All standards were purchased from Wellington Laboratories. The method contained a total of 30 PFAS including the following compounds: Carboxylates: C4–C14; Sulfonates: C4–C10; Ethers: GenX, ADONA, 9Cl-PF3ONS, 11Cl-PF3OUdS; Precursors: FBSA, FHxSA, FOSA, NMeFOSAA, NEtFOSAA, 4:2 FTS, 6:2 FTS, 8:2 FTS.
Sample preparation was performed as previously described in application note.16 In the absence of a PFAS-free fish, a solvent calibration curve in the range of 0.025–125 µg/Kg (equivalent to 5–25,000 ng/L) was used for sample analysis.
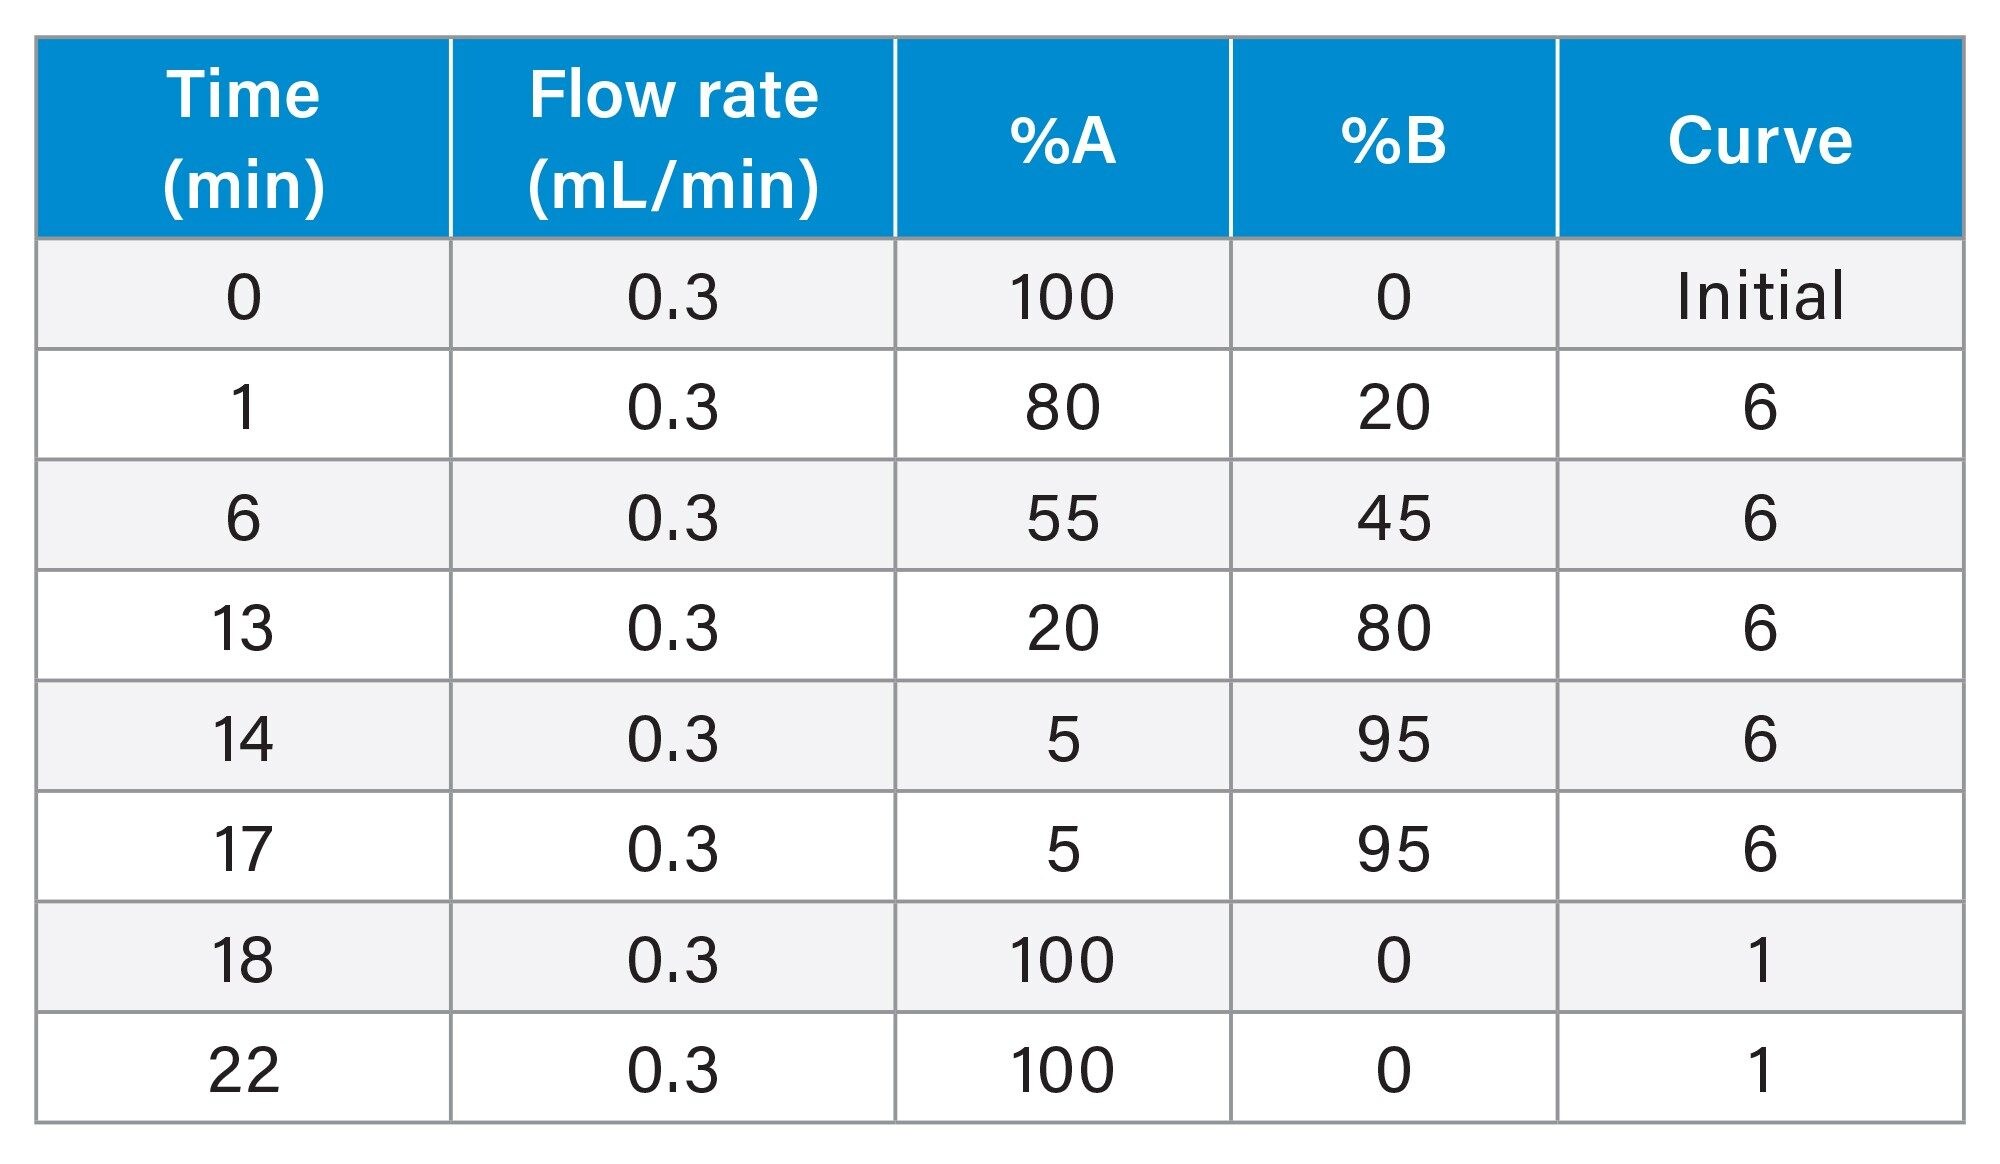
LC Conditions
|
LC system: |
Waters™ ACQUITY Premier System modified with PFAS Kit (p/n: 205000588 and 205000589) |
|
Vials: |
Polypropylene autosampler vial (p/n: 186005219) with pre-slit cap (p/n: 186000305) |
|
Analytical column: |
ACQUITY Premier BEH™ C18, 1.7 µm, 2.1 x 100 mm, 90 Å Column (p/n:186009453) |
|
Isolator column: |
Atlantis™ Premier BEH C18 AX Isolator Column, 2.1 x 50 mm, 5 µm (p/n: 186009452) |
|
Column temperature: |
35 °C |
|
Sample temperature: |
6 °C |
|
Injection volume: |
10 µL |
|
Flow rate: |
0.3 mL/min |
|
Mobile phase A: |
95:5 water:methanol with 2 mM ammonium acetate |
|
Mobile phase B: |
100% methanol with 2 mM ammonium acetate |
Gradient Table
MS Conditions
|
MS system: |
Xevo G3 QTof |
|
Ionization mode: |
ESI- |
|
Mass range: |
m/z 50–1200 |
|
Acquisition rate: |
4 spectra per second (4 Hz) |
|
Lock mass: |
Leucine enkephalin (m/z 554.2620) |
|
Acquisition mode: |
MSE a data independent acquisition method |
Source Conditions
|
Capillary voltage: |
0.5 kV |
|
Cone voltage: |
10 V |
|
Source temperature: |
100 °C |
|
Desolvation temperature: |
250 °C |
|
Cone gas: |
100 L/h |
|
Desolvation gas: |
600 L/h |
|
Source offset: |
30 V |
Collision Energy
|
Low collision energy: |
4 V |
|
High collision energy: |
ramp 20–70 V |
Transmission Tune Settings
|
StepWave RF: |
100 V |
|
Body gradient: |
5 V |
Software Tools
Data acquisition and processing were performed using the waters_connect software platform and UNIFI application.
Results and Discussion
Data generated by MSE acquisition mode was processed using the UNIFI application in waters_connect platform. After peak picking and isotopic clustering steps, a list of all the detected components, with retention time and intensity was generated for each injection (Figure 1 A, Data processing). The components are screened using the Waters PFAS library, other opensource libraries can be used depending on the users requirements.17–19 The identification is based on accurate mass and fragmentation, with putative identifications accepted where the mass measurement accuracy for the precursor ion was ≤ 3 ppm. Knowing that the number of listed PFAS compounds currently exceeds 15,000 compounds, to increase the identification confidence and remove false positives, multiple data filtering steps were applied on the component list.18 UNIFI application offers flexible NTS workflows with different user defined filtering steps (Figure 1 B, Data filtering). These user defined steps facilitate the visualization of the most relevant components to the study.
Here, a PFAS specific workflow was applied for nontarget screening (NTS) of fish reference material extracts. A step-by-step scheme of this workflow is depicted in figure 1. The workflow can be divided in two parts, data processing (Figure 1 A) and data filtering (Figure 1 B). Once proceeded data filtering (Figure 1B) displays a list of the components that fit the user defined criteria. For example, a filter for viewing components eluting between three to five minutes, with m/z above 500 Da.
To demonstrate the power of each of the steps in the workflow, the number of components retained after applying each step is depicted below its corresponding step. These numbers correspond to fish sample TKB011RM, they are used here as an example.
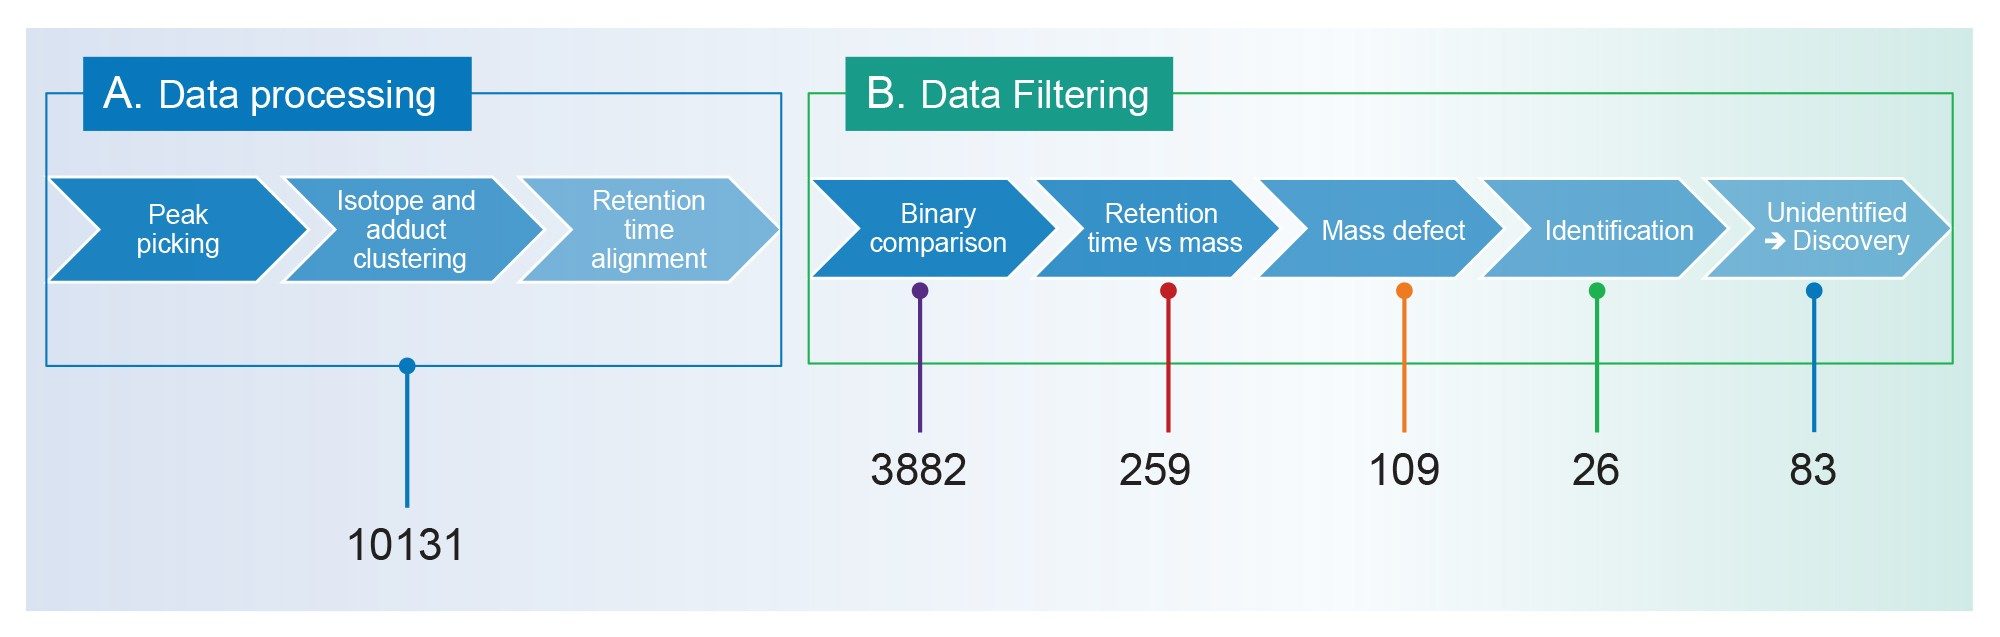
The NTS workflow in the UNIFI application was defined specifically for PFAS analysis. After a peak picking step and isotopic grouping, a list of the detected components for each run was obtained. In the selected example, TKB011RM, 10,131 components were detected (Figure 1 A), which would include components related to the matrices, background components as well as PFAS. The first step in the workflow is a comparison between the samples and a blank. In this case, an extraction solvent blank was prepared in parallel to the sample. Only unique components or components with more than or equal to 15-fold increase response compared to solvent blanks were retained. This cutoff value was chosen to remove noise components coming from the extraction process and can be modified to be more or less stringent as desired. Comparing the intensities of detected components with a sample blank helped reducing the candidate list from 10,131 components to 3882 components in fish sample TKB011RM. As certain classes of PFAS can undergo in-source fragmentation and homologue PFAS series have predictable elution order, a retention time/mass filter was applied.20 This retention time/mass filter defines the regions in the chromatography where a PFAS homologues are expected to elute and allows the removal of potential in-source fragmentation ions from the list of candidates. By applying this filter, the component list dropped substantially to 259 components in TKB011RM sample (Figure 1 B). A mass defect filter was then used to distinguish PFAS from non-PFAS related compounds. This filter reduced the list of components to 109 potential candidates. Noteworthy, applying the mass defect filter alone without the retention time filter is not as efficient as applying both filters sequentially. Indeed, when the mass defect filter applied on the component list before or after the binary comparison filter, the number of components is reduced to 4854 or 952 components, respectively (data not shown). Finally, from the 109 components, 26 were identified using the Waters PFAS library.17
In both fish reference materials, besides the labelled extraction standards, six PFAS compounds were identified: PFHxS (linear and branched), PFOA, PFOS (linear and branched), PFNA, PFDA, and PFUnDA. Four of which have a level 1a identification and two are at level 3d, the definition of the levels of identification are based on Charbonnet el al.21 The remaining 83 unidentified PFAS related components are then processed using the discovery workflow in the UNIFI application where molecular formulae can be generated, followed by de novo identification.
Each of the filtering steps described are part of the user defined workflow. These steps aiding visualizing data without altering the original list of components. Herein, the power of all these steps in reducing noise, fragments, system, and sample preparation contaminants is demonstrated. The same approach is applied to the different reference fish material and to all replicates. The number of components observed at each of the steps in the different studied samples and replicates was in the same order of magnitude as the ones reported on Figure 1.
Table 1 summarizes the identified compounds in both fish reference material: T0696QC and TKB011RM. The table contains the mass accuracy for the precursor ions, the identifier fragment ion, fragment ion mass accuracy and the level of confidence according to Charbonnet et.al.21
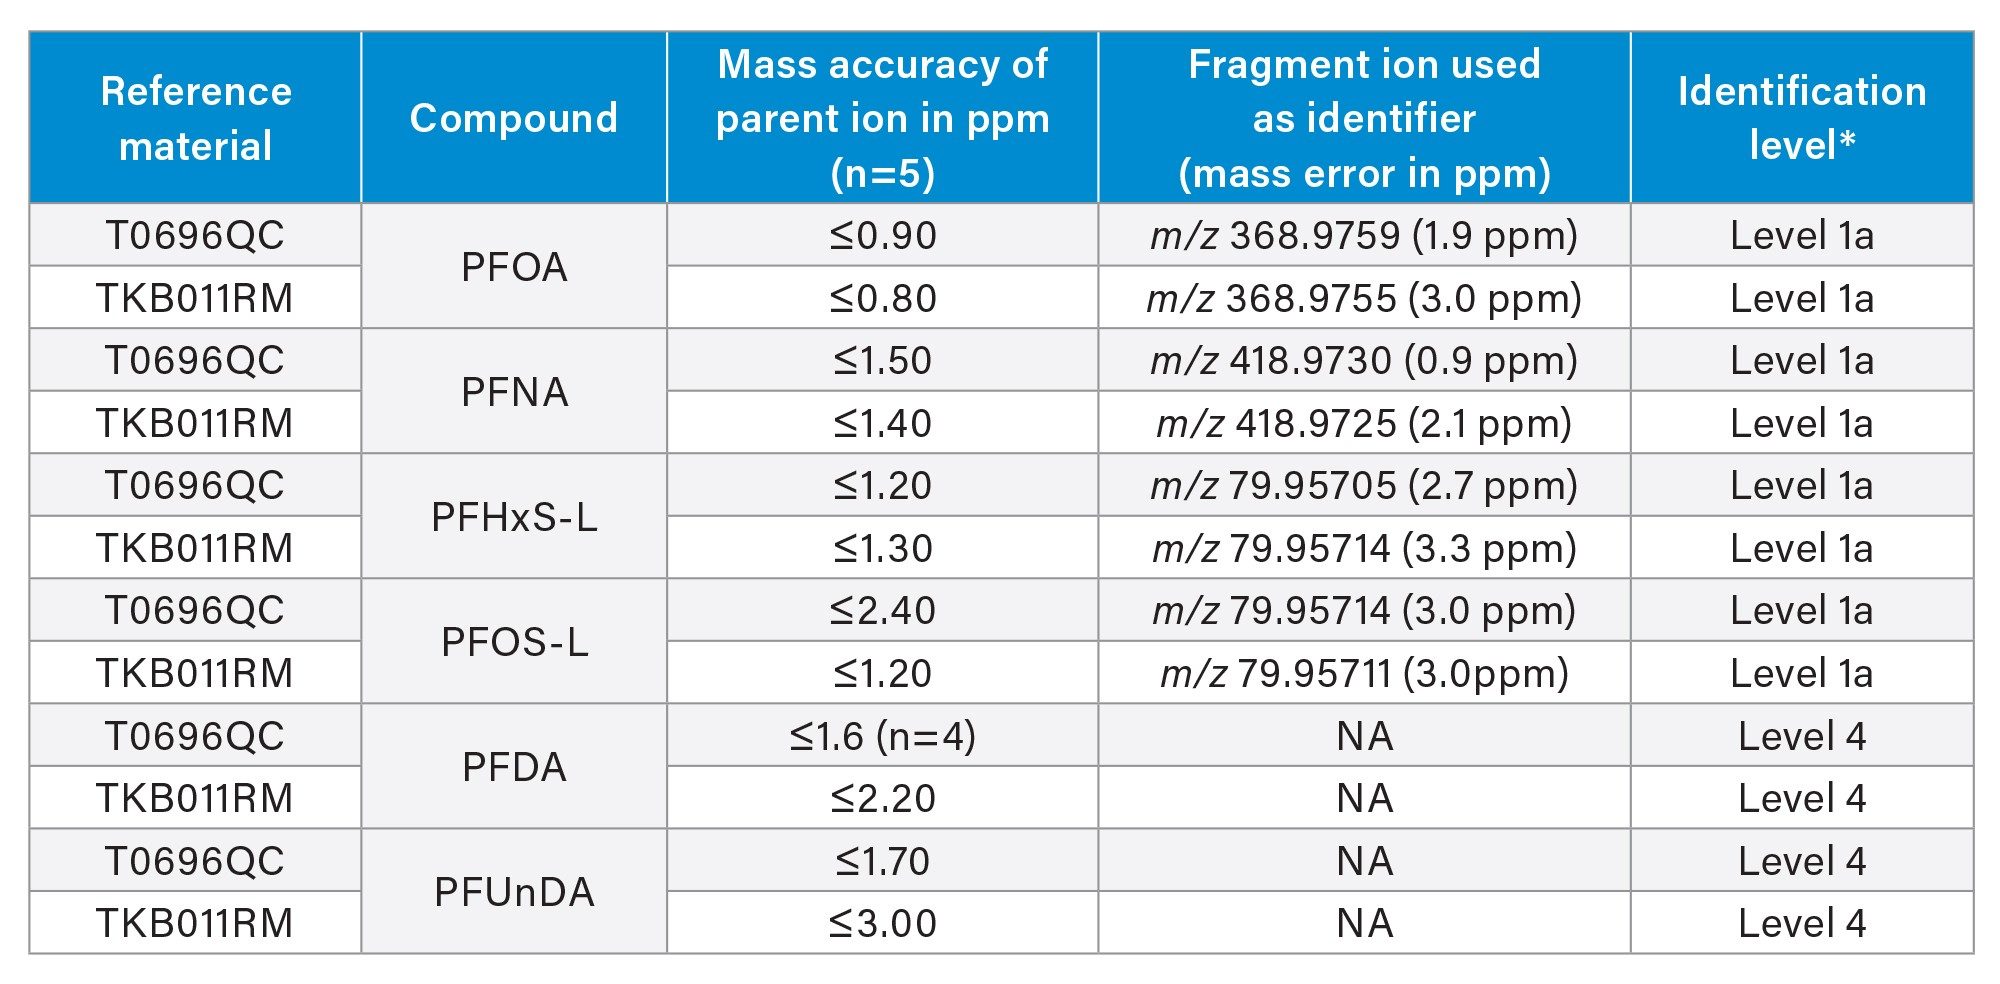
Additional confirmation of identity of the PFAS analytes was performed by comparison of the analyte relative retention time to that of the calibration standard, where all deviations calculated were <1%. All identification criteria from the EURL POPs PFAS guidance document were met.15
According to Charbonnet’s PFAS identification confidence levels criteria, a level 1a identification of PFOA, PFNA, PFHxS, and PFOS is based on accurate mass, mass defect, retention time compared to a standard and the detection of at least one fragment ion with mass accuracy less accuracy of less than or equal to 5 ppm. Whereas PFDA and PFUnDA were annotated based on accurate mass measurement and retention time when compared to a calibration standard. The peak intensities were low, for PFDA and PFUnDA with no specific fragment ion detected in the fish reference material and therefore, the identification level of PFDA and PFUnDA is level 3d.
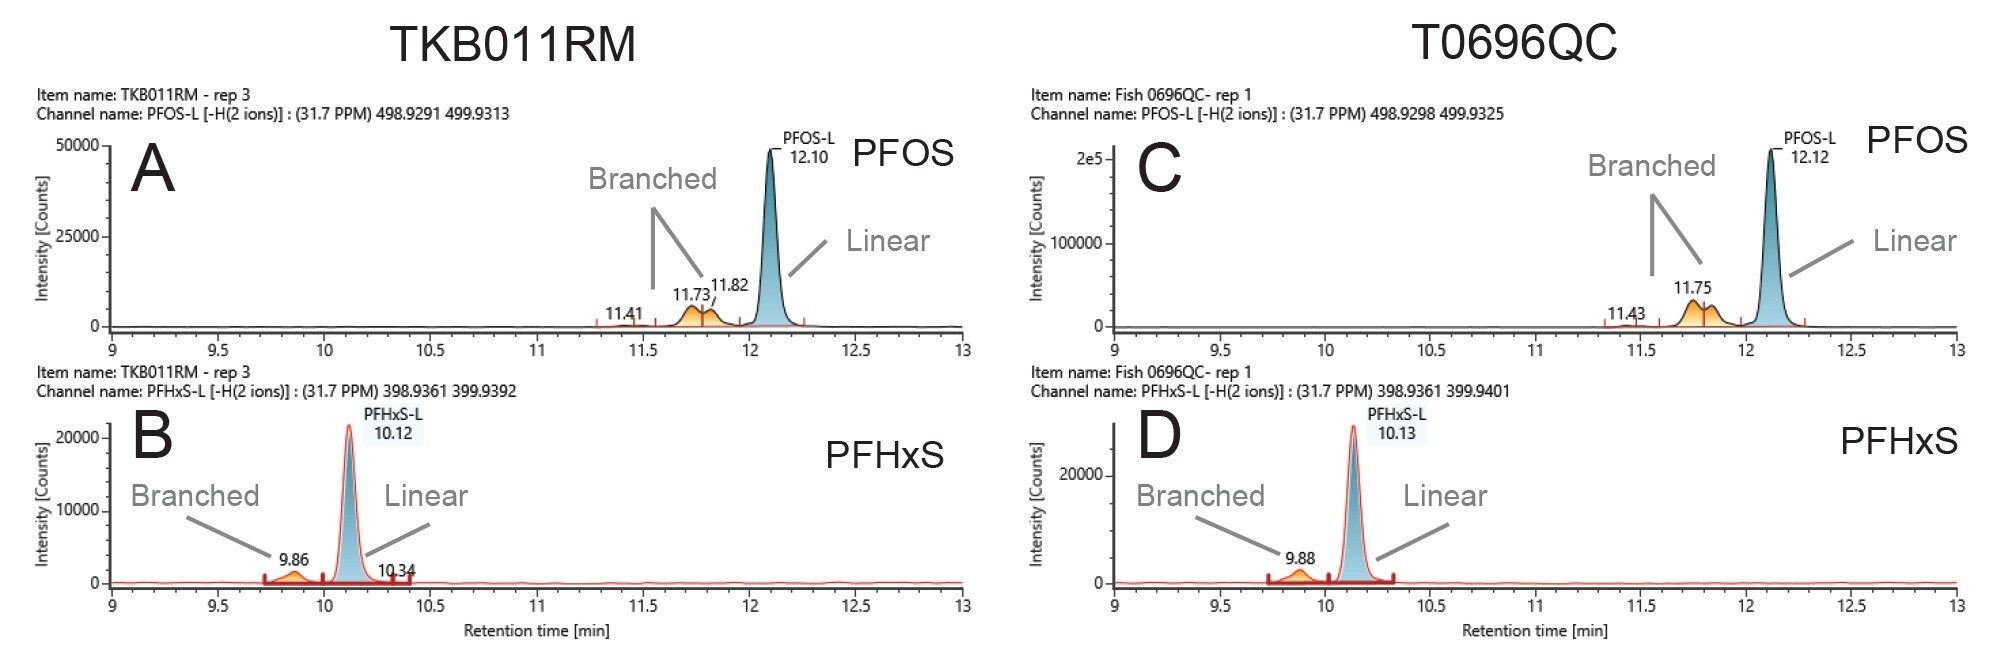
PFOS and PFHxS are detected in samples as both linear and branched isomers. The EURL guidelines recommend quantifying the linear and branched isomers against the linear isomer calibration graph and report them individually and as a sum of all detected isomers (EU guidelines 2022). Figure 2 depicts the extracted ion chromatograms (XIC) of both PFOS and PFHxS in the studied fish reference material: TKB011RM and T069QC where both linear and branched isomers were chromatographically separated. Figure 2 depicts the XIC of PFOS (Figure 2 A and C) and PFHxS (Figure 3 B and D) detected in TBB011RM and T0696QC, respectively, where the linear and branched isomers are clearly distinguished.
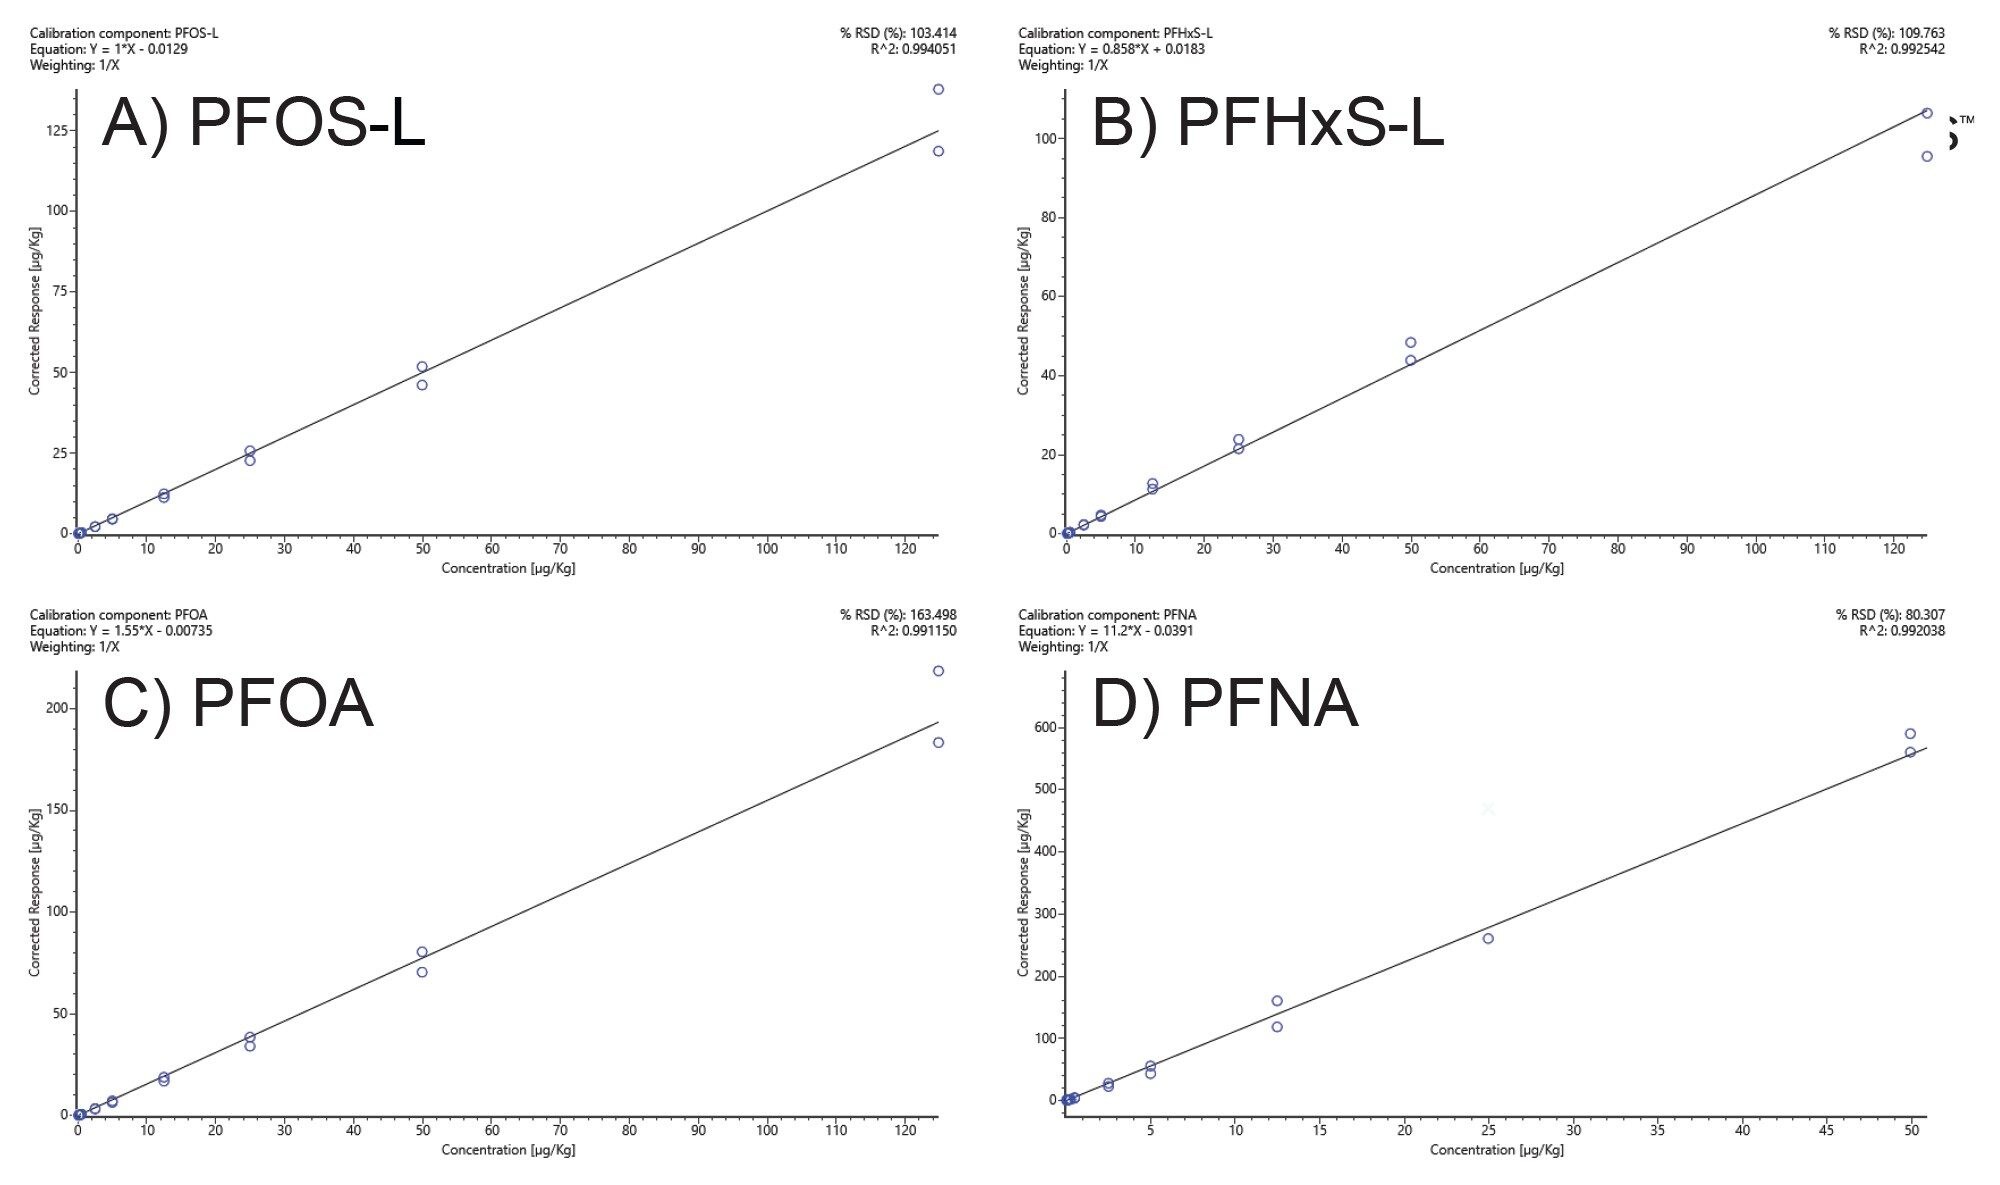
The versatility of high-resolution mass spectrometry workflows allows both qualitative and quantitative analysis. The four PFAS identified in the reference materials from the screening procedure where calibration standards were available were quantified. During the same NTS screening LC-HRMS sequence calibration standards in the range 1 ng/L to 25,000 ng/L (0.005 µg/Kg to 125 µg/Kg equivalent in samples) were included bracketing the samples. For the identified PFAS in this case, PFHxS, PFNA, PFOA ,and PFOS all calibration graphs had R2 values 0.99 or higher with residuals less than <20% (Figure 3). PFOS, PFHxS, and PFOA were linear from µg/Kg to 125 µg/Kg (Figure 3 A, B and C, respectively). Whereas PFNA was linear from 0.05 µg/Kg to 50 µg/Kg (Figure 3 D). For PFHxS and PFOS the branched and linear forms were identified where the concentration of the branched forms were quantified against the linear form calibration graph as suggested by the EURL POPs guidelines.15
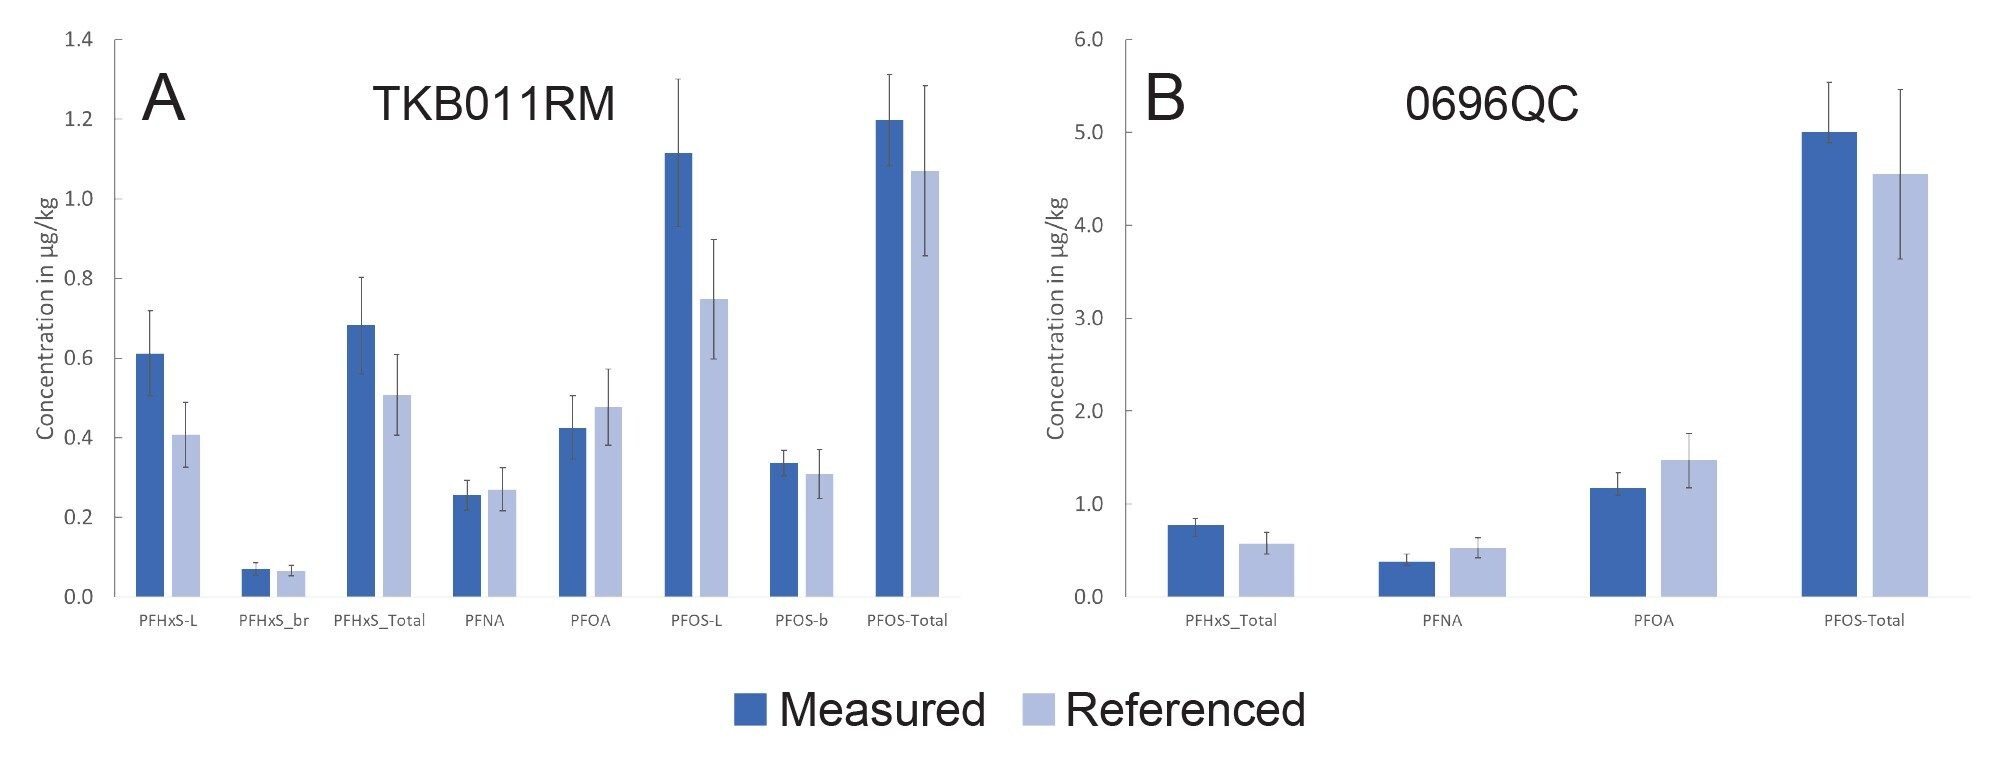
An assessment of trueness and repeatability were determined using the two Fapas® materials with the reference values used to ascertain the recovery of the PFAS from the material. An acceptance criterion of 80–120% was set and this was achieved for both reference materials. Intermediate precision was also assessed and, in all cases, lower than the specified 20% value in the EURL POPs PFAS guidance document. Figure 4 displays the results for the two reference materials compared to the assigned values.
The recovery of internal standards was assessed using the injection standards based on the following calculation in the EURL POPs PFAS guidance document. All internal standards were recovered within the range of 80–120%, except FOSA which was not recovered (it is washed off the SPE cartridge during the methanol wash stage as a neutral PFAS). This range is within the specified range of 35–140% as outlined in the EURL POPs PFAS guidance document.15
Herein, this work demonstrates the sensitivity of the Xevo G3 QTof for the screening, identification, and quantification of PFAS in food matrix. Where analytical standards are available, quantification is possible and meets the guidelines set out by the EURL POPs.15
Conclusion
The Xevo G3 QTof was used for the identification and quantification of PFAS in fish reference material, with the PFAS streamlined nontarget screening (NTS) workflow within the UNIFI application of the waters_connect software platform. The UNIFI screening and quantitative workflows offer numerous options from mass defect filtering, mass versus retention time filtering, and online database and library searches. The data set generated was used for targeted quantitative approach and can also be mined retrospectively for novel or previously unreported PFAS using the discovery toolsets and library sources. The high sensitivity of the Xevo G3 QTof instrument and the data independent acquisition mode, MSE, allowed for the identification of precursor and fragment ions of PFOA, PFDA, PFOS (linear and branched), PFHxS (linear and branched) in fish reference material.
References
- Hansen K J, Clemen L A. Ellefson M E., Johnson H O. Compound-Specific Quantitative Characterisation of Organic Fluorochemicals in Biological Matrices. Environ. Sci. Technol. 35, 766–770, 2001.
- Giesy J P and Kannan K Global Distribution of Perfluorooctane Sulfonate in Wildlife. Environ. Sci. Technol. 35: 1339–1342, 2001.
- Kelly B C, Ikonomou M G, Blair J D, Surridge B, Hoover D, Grace R, Gobas F A P C. Perfluoroalkyl Contaminants in an Arctic Marine Food Web: Trophic Magnification and Wildlife Exposure. Environ. Sci. Technol. 43 (11), 4037–4043, 2009.
- EFSA report. Results of the Monitoring of Perfluoroalkylated Substances in Food in the Period 2000–2009. February 2011.
- United States Environmental Protection Agency. Analysis of Per and Polyfluoroalkyl Substances (PFAS) in Aqueous, Solid, Biosolids, and Tissue Samples by LC-MS/MS. 4th Draft method 1633, July 2023.
- Organtini K, Rosnack K, Hancock P. Analysis of Per and Polyfluoroalkyl Substances (PFAS) in Accordance with EPA 1633 Part 1: Establishing and Assessing the Method. Waters Application note 720008117, 2023.
- Khoury-Hollins H., Reid L., Adams S. Direct Injection Screening Method for Per and Polyfluoroalkyl Substances (PFAS) in Drinking Water Using the High Resolution Time of Flight Mass Spectrometer, the Xevo™ G3 QTof. Waters Application note. 720008198, 2024.
- Commission Recommendation (EU) 2022/1431, on the Monitoring of Perfluoroalkyl Substances in Food. L 221/105, 26.8. 2022.
- Travis D Evidence That There are Two Forms of Fluoride in Human Serum. Nature 214: 1050–1051, 1968.
- Lau C, Perfluorinated Compounds: An Overview. In: DeWitt, J.C. (Ed.), Toxicological Effects of Perfluoroalkyl and Polyfluoroalkyl Substances. Springer, pp. 1–21, 2015.
- Dickman R A, Aga D S. A Review of Recent Studies on Toxicity, Sequestration, and Degradation of Per- and Polyfluoroalkyl Substances (PFAS) Journal of Hazardous Material. 436: 129120, 2022.
- Trudel D, Horowitz L, Wormuth M, Scheringer M, Cousins IT, Hungerbühler K. Estimating Consumer Exposure to PFOS and PFOA. Risk Anal. 28:251–69, 2008.
- De Silva A O, Armitage J M, Bruton T A, Dassuncao C, Heiger-Bernays W, Hu X C, Kärrman A, Kelly B, Ng C, Robuck A, Sun M, Webster T F, Sunderland E M. PFAS Exposure Pathways for Humans and Wildlife: A Synthesis of Current Knowledge and Key Gaps in Understanding Environ Toxicol Chem. 40: 631–657, 2021.
- Schrenk D, Bignami M, et al, EFSA Panel on Contaminants in the Food Chain (EFSA CONTAM Panel), Risk to Human Health Related to the Presence of Perfluoroalkyl Substances in Food. EFS2;18(9) 2020.
- EURL for Halogenated POPs in Feed and Food (2022): Guidance Document on Analytical Parameters for the Determination of Per- and Polyfluoroalkyl Substances (PFAS) in Food and Feed, version 1.2 of 11 May 2022. Available online under (https://eurl-pops.eu/core-working-groups#_pfas)
- Adams S, Dreolin N, Organtini K L, Hancock P. Analysis of Per- and Polyfluoroalkyl Substances (PFAS) in Animal Products with an Enhanced Sensitivity LC-MS/MS Method using Fish Reference Materials as a Case Study. Waters Application note. 720008108, 2023.
- Twohig M, Fujimoto G, Mohan A, Organtini K L, Rosnack K J, Hird S. Approaches to Non-targeted Analyses of Per- and Polyfluoroalkyl Substances (PFAS) in Environmental Samples. Waters Application note. 720007184, 2021.
- U.S. Environmental Protection Agency. CompTox Chemicals Dashboard. https://comptox.epa.gov/dashboard/chemical-lists/pfasmaster accessed November 2023.
- Suspect List of Possible Per- and Polyfluoroalkyl Substances (PFAS). https://data.nist.gov/od/id/mds2-2387 Accessed March 2023.
- Bugsel B, Zweigle J, Zwiener C. Nontarget Screening Strategies for PFAS Prioritization and Identification by High Resolution Mass Spectrometry: A Review. Trends in Environmental Analytical Chemistry. 40: e00216, 2023.
- Charbonnet J A, McDonough C A, Xiao F, Schwichtenberg T, Cao D, Kaserzon S, Thomas K V, Dewapriya P, Place B J, Schymanski E L, Field J A, Helbling D E, Higgins C P. Communicating Confidence of Per- and Polyfluoroalkyl Substance Identification via High-Resolution Mass Spectrometry. Environ Sci Technol Lett. 9: 473–481, 2022.
720008360, June 2024