• Application Note

A Stress Testing Study of Glimepiride Drug Substance Utilizing UPLC-MS Methodology

A Stress Testing Study of Glimepiride Drug Substance Utilizing UPLC-MS Methodology

  • Michael D. Jones
  • Jessalynn P. Wheaton
  • Mary Jo Wojtusik
  • Robert S. Plumb
  • Waters Corporation

Abstract

In this application, a generic UPLC method was used to assess degradant peaks during a stress testing analysis of glimepiride drug substance.

Introduction

Forced degradation or stress testing studies are done to identify likely degradation products and to help establish the degradation pathways and intrinsic stability of a drug molecule. They are also performed to demonstrate specificity for development and validation of stability-indicating analytical methods.

Forced degradation studies may be used later in development to distinguish between degradation products in formulations that are related to a drug substance, and those that are related to non-drug substances or excipients.

The ability to improve and streamline the analytical procedures used to identify potential impurities is important to goals of providing safe medicines to the marketplace faster.

One of the challenges with forced degradation studies is that there are no definitive procedures describing how the testing should be performed. In addition, the analytical methods used to monitor forced degradation studies must be sufficiently specific and sensitive to ensure detection of all of the potential impurities.

In this application, a forced degradation study will be performed for the drug substance glimepiride. Waters UltraPerformance LC (UPLC) Technology and the Empower 2 Software chromatography data system facilitate the analysis of the degradation behavior of drug substances during stress testing.

The sensitivity and chromatographic efficiency of UPLC enables the detection of even very low levels of degradants. The enhanced resolution of UPLC and specificity of MS detection ensures that all impurities are detected, achieving a comprehensive evaluation of the forced degradation of glimepiride.

Figure 1. Structure and formula weight of glimepiride.

Experimental

Accelerated degradation of glimepiride was carried out under acid, alkaline, oxidative, and elevated temperature conditions. An accurate weighing of glimepiride reference standard was dissolved to yield a stock solution of 500 μg/mL glimepiride in methanol. Preparations of 0.5 N HCl, 0.5 N NaOH, and 4% hydrogen peroxide were used as the separate reagent mediums for the degradation procedure.

Two milliliters of glimepiride stock solution were pipetted to each of four 5-mL reaction vessels. Two milliliters of each reagent medium was pipetted separately to each respectively-labeled  reaction vessel – 0.5N HCl + glimepiride stock, 0.5N NaOH +  glimepiride stock, and 4% H2O2 + glimepride stock – to yield final concentrations of glimepiride in solution to 250 μg/mL. Two milliliters of methanol was added to the fourth reaction vessel to yield a concentration of 250 μg/mL glimepiride in methanol. The fourth reaction vessel was used for thermal degradation at 90 °C.

LC conditions

LC system:

ACQUITY UPLC

Column:

ACQUITY UPLC BEH C18, 2.1 x 50 mm, 1.7 μm

Column temp.:

30 °C

Flow rate:

800 μL/min

Mobile phase A:

20 mM ammon. formate, pH 3.0

Mobile phase B:

Acetonitrile

Gradient:

5 to 95% B/5 min

MS conditions

MS system:

ACQUITY SQD with the SQ Detector

Ionization mode:

ESI Positive

Capillary voltage:

3200 V

Cone voltage:

20 V

Desolvation temp.:

500 °C

Desolvation gas:

1200 L/Hr

Source temp.:

150 °C

Acquisition range:

100 to 600 m/z

Separate blanks were also prepared for each degradation medium by adding 2 mL of reagent medium with 2 mL of methanol (diluent) resulting in a total of eight separate reaction vials. The eight reaction vessels were tightly closed with Teflon-lined caps and placed in a heating oven monitored with a thermacouple to maintain a temperature of 90 ± 30 °C. Aliquots of 200 μL were taken at time points 0, 30, 60, 90, 120, and 180 minutes and diluted in 200 μL of methanol to yield a resulting working glimepiride solution of 125 μg/mL for analysis.

Results and Discussion

System suitability was determined by calculating the percent relative standard deviation (RSD) for area and retention time for five replicate injections of the 125 μg/mL glimepiride standard. The area %RSD was calculated to be 0.9% and the retention time %RSD was calculated to be 0.0%.

Determination of the linearity of the UPLC method was required to accurately quantitate the rate of decomposition of glimepiride. Five standards of separate concentrations 25, 50, 100, 125, and 250 μg/mL glimepiride in methanol were prepared. A calibration curve was created using the five standard solutions injected in triplicate. The resulting correlation coefficient was calculated to be R2 = 0.99982 (Figure 2).

Figure 2. Calibration curve of glimepiride for the range of concentration 25 μg/mL to 250 μg/mL.

Kinetic behavior

Empower 2 was used to facilitate the quantitation of glimepiride decomposition. The rate of decomposition was determined by measuring the decrease in the amount of glimepiride over the sampling period. The kinetic slopes are shown in Figure 3 whereas the log% remaining was plotted versus time.

Each of the degradation mediums – acidic, alkaline, oxidative, and thermal – exhibited a linear kinetic behavior. The R2 values were in the range of 0.93 to 0.99. It was expected that some experimental error was to occur due to evaporation, given the volatile nature of the methanol diluent used to dissolve the glimepiride at the elevated temperature of 90 °C.

The average rate of change was calculated and determined from the slope of the kinetic curves in Figure 3. The values were: 1.1 x 10⁻³ min-1 for acidic medium, 1.2 x 10⁻³ min-1 for oxidative medium, 2.9 x 10⁻³ min-1 for thermal effects in methanol diluent, and 4.3 x 10⁻³ min-1 for alkaline medium.

To best describe the effects of each degradation medium, the effects can be categorized in increasing susceptibility as acidic < oxidative < thermal < alkaline in the review window of Empower 2.

Chromatographic characteristics

Low level impurities were easily detected and identified using the ACQUITY UPLC System and the SQ Detector, for single quadrupole MS detection, with Empower 2. Chromatograms generated from sampling the different degradation conditions were easily compared using Empower 2 (Figure 4). The major peaks were labeled A through F in the four chromatograms generated from the different degradation conditions.

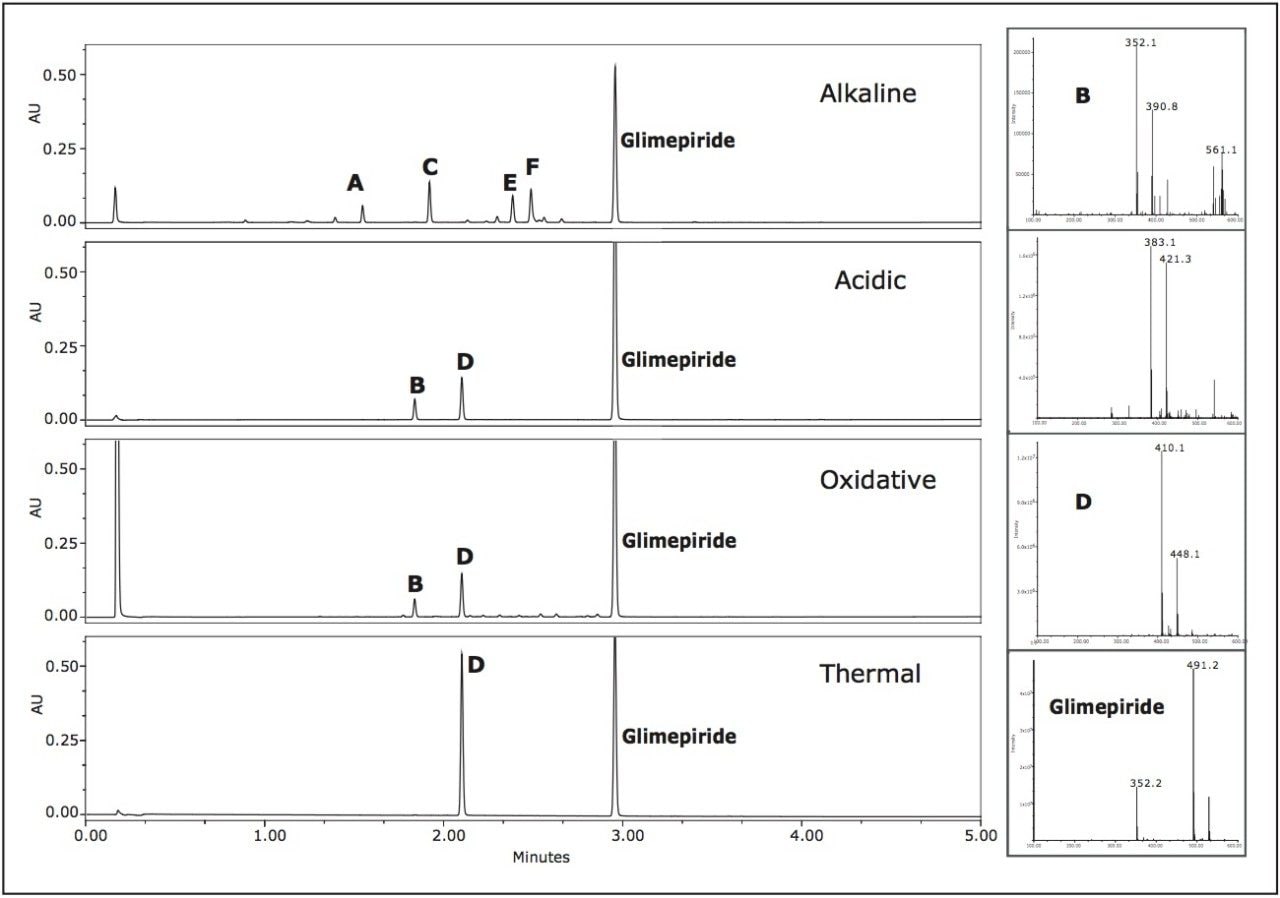
The alkaline degradation produced the largest number of peaks with the major peaks labeled A, C, E, and F at retention times 1.55 min, 1.92 min, 2.31 min, and 2.40 min, respectively. The oxidative degradation yielded a large number of peaks, however the peaks were quite small and indicative of the slower rate of decomposition of glimepiride in the oxidizing environment.

Two peaks, B and D at 1.84 min and 2.10 min, were at significant levels. The acidic conditions also yielded peaks B and D as confirmed by the mass spectra. The observed m/z for peak D in the chromatograms representing the acidic, oxidative, and thermal degradation conditions was determined to be 410.1 Daltons. Peak B exhibited different m/z values at various scans across the peak. The major observed masses were 353, 390, and 561. Overlaid extracted MS scans of the masses indicated that a co-elution may be present within peak B.

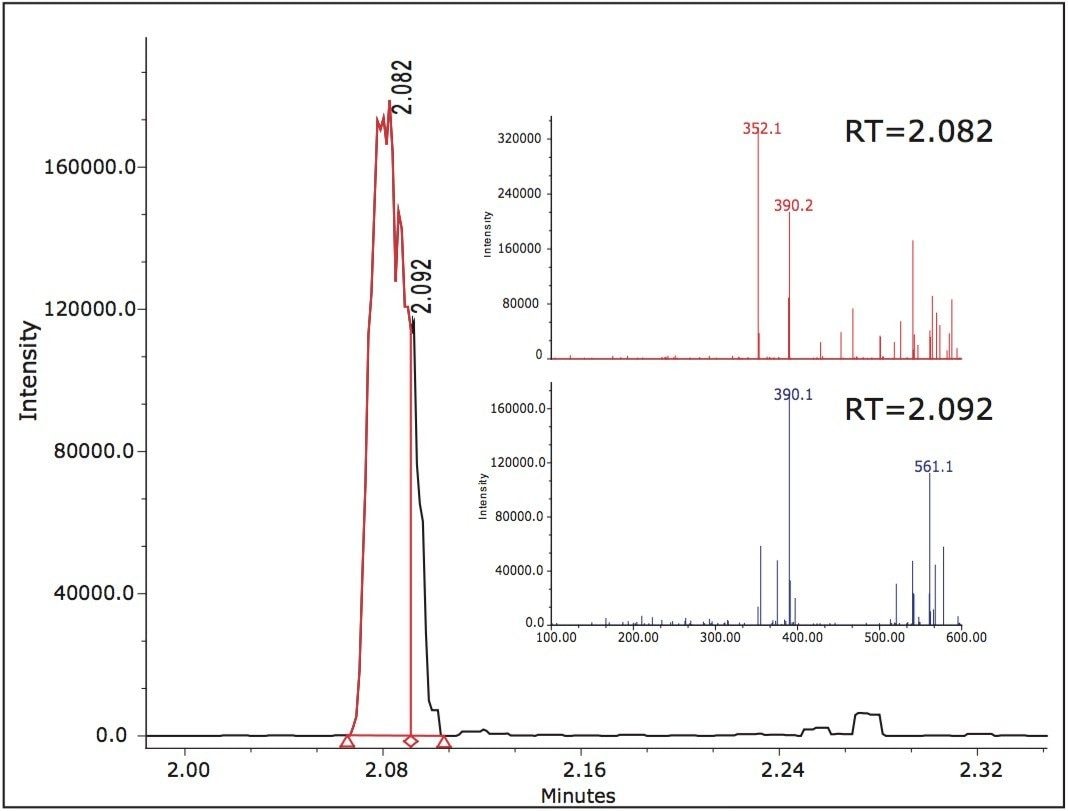
Extracted chromatograms of the observed spectral masses of 352.1 Da and 390.1 Da eluted at a retention time of 2.082 min and mass 561.1 Da eluted at 2.088 min. Integration of the peak at various cross-sections resulted in mass spectral data in which it was apparent that there was a co-elution. The mass spectra for the first integrated segment gave a base peak of 352.1 Da with the second largest intensity peak at 390.1 Da. The integrated tail end of the peak gave a base peak mass of 390.1 Da with a second largest intensity m/z at 561.1 Da.

The initial assumption of an adduct was negated due to the decrease of intensity of the 352.1 spectral trace and increased mass spectral intensity of the 390.1 spectral trace. The spectra exhibiting 561.1 Da is unknown at this time (Figure 5).

The use of a generic LC method for forced degradation screening normally has a benefit of adding speed to the analysis. Differently, in compound-specific assays, more resolution can be obtained and confidence increases as separation of all the expected and unexpected peaks can be achieved.

In this example, UPLC-MS provided the necessary speed for the analysis with little compromise in resolution of many of the peaks, with the exception of a possible co-elution under the peak labeled B. Obviously by utilizing the MS data, much information was obtained about the masses and purity of any peak in the chromatogram. We determined that the peak was most likely related to the active ingredient because Peak B (m/z 352.1) was an observed product ion fragment of the active pharmaceutical glimepiride (see the glimepiride spectra in Figure 4).

Conclusion

In this application, a generic UPLC method was used to assess degradant peaks during a stress testing analysis of glimepiride drug substance.

The generic method demonstrated linearity over a large range of concentration as automatically calculated by Empower 2 CDS. The calibration curve was used to establish the kinetic behavior of glimepiride when subjected to the various stress conditions. Using single quadrupole MS spectral data assisted in the evaluation of peak purity of each major peak of interest.

This stability information will help to determine the appropriate diluents, method conditions, matrix options, standard and/or sample preparation for future experiments and will prove useful in the final method development of the drug product. The use of ACQUITY UPLC coupled to the SQ Detector and data analysis within Empower 2 decreased analysis time and enabled a workflow that proved to be more efficient than the traditional manual – and sometimes less information-rich – approaches that are used today.

720002638, June 2015

Back To Top Back To Top