Automating Charged Aerosol Detection (CAD) Analysis with Empower™ CDS Using a Single-Vendor Integrated LC Platform
Robert Birdsall, Xiangsha Du, Pawel Bigos, Duanduan Han, Nikhil Bhiwankar
Waters Corporation, United States
Published on April 05, 2026
Abstract
This app note introduces an integrated Empower Chromatography Data System (CDS) based, orthogonal detection platform method, incorporating a newly developed charged aerosol detector (CAD) from Waters. The proposed data-driven workflow offers users the ability to rapidly review results and calibration modeling to quickly identify optimal power function settings for accurate quantitation. This approach facilitates objective assessment of data within a compliant-ready CDS with increased efficiency in manufacturing support labs.
Lipid nanoparticles (LNPs) are a critical enabling technology for gene and nucleic acid–based therapeutics, yet their complex, multi-lipid composition presents significant analytical challenges throughout development and manufacturing. The diverse physicochemical properties of individual lipid components can strongly influence chromatographic behavior and detector response, necessitating robust and sensitive analytical strategies to ensure product safety, quality, and efficacy, making LNPs an ideal case study for demonstrating the utility of the proposed analytical workflow.
Benefits
- Single vendor CAD-based workflow facilitates evaluation and processing of CAD data within the Empower CDS as compliant-ready solution.
- Simultaneous acquisition of CAD power function values enables rapid method optimization for increased productivity.
- Objective data review in a semi-automated fashion using CDS software processing/reporting functionality to expedite data interpretation and method development.
Introduction
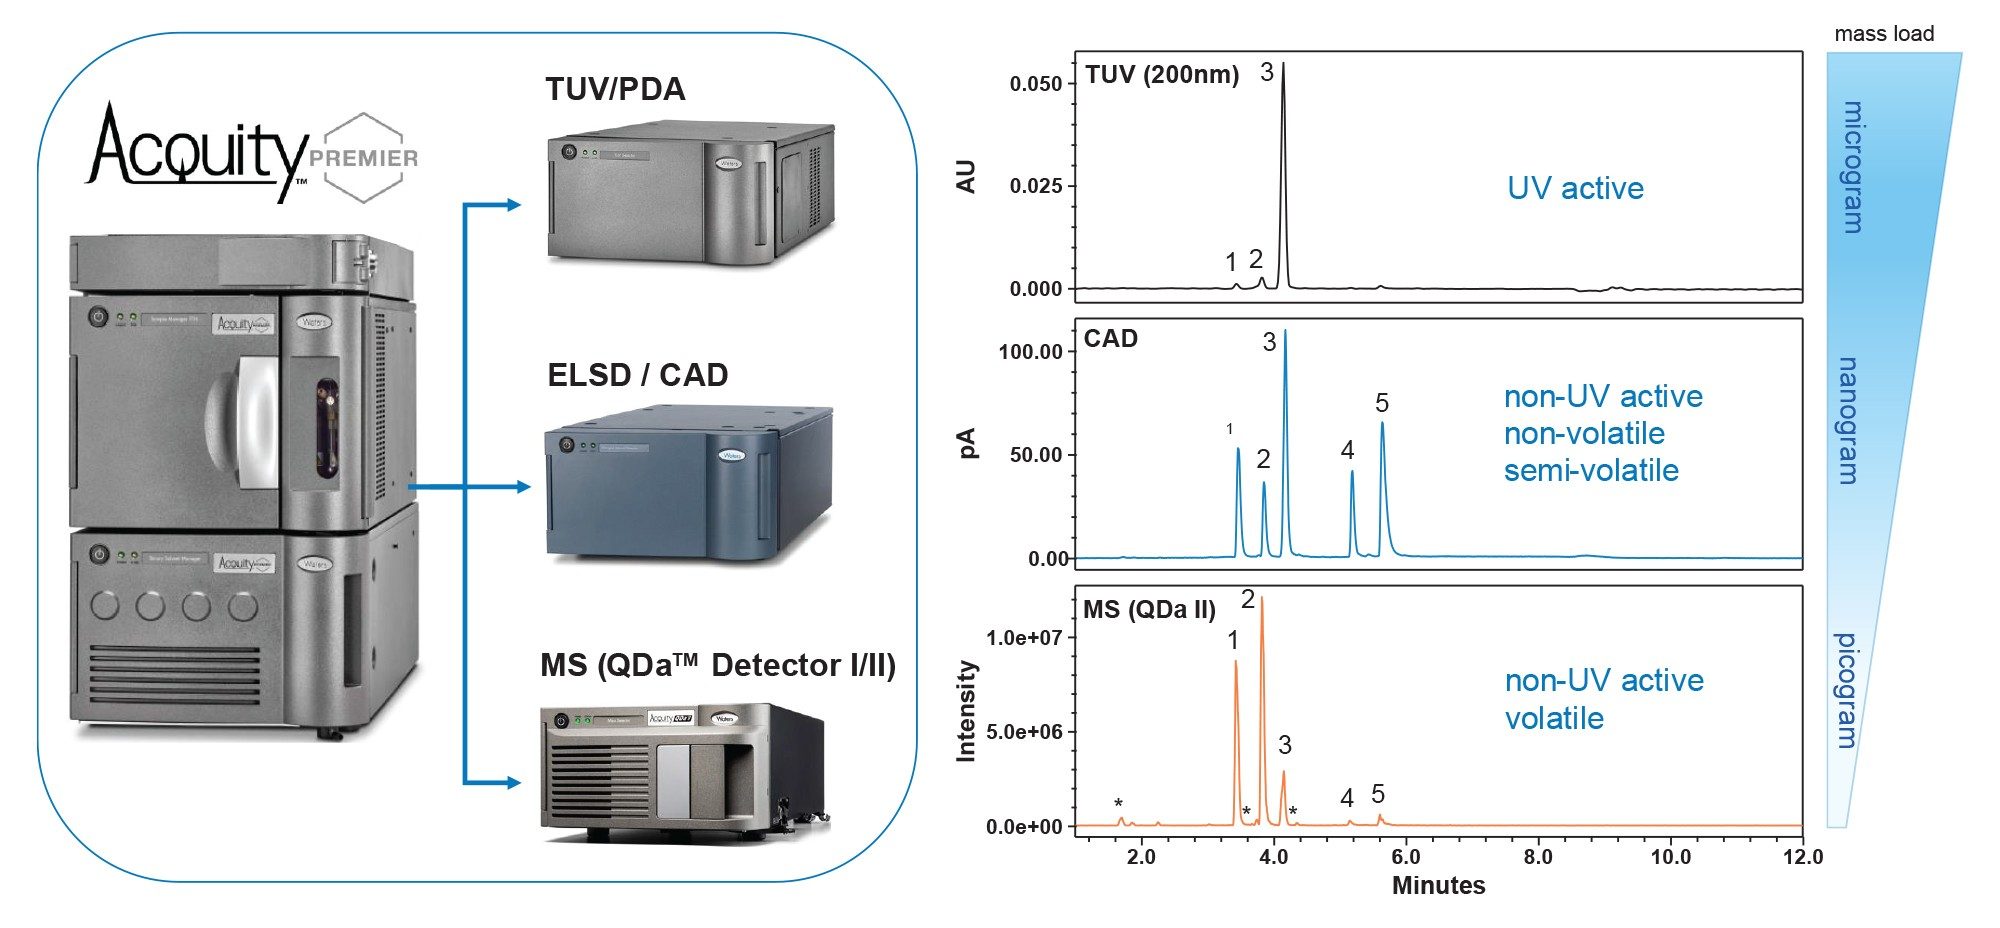
Waters CAD was engineered to deliver robust performance, ease of deployment, and simplified serviceability while maintaining compatibility with existing LC methods. Fully integrated and controlled within the Empower CDS, Waters CAD can be seamlessly combined with optical detectors and mass detection to support flexible, information rich workflows in the analysis of biotherapeutics (Figure 1).
In this study, an integrated, Empower CDS based orthogonal detection platform incorporating Waters CAD is introduced using lipid nanoparticles as a case study. This data‑driven workflow enables rapid review of results and calibration modeling to efficiently identify optimal power‑function settings for increased accuracy and robustness in CAD-based analyses. By supporting objective data assessment within a compliant‑ready CDS, the workflow improves analytical efficiency and decision‑making, making it well-suited for manufacturing environments where speed, reliability, and data integrity are critical.
Experimental
All lipids in this study were used for research and demonstration purposes and were purchased from the following vendors: cholesterol and DSPC from Sigma-Aldrich; DMG-PEG 2000 and SM-102 from Cayman Chemical. Stocks of each lipid were prepared in methanol at 5 mg/mL and diluted to the appropriate concentration at 90/10 methanol/water (v/v). Samples were separated with the ACQUITY™ Premier UPLC™ System using a Waters GTxResolve Lipid Phenyl-Hexyl+ RP 230 Å Column 1.6 µm, 2.1 x 50 mm (p/n: 186011698) MaxPeak™ Premier Column at 50 °C over a 6-minute gradient. Optical data were acquired with UV detection. Data acquisition and analysis were performed in Empower CDS.
LC Conditions
|
LC system: |
ACQUITY Premier System (BSM) |
|
Detection: |
TUV, λ= 200 / 280 nm FC = 5 mm Ti, 1Hz, time constant = normal |
|
Column: |
Waters GTxResolve Lipid Phenyl-Hexyl+ RP 230 Å Column 1.6 µm, 2.1 x 50 mm, (p/n: 186011698) |
|
Column temperature: |
50 °C |
|
Sample temperature: |
Ambient |
|
Injection volume: |
3 µL |
|
Flow rate: |
0.400 mL/min |
|
Mobile phase: |
A: 0.1% formic acid in water B: 50:50 MeOH:MeCN, 0.1% formic acid |
|
Chromatography software: |
Empower 3.9.0 CDS |
CAD Settings
|
Sampling rate: |
10 Hz |
|
Time constant: |
Normal |
|
Ion trap: |
20 V |
|
Evaporation temperature: |
35 °C |
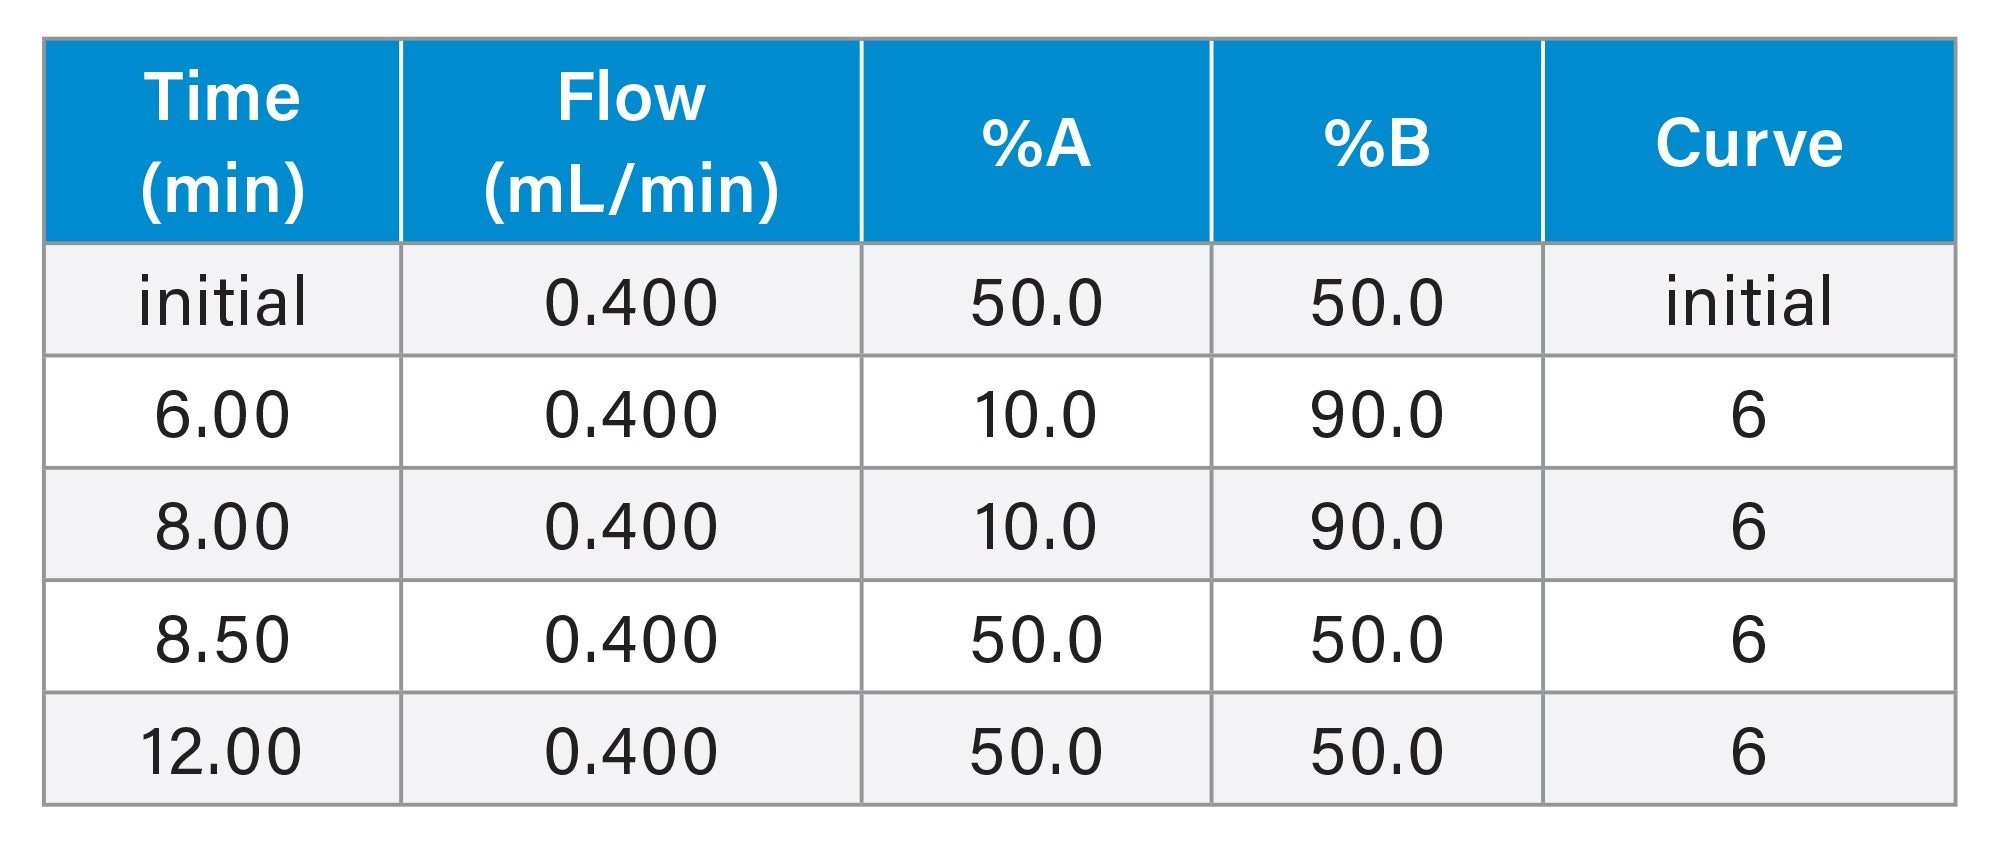
Gradient Table
Results and Discussion
LNPs are critical to the delivery of modern biotherapeutics, yet their analytical characterization remains challenging due to lipid structural diversity and limited UV activity. CAD addresses these challenges by enabling mass‑dependent detection of non‑volatile and semi‑volatile lipid species independent of chromophores (Figure 1).1,2
Column Selection
Equally important is the robustness of the chromatographic separation itself. Detector performance alone cannot compensate for limitations in column chemistry, particularly in manufacturing environments where consistency and automation are essential. A column that fails to adequately resolve the most challenging component becomes the limiting factor in the workflow.
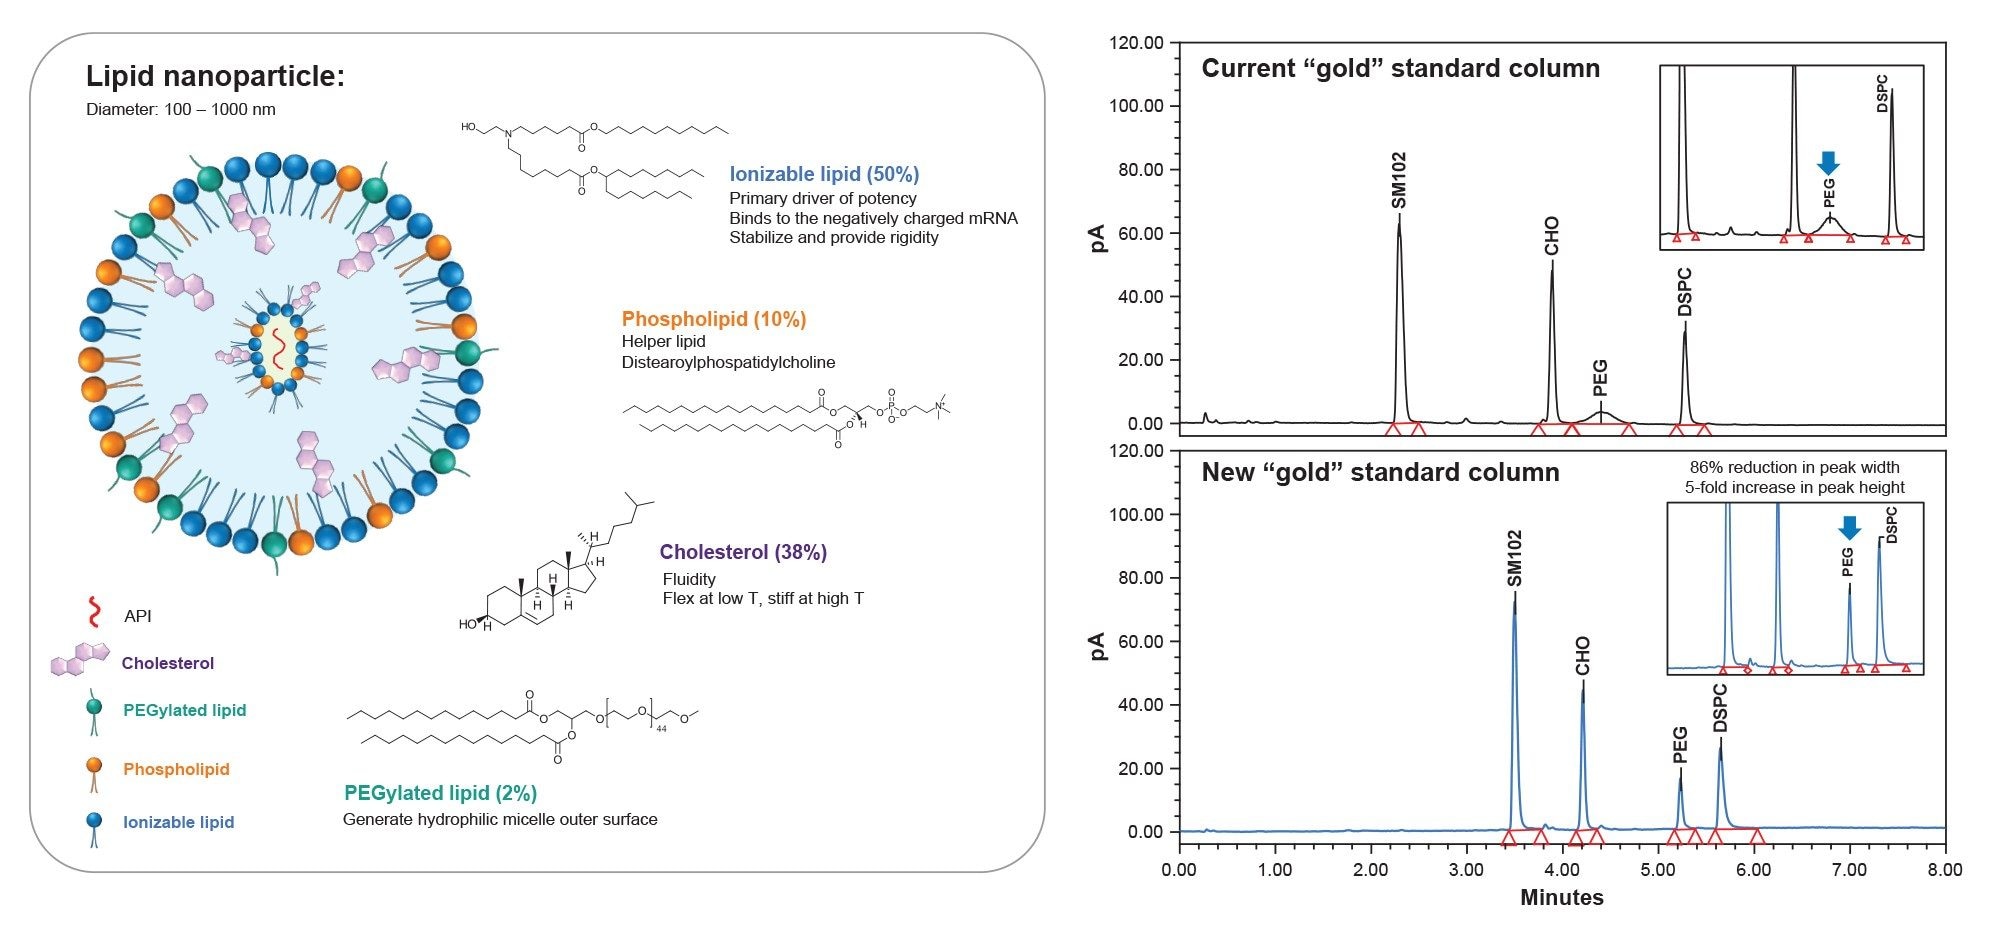
With this in mind, Waters is developing a new class of particles informed by prior advances in particle technology to address the challenges associated with LNP analysis. As shown in Figure 2, the DMG‑PEG peak as part of LNP composition analysis, is challenging to separate and detect using the current “gold” standard in column technology due to its low abundance and polydispersity.3 In contrast, when using new particle technology from Waters, the DMG-PEG peak exhibited an 86% reduction in peak width and a five‑fold increase in peak height. These improvements translate directly to increased sensitivity, lower limits of quantitation, and greater confidence in automated data processing, making it ideal for the proposed workflow.
Addressing Non-linear Detectors
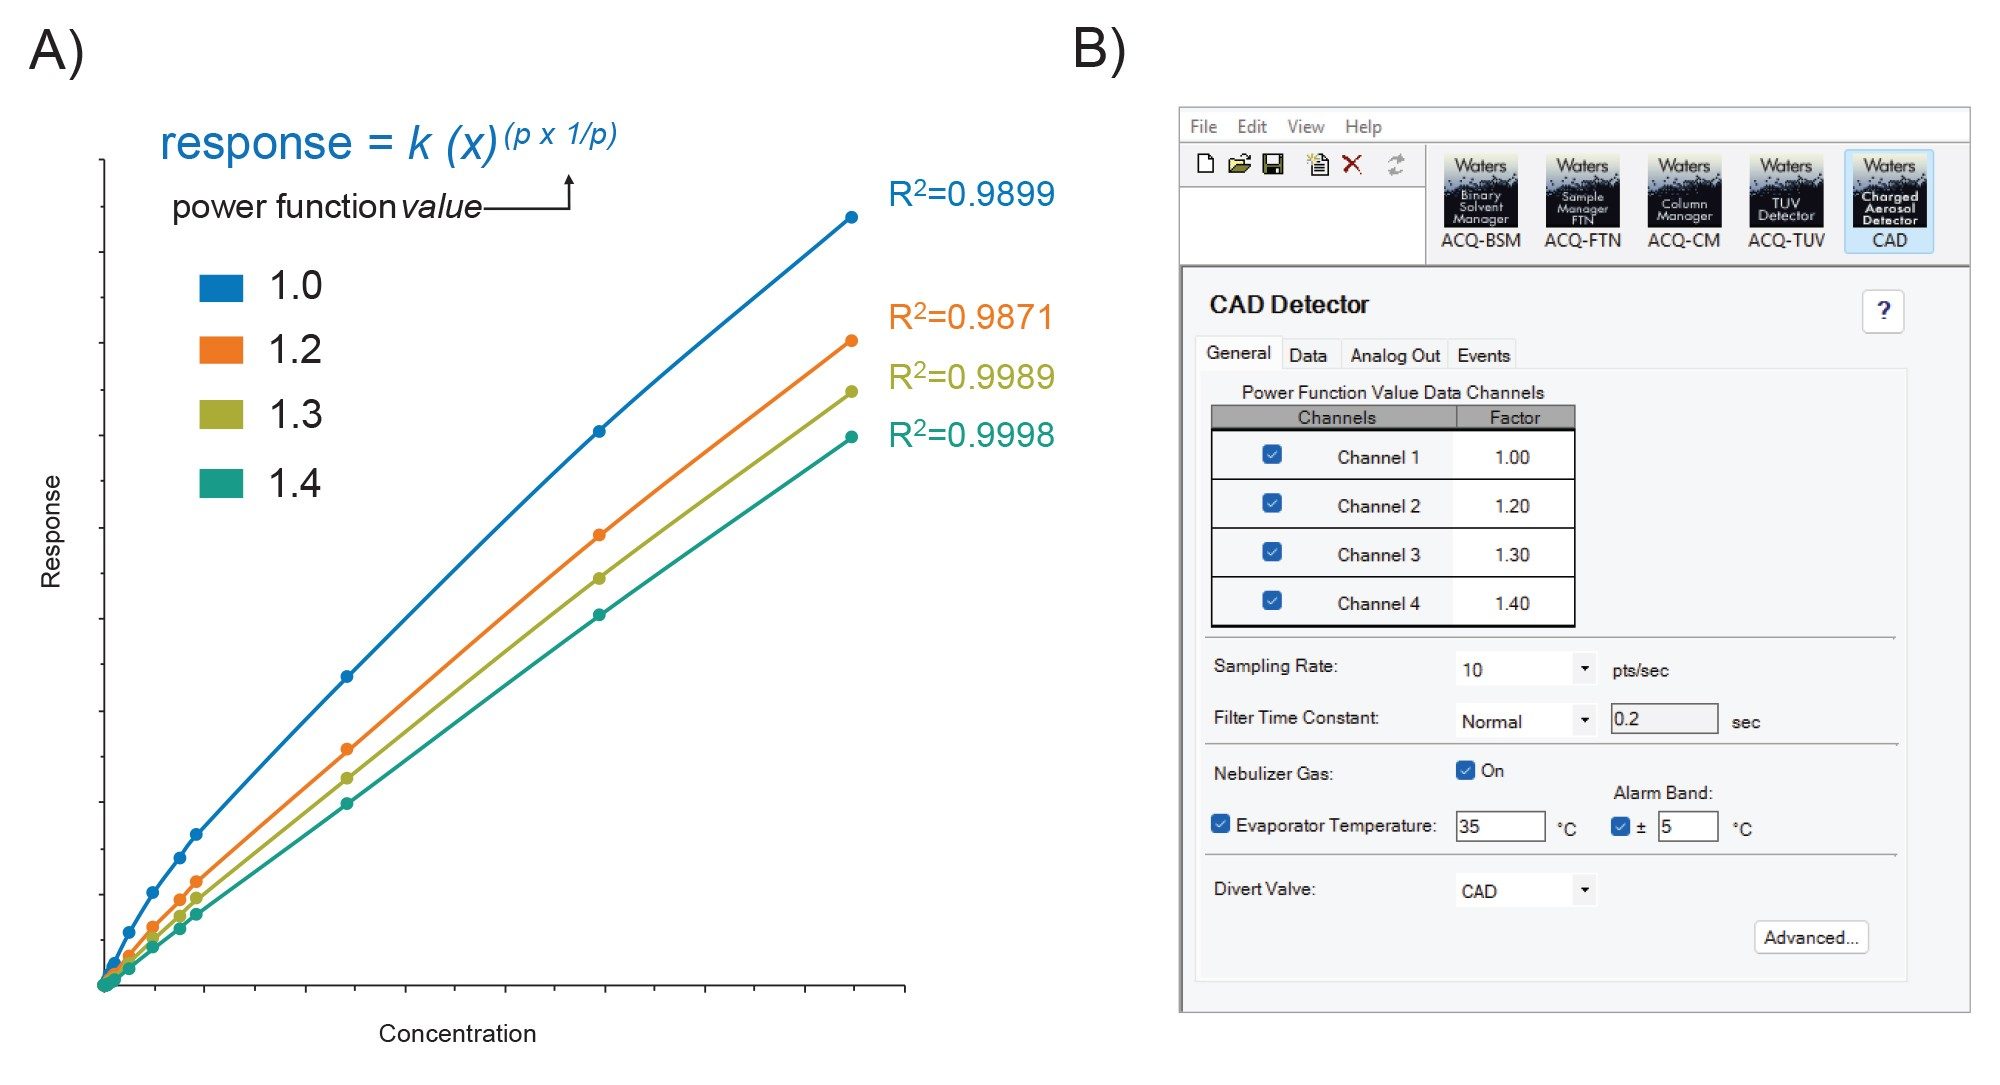
As a non-linear detector, CAD exhibits a response that is best described by a power law relationship, where detector signal is proportional to analyte concentration raised to an exponential term. As a result, raw CAD data typically displays a curved response when plotted on linear axes (PFV = 1), particularly over wide concentration ranges (Figure 3A). Traditionally, users of non‑linear detectors such as ELSD apply post‑acquisition data transformations such as log–log transformations to linearize calibration curves.4 While effective, this approach adds an extra processing step and can complicate method development and routine data analysis, particularly when working with extended dynamic ranges.
A key advantage of Waters CAD is its ability to perform response linearization during data acquisition through the use of four user defined power function value settings (Figure 3B). The power function value (PFV), defined mathematically as the reciprocal of the exponent term of the power law response curve, serves as a correction factor during acquisition. By optimizing this setting, the CAD detector response can be transformed such that the effective exponent term in the response curve approaches a value of 1.0. As demonstrated in Figure 3A, applying a PVF value of 1.4 resulted in correlation coefficient of R2=0.9998 vs R2=0.9899 when using a PFV=1.0 when fitted with a linear regression model. The near linear response across the tested concentration range of the analyte bypasses the need for post-acquisition transformations thus expediting data interpretation and method development.
Minimizing Risk with a Compliant-ready Workflow
Although structurally complex, LNPs as excipients assist in the delivery of the active pharmaceutical ingredient (API). As with all excipients used in drug products, regulatory expectations require a compliant comprehensive control strategy to ensure accurate identification, quantitation, and batch‑to‑batch consistency. The Empower CDS enables this by keeping acquisition, processing, optimization, and reporting within a single, validated environment minimizing analytical risks while maximizing productivity.
The Empower CDS allows for the systematic evaluation of power function values through standard calibration curves, regression modeling, and weighting schemes using built‑in statistical figures of merit. Calibration performance can be assessed directly from correlation coefficients and residuals, both of which quantify how well the regression model fits the experimental data. This approach allows rapid, data‑driven screening of multiple power function values to identify conditions that provide optimal linearization and acceptable quantitative accuracy.
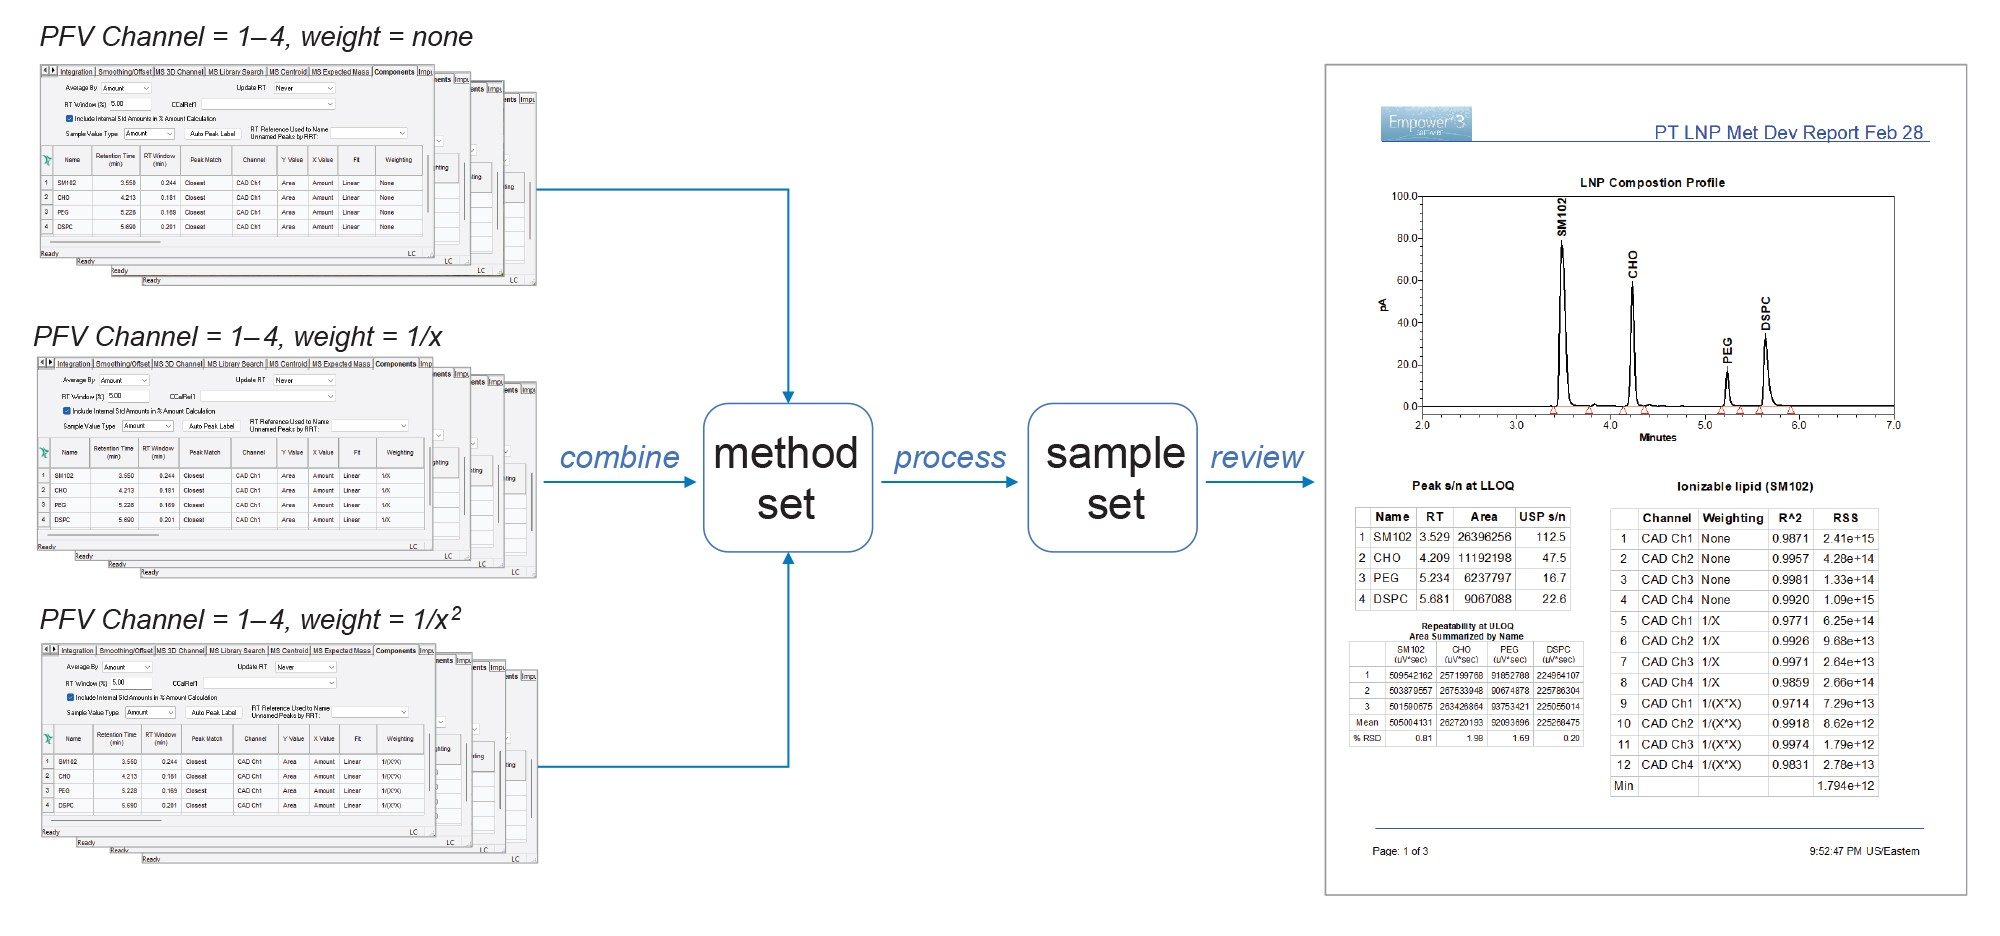
An example of an Empower Software-based workflow for LNP compositional analysis is illustrated in Figure 4. As shown, each component of the LNP requires evaluation in terms of identifying the optimal power function value for linearization of calibration plots as well as an appropriate regression model to account for heteroscedasticity in the response if present. In this example, calibration plots were evaluated for linearity across 10 concentration points in triplicate. Processing methods were created to identify the four LNP components (SM102, CHO, DMG-PEG, DSPC) at four unique PFV settings. These processing methods were then duplicated with and without weighting using a linear regression model and combined into a single method set which was then applied to the sample set to process and calibrate the standards. Collectively the generated data set represents 1,440 unique data points for review. As shown on the right side of Figure 4, the built-in reporting functionality of the Empower CDS is readily capable of filtering out figures of merit associated with each PFV and calibration curve. In this instance, line 11, exhibited the best overall regression model fit in both correlation coefficient (R2=0.9974) and residual sum of squares (RSS=1.79e+12) for the ionizable lipid SM102.
In addition to calibration fit metrics, data can be readily filtered to provide complementary quantitative diagnostics, including calibration accuracy (% deviation), repeatability (% RSD), and signal-to-noise (s/n). These metrics support objective identification of potential outliers without manual data curation. Data points exhibiting elevated deviation can be flagged for further review or excluded from calibration data, reinforcing transparent and defensible decision‑making consistent with regulated workflows.
Automated Assessment of LNP Composition
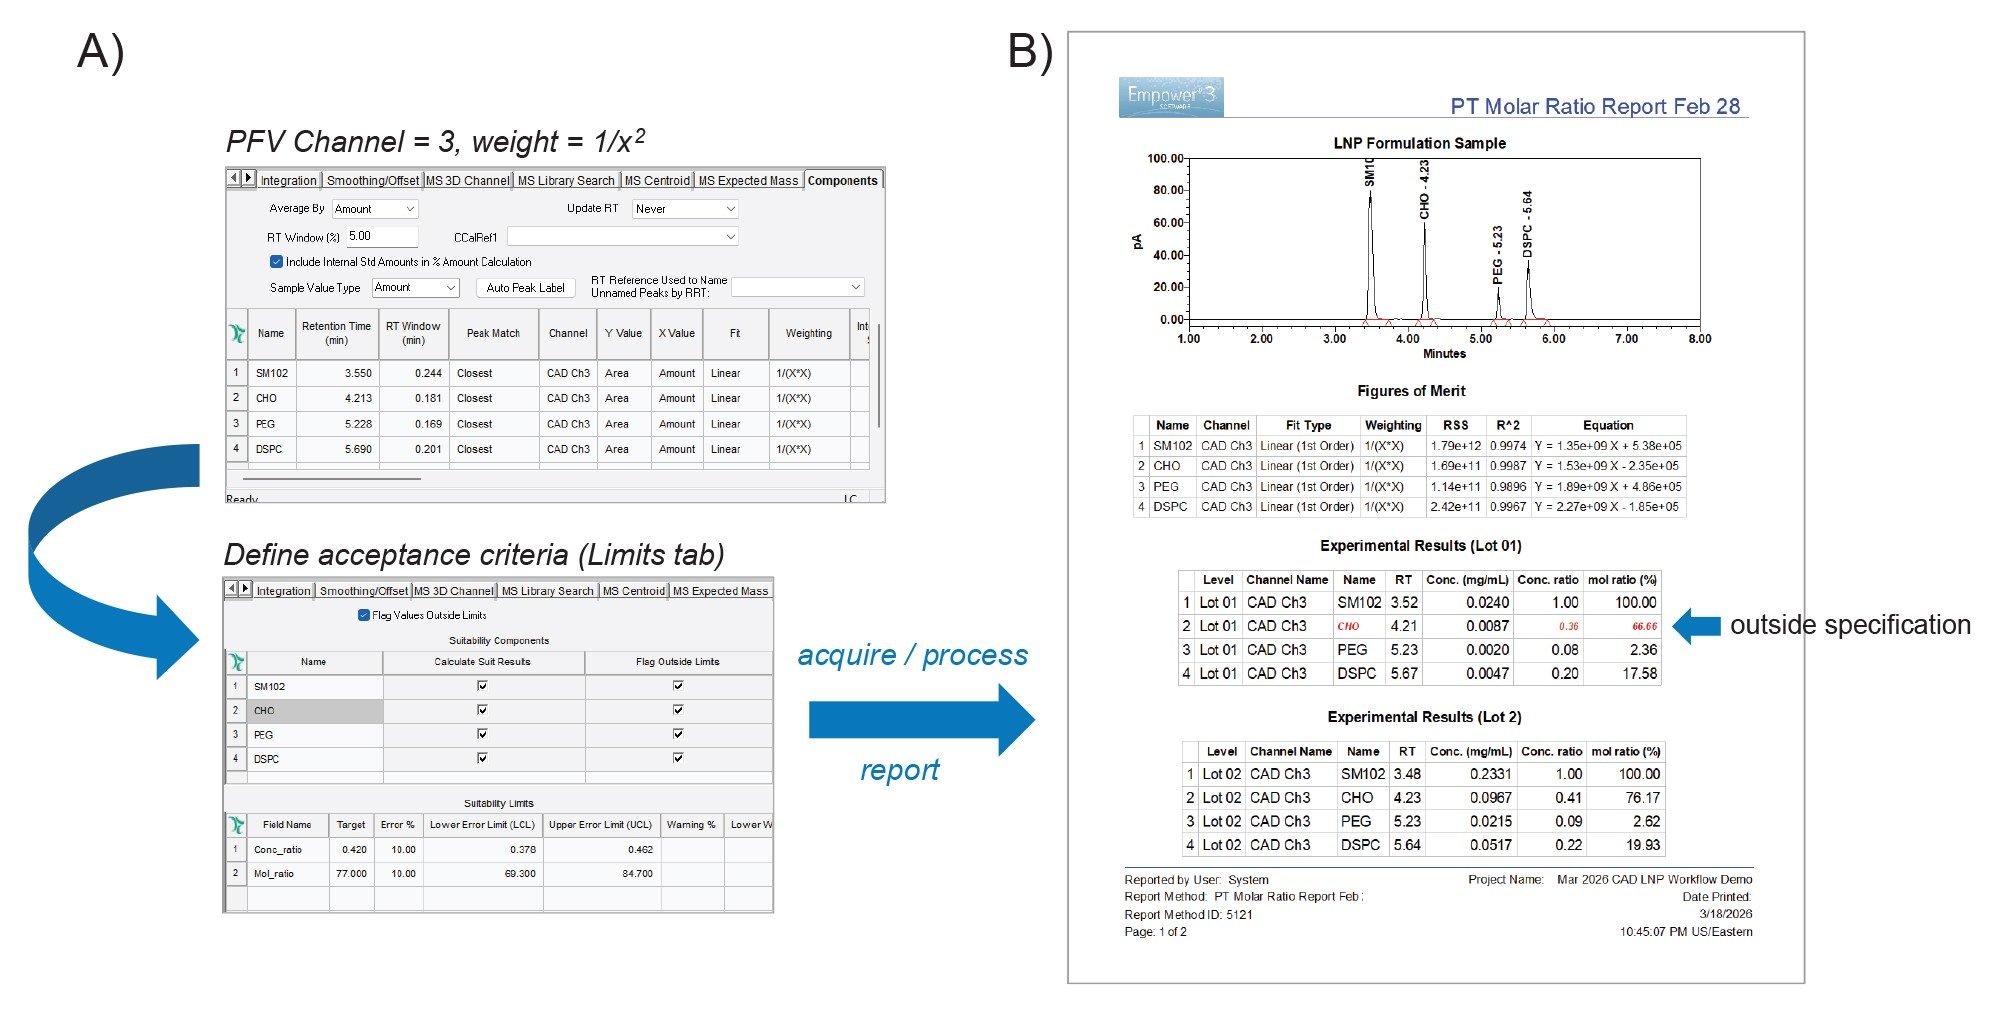
Once identified, optimized acquisition and processing settings, when used in conjunction with predefined acceptance thresholds, enable objective assessment of LNP composition to determine concentration or molar ratio. As shown in Figure 5A, optimized CAD processing parameters are applied to ensure a consistent linear response across lipid components. Acceptance criteria for concentration ratio (Conc_ratio) and molar ratio (Mol_ratio) are defined as custom calculations with thresholds set within the processing method as component‑specific limits and automatically applied following acquisition. As shown in Figure 5B, measured values are directly compared to these thresholds, with components outside the acceptable range clearly flagged in the report. This combined approach enables automated, reproducible determination of whether LNP composition falls within specification, reducing manual data review and supporting routine use in manufacturing and regulated environments.
Conclusion
The ability to evaluate and linearize multiple analyte response curves within the Empower CDS provides several practical benefits for analytical method development, including simplified calibration strategies, improved quantitative robustness, and enhanced suitability for regulated environments. With the proposed structured approach for CAD-based workflows, Empower CDS enables a complete, compliant workflow for CAD method optimization and quantitation featuring rapid analysis, statistical rigor, and full traceability. This framework not only accelerates development of robust quantitative methods for LNP analysis but also reduces reliance on subjective judgment and manual intervention.
References
- Han, D., DeLaney, K., Alden, B., Birdsall, R., Yu, Y. Lipid Nanoparticle Analysis: Leveraging MS to reduce Risk. (2022), Waters Application Note 720007716.
- Fekete S, Doneanu C, Addepalli B, et al. Challenges and emerging trends in liquid chromatography-based analyses of mRNA pharmaceuticals. Journal of Pharmaceutical and Biomedical Analysis. 2023 Feb;224:115174. DOI: 10.1016/j.jpba.2022.115174.
- DeLaney, K., Han, D., Birdsall R., Yu, Y. Optimized ELSD Workflow for Improved Detection of Lipid Nanoparticle Components. (2022), Waters Application Note. 720007740.
- Han, D., Birdsall, R., Simeone, J., Fogwill, M., Yu, Y. Comparing ELSD and CAD Performance on Polysorbate Quantification in Infliximab Drug Products. (2022), Waters Application Note. 720007501.
- Method Development for Improving Lipid Nanoparticle Quantification on Charge Aerosol Detector, Waters Poster, 720009463. 2026.
720009297, April 2026