UV-based Spectral Identity and Purity Confirmation of Antibody-drug Conjugates using the Alliance™ iS Bio PDA HPLC System
Xiangsha Du, Robert E. Birdsall, Karen Nyholm
Waters Corporation, United States
Published on December 05, 2025
Abstract
Antibody-drug conjugates (ADCs) are targeted cancer therapies composed of monoclonal antibodies (mAbs) linked to cytotoxic drugs. In theory, cysteine-based conjugation occurs in even-numbered increments, which can be chromatographically separated using hydrophobic interaction chromatography (HIC) to assess conjugation efficiency and drug-to-antibody ratio (DAR). However, isomers and incomplete conjugations can result in partial co-elution which may impact accurate DAR determination. The Alliance iS Bio PDA HPLC System, equipped with a photodiode array (PDA) detector and Empower™ Software, enhances ADC analysis by capturing full UV-spectrum and chromatographic data. This enables simultaneous monitoring of antibody and drug components, improving the accuracy of DAR calculations by utilizing spectral data to assess the purity and identity of unknown species. The utility of this spectrally enabled workflow was demonstrated using three unique lots of an ADC surrogate.
Benefits
- Access to full-spectrum data using PDA detectors enables the use of peak purity for accurate assessment of conjugation efficiency and DAR values.
- Spectral library matching using full-spectrum data facilitates efficient identification of DAR species for increased confidence in the analysis of ADCs.
- Custom fields and integrated processing parameters within Empower Chromatography Data System (CDS) streamline data processing with automation.
Introduction
ADCs are a class of targeted cancer therapeutics composed of cytotoxic payloads chemically linked to mAbs that selectively bind tumor-associated antigens.1,2 Conjugation typically occurs at lysine or cysteine residues; in the latter case, reduction of interchain disulfide bonds expose thiol groups for drug conjugation in intervals of 2, 4, 6, or 8. Conjugation efficiency coupled with knowledge of potential positional isomers is necessary to accurately determine DAR, a critical quality attribute that influences drug efficacy, safety, and pharmacokinetics.3
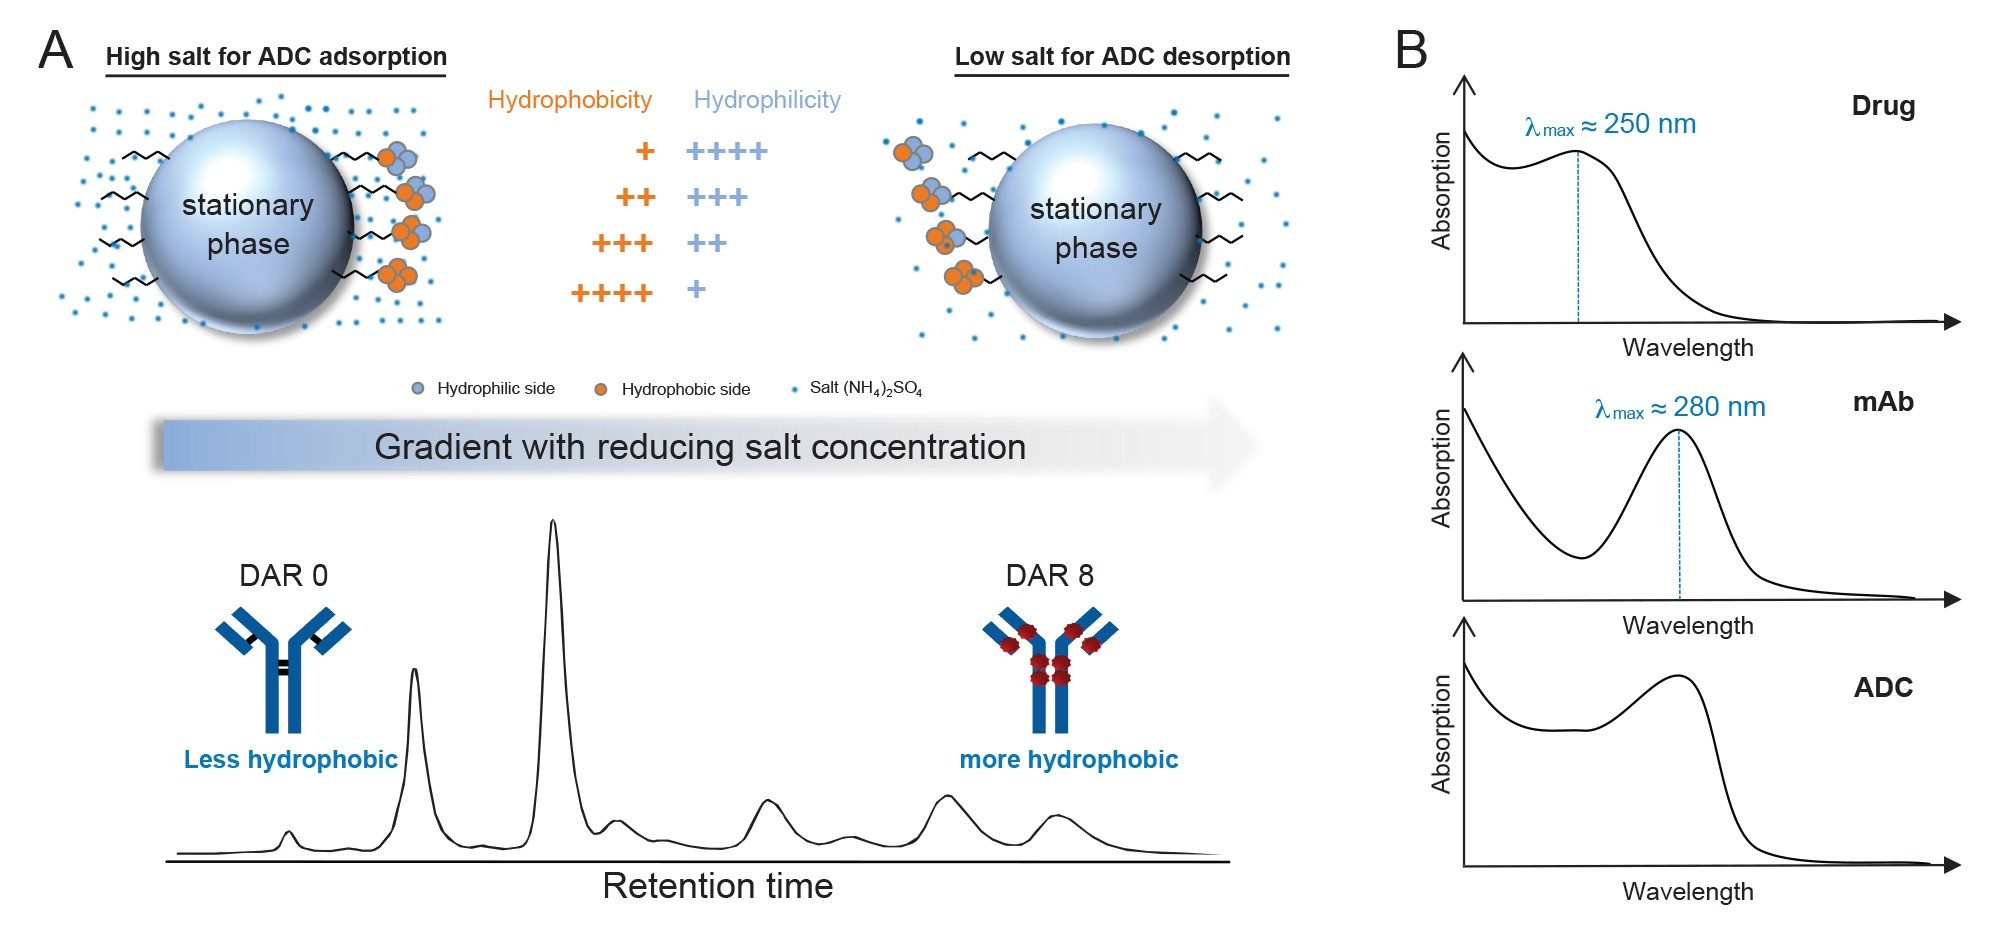
HIC is a robust analytical technique for characterizing ADCs based on drug distribution (Figure 1A).4 Under high-salt conditions, hydrophobic regions of the protein interact with the nonpolar stationary phase, while charged residues remain solvated. ADCs with higher DARs exhibit increased surface hydrophobicity and stronger retention, eluting later as ionic strength decreases. Conversely, species with lower DARs elute earlier. HIC operates under mild, non-denaturing conditions, preserving native protein structure and enabling accurate DAR profiling and assessment of ADC heterogeneity.
To effectively leverage the separation capabilities of HIC for ADC characterization, appropriate analytical instrumentation is essential. The next-generation Alliance iS Bio PDA HPLC System, offers an integrated solution for the analysis of ADCs. The PDA Detector captures full-spectrum absorbance data between a wavelength range of 190–800 nm in a single run, enabling simultaneous monitoring of both the antibody and the cytotoxic drug payload. By collecting 3-dimensional UV data, the system supports efficient separation of ADC samples using HIC with accurate identification of sample composition components through their unique spectral signatures. Purity analysis features integrated within the Empower CDS further enhance data interpretation by assessing spectral homogeneity across chromatographic peaks, revealing peak components or impurities that may be overlooked using traditional single-wavelength UV detection. In addition, the spectral library functionality of Empower CDS allows users to deploy this solution as a platform method to screen unknown samples or as a targeted method to identify isomerized species. In this study, three unique surrogate ADC lots were successfully profiled using the Alliance iS Bio PDA HPLC System, demonstrating its robust capabilities for detailed DAR distribution analysis.
Experimental
Samples
ADC samples were diluted to a concentration of 5 mg/mL in 1.25 M ammonium sulfate.
LC System Conditions
|
LC system: |
Alliance iS Bio HPLC System |
|
Detection: |
PDA Detector, 235–400 nm |
|
Column: |
Protein-Pak™ Hi Res HIC Column (4.6 × 100 mm, 2.5 µm, p/n: 186007583) |
|
Column temperature: |
25 °C |
|
Sample temperature: |
4 °C |
|
Injection volume: |
40 µL |
|
Flow rate: |
0.700 mL/min |
|
Mobile phase: |
A: 125 mM phosphate buffer, pH 6.7 with 2.5 M ammonium sulfate B: 125 mM phosphate buffer, pH 6.7 C: Isopropyl alcohol D: Water |
|
Chromatography software: |
Empower 3 Software |
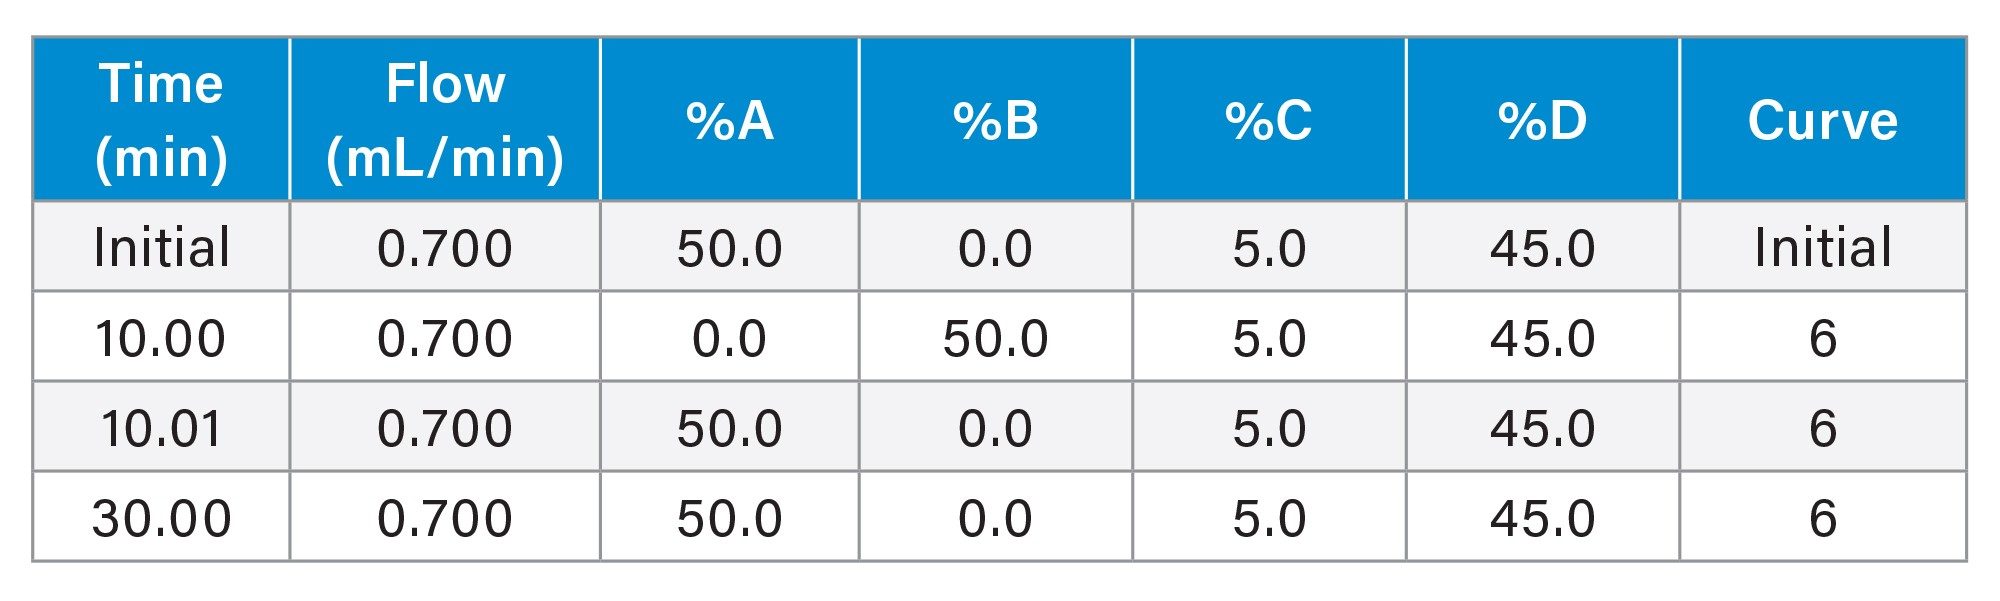
Gradient Table
Results and Discussion
ADC Identification
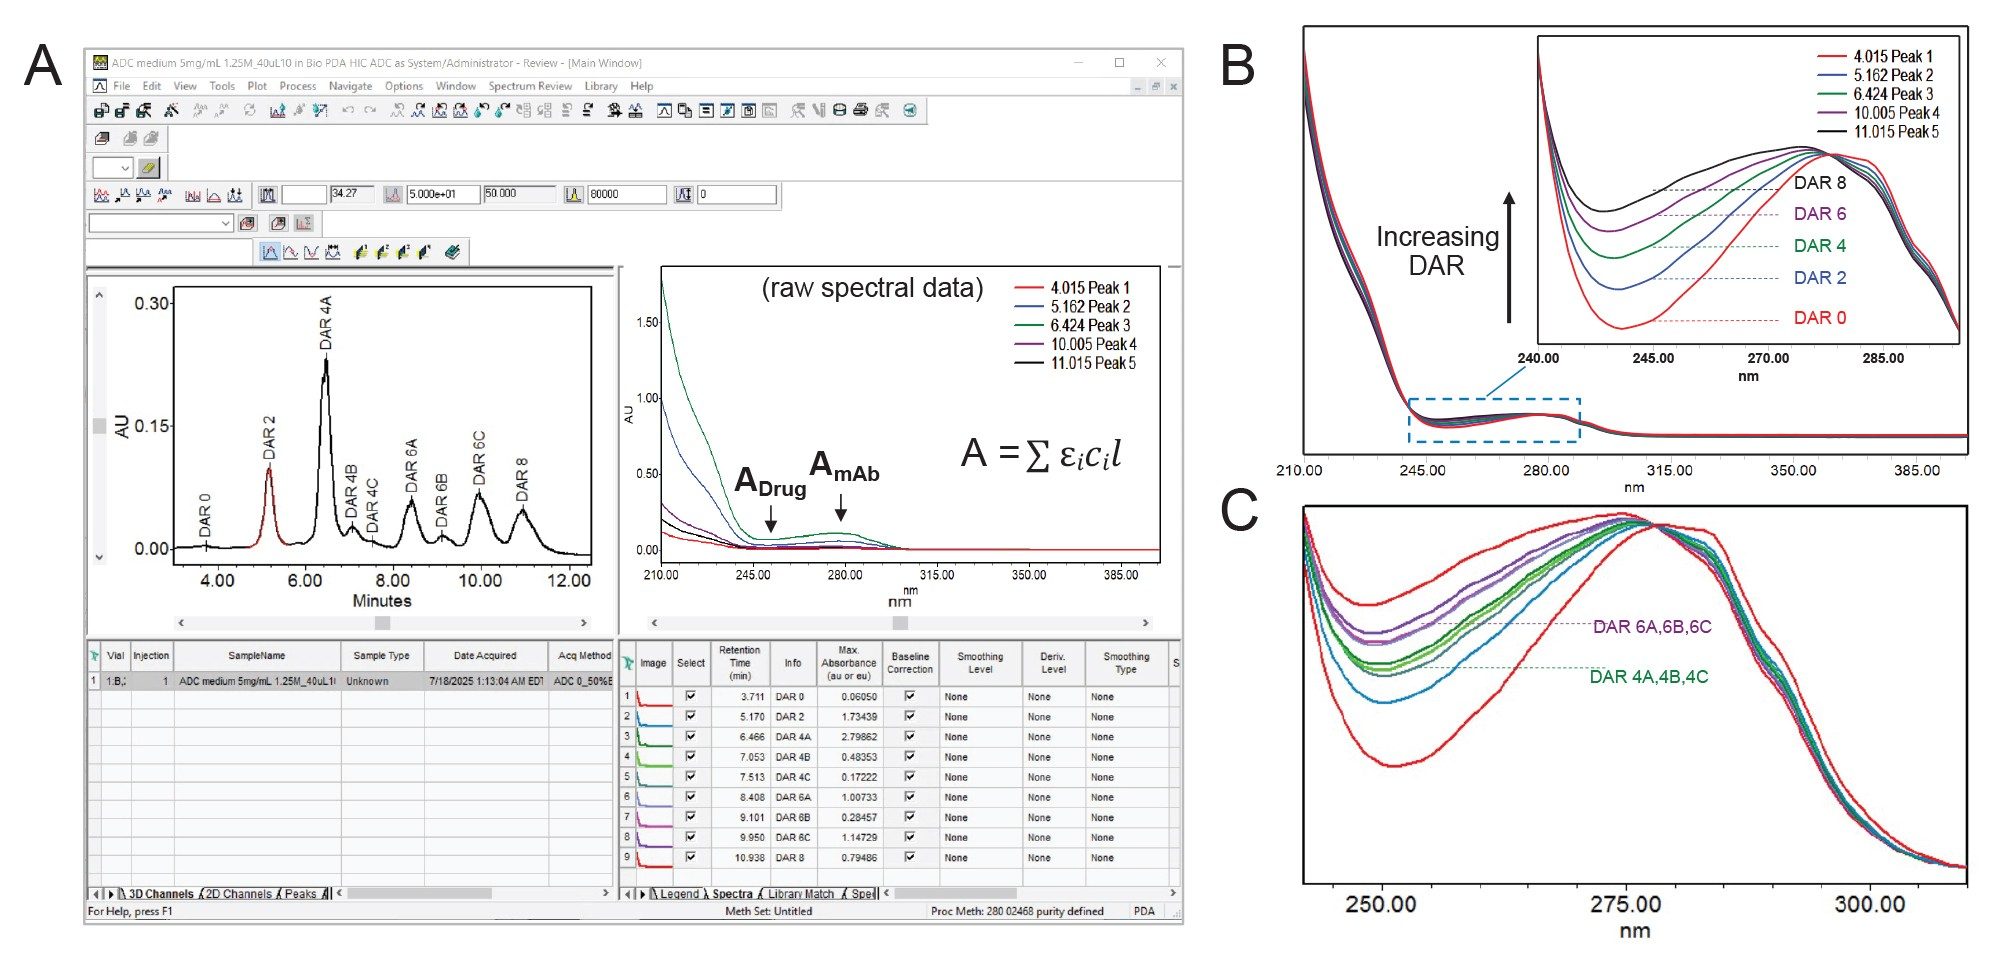
ADCs are complex multicomponent biotherapeutics composed of a mAb linked to a cytotoxic drug. Both of these components exhibit distinct UV absorbance profiles, with the mAb absorbing at 280 nm and the drug around 250 nm.5 These spectra are distinct, non-interacting and additive, meaning the total absorbance of the ADC is the sum of the individual contributions from the mAb and the drug (Figure 1B). By normalizing the spectra at the mAbs absorbance maximum (280 nm), the relative absorbance at the drugs maximum (250 nm) can be used as a qualitative indicator of drug loading. An example of this is demonstrated in Figure 2.
As shown in Figure 2A, the HIC separation of ADCs produces chromatograms with multiple peaks with elution order based on increasing hydrophobicity of the ADC species. To aid in peak identification, UV spectra of the dominant peaks were extracted and normalized at approximately 280 nm. As shown in Figure 2B, the relative absorbance at the drug maximum (~250 nm) increases with retention time, indicating that later eluting peaks correspond to ADC components with higher drug loading and were labeled as such based on literature.4 Using this approach, spectra associated with minor peaks were normalized and plotted together with the major species. As shown in Figure 2C, the additional spectra exhibited good agreement with discreet grouping around major species DAR 4 and DAR 6. Notably, within certain DAR species, positional isomers can emerge due to variability in conjugation sites. In this instance, the minor peaks were labeled as isomeric species DAR 4A, 4B, 4C, and DAR 6A, 6B, 6C, accordingly.
This approach enables comparative spectral analysis across ADC samples, providing insight into DAR distribution. Such spectral comparisons offer a rapid, non-destructive tool for assessing ADC heterogeneity and guiding analytical characterization.
Peak Purity
Empower CDS is a comprehensive analytical platform, well-suited for method development and quality control of drug products. The integrated purity function enables assessment of spectral homogeneity across chromatographic peaks using PDA data. For a pure peak, the UV spectrum remains consistent throughout the elution profile. In contrast, spectral variation across the peak indicates the presence of co-eluting species. This capability is particularly valuable for ADC samples, which consist of complex mixtures with discreet spectral absorbance maximum. Purity analysis aids in detecting co-elution and supports accurate assignment of DAR species.
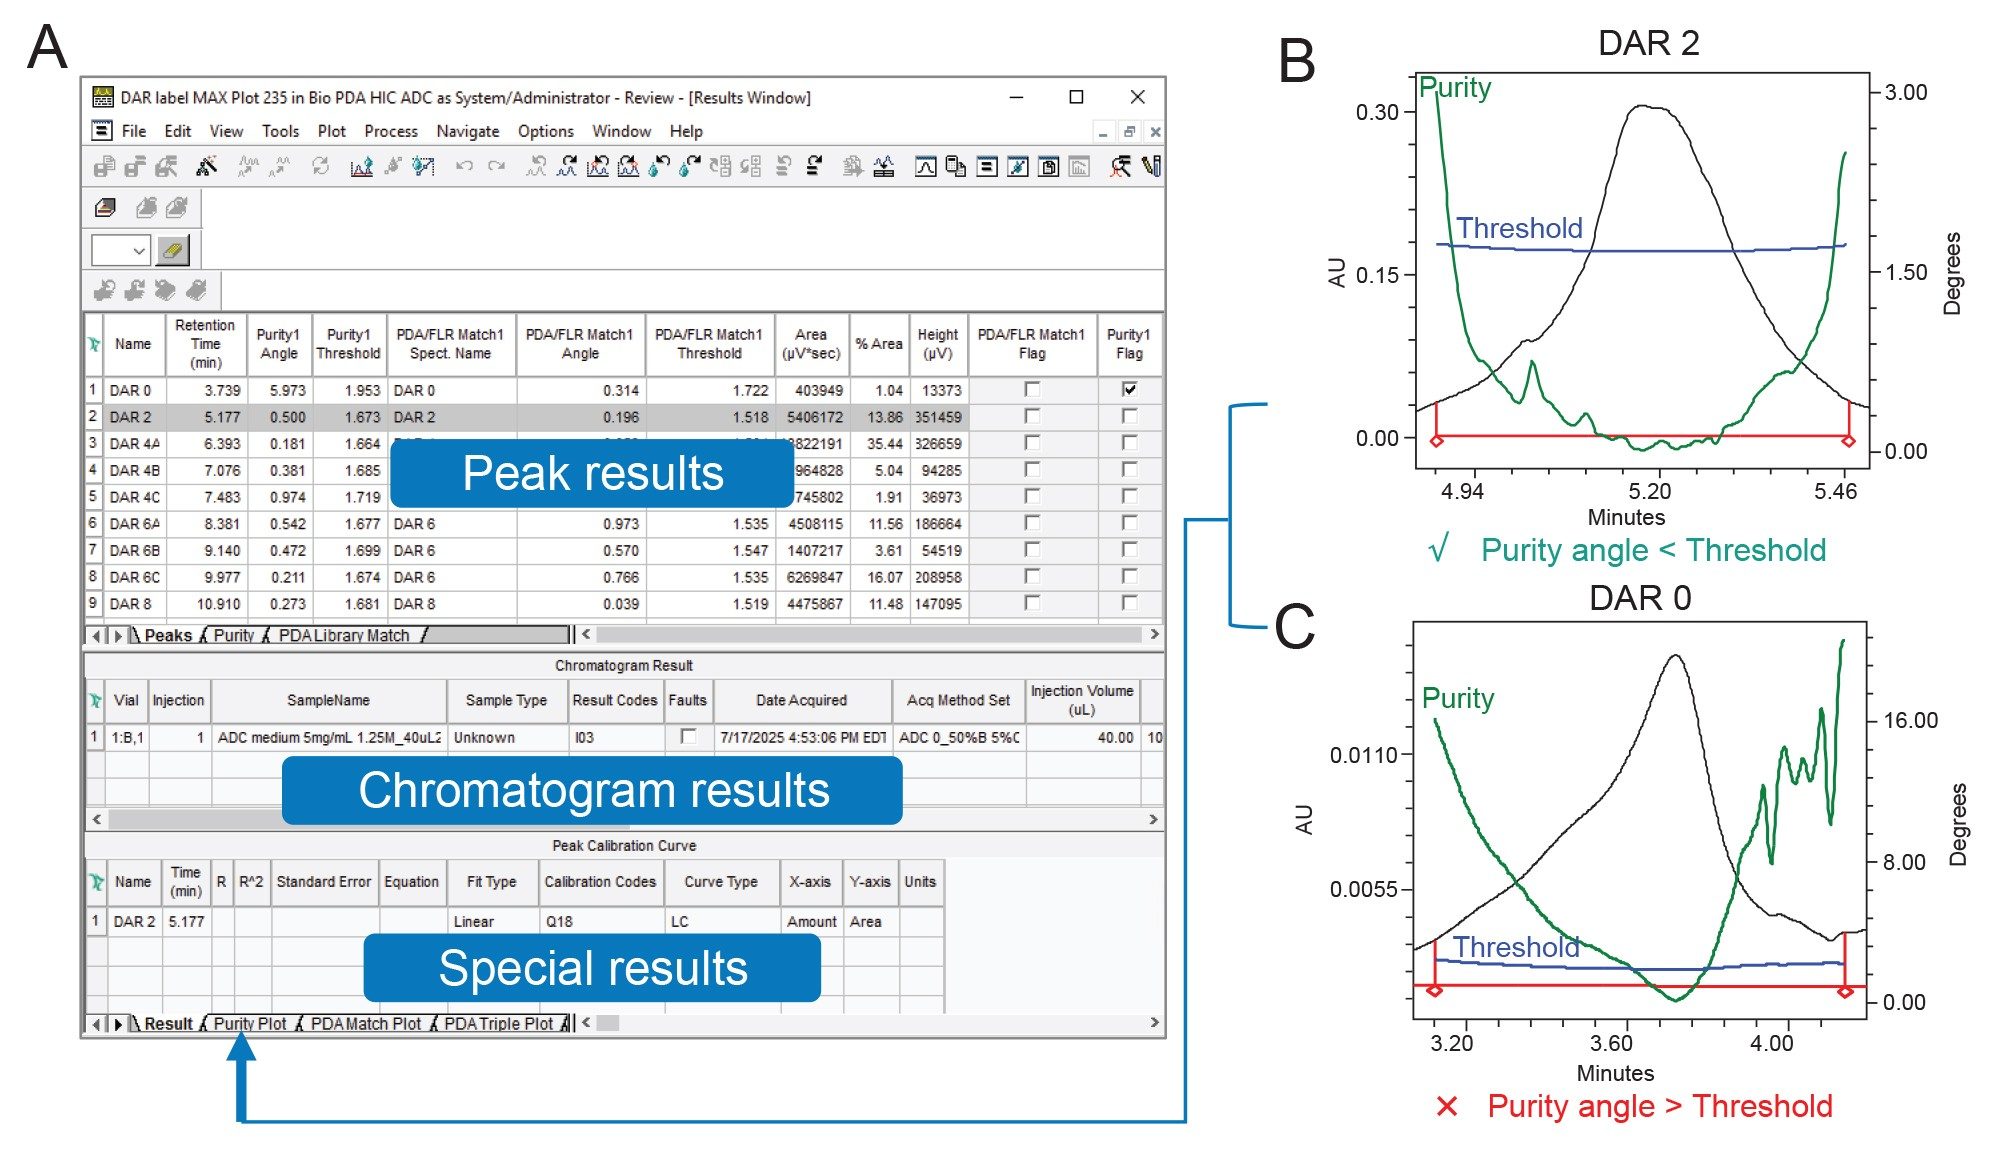
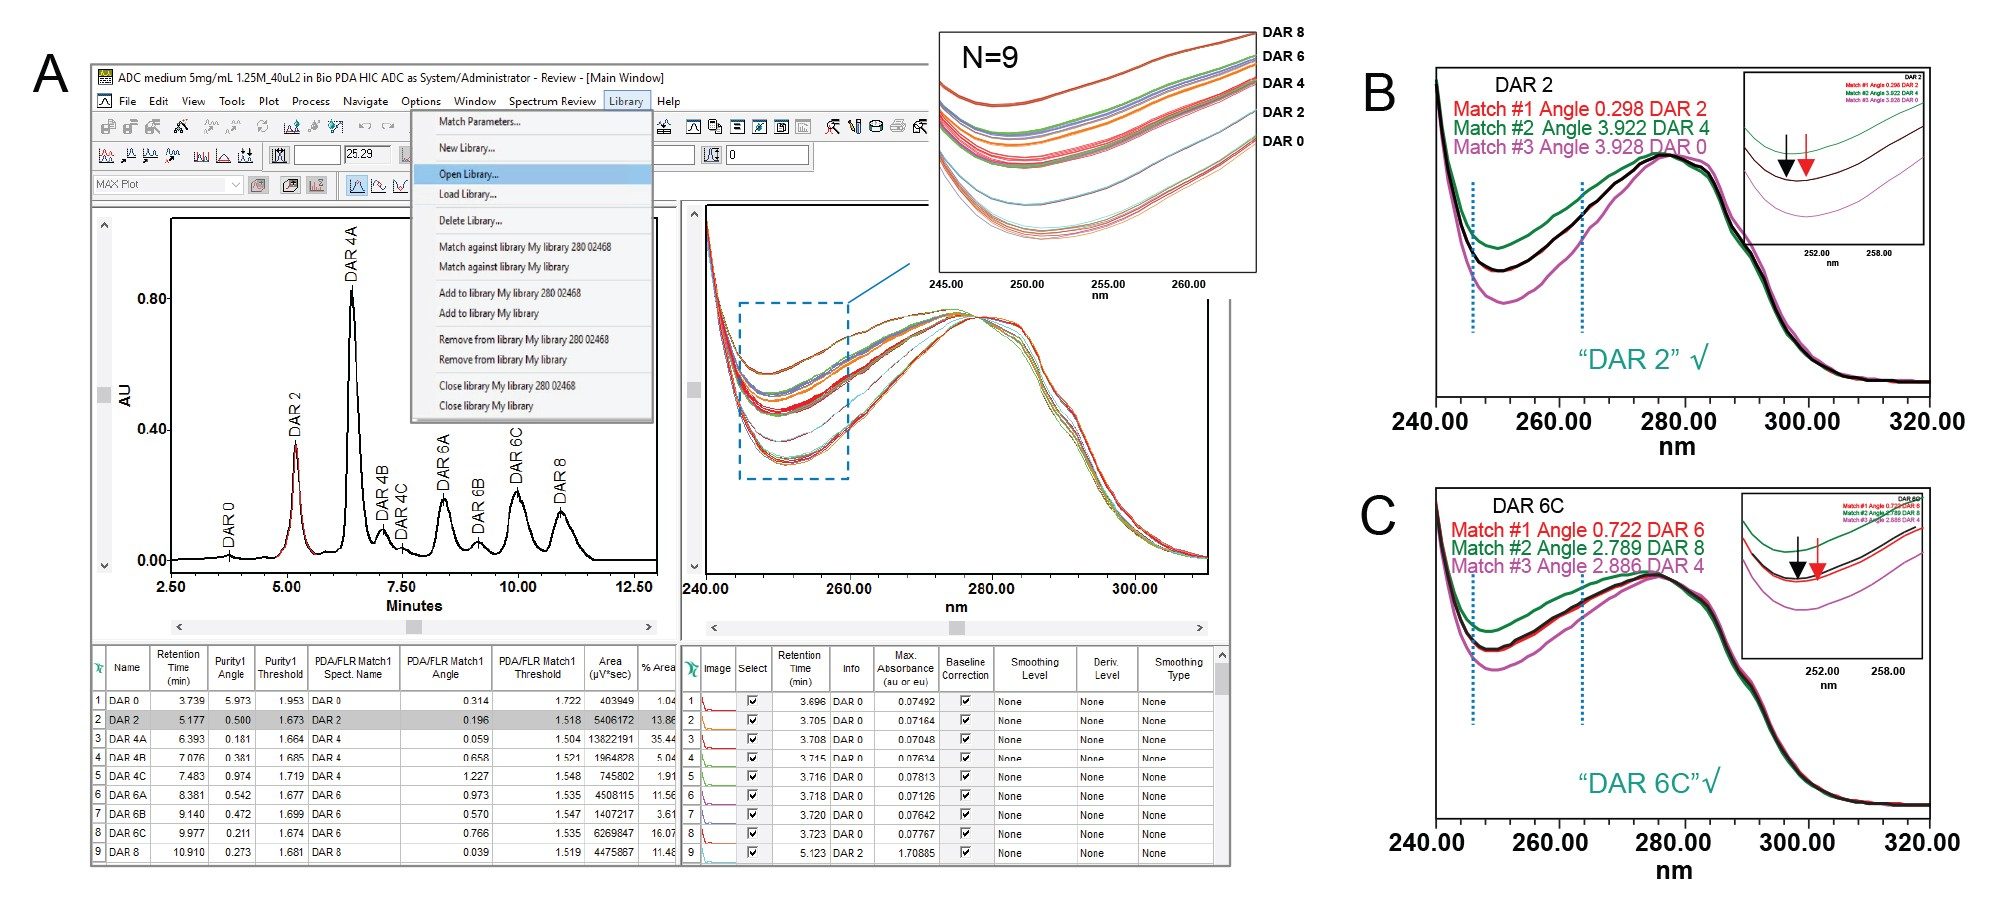
Peak purity parameters are configured within the purity tab of the processing method in Empower. Key settings include spectral wavelength limits and threshold criteria. The purity threshold was established by processing nine standard injections with the threshold set to 'noise', the solvent angle was then defined as the highest purity angle calculated across the nine standards. Notably, the data channel should be set to MAX Plot when processing, ensuring that the maximum absorbance does not exceed 1 AU. Once these parameters are defined, the processed data yields a peak table, accessible via the results window, displaying purity results for each integrated peak (Figure 3A). In this instance, Peak 1 (DAR 0) and Peak 2 (DAR 2) were chosen to demonstrate purity assessment.
A chromatographic peak is considered to meet spectral purity criteria if the purity angle (degrees) is less than the purity threshold. If the purity angle exceeds the threshold, the results are flagged as not meeting the user-defined purity criteria. An example is shown in Figures 3B and 3C for DAR 2 and DAR 0 ADC species, respectively. In these examples, the purity angle (green line) and threshold (blue line) calculations are plotted at each point across the peak (black line). In the DAR 2 peak (Figure 3B), the green purity line remains below the blue threshold throughout the peak, indicating a single component which is passing the purity criteria. In contrast, the DAR 0 peak (Figure 3C) shows the purity angle exceeding the threshold, suggesting the presence of multiple components or an impurity. This is corroborated by the subtle shoulder in the chromatogram (black line), which coincides with the crossover time of the purity trace. This example demonstrates how 3D spectral data obtained from PDA detection in ADC analysis provides valuable insights into composition and purity that may be overlooked by traditional UV detectors.
Spectral Library
The HIC method, combined with full-spectrum UV data, allows users to utilize the spectral library functionality of the Empower CDS for routine quality control and identity confirmation. To test the reproducibility of the spectral profile for library use, nine injections of a surrogate ADC lot were made, and the spectral profiles overlaid for each peak. As shown in Figure 4A, overlaying the normalized spectra from nine injections of ADC samples indicated discreet and reproducible spectral bands corresponding to individual DAR species, including positional isomers 4A, 4B, 4C, and 6A, 6B, 6C. Using this data, a spectral library (Figure 4, pull-down) was created using a representative spectrum from each DAR species. The newly created library was then tested for robustness in its ability to discriminate DAR species.
A unique surrogate ADC lot was separated using HIC and processed with the spectral library functionality enabled within the processing method. With a search depth of 3, the three closest related spectra were retrieved from the library for comparison. Whether the match is acceptable depends on a predefined threshold—similar to the criteria used in the Purity tab. Spectral similarity is statistically shown as the match angle needed to meet the defined Library Match Threshold criteria. An example is shown in Figures 4B and 4C, where the black trace represents the sample spectrum under analysis. In Figure 4B, peak 2 spectra were confirmed to be DAR 2 species based on the low match angle and near identical overlay of the spectral library spectrum (red trace). In this case, the best match in Figure 4B had a match angle of 0.298 for DAR 2, with a 2nd best and 3rd best match angle of 3.922 and 3.928 for DAR 4 and DAR 0, respectively. In Figure 4C, the matched trace exhibits a noticeable gap, yet the spectral library was still able to confirm the spectral profile as DAR 6 albeit with a higher match angle value of 0.722 demonstrating the fidelity of the spectral library to discern DAR species. Once established, the library is universally accessible across all projects within the Empower database, facilitating rapid and accurate confirmation of DAR species as part of method development and manufacturing activities.
DAR Calculation
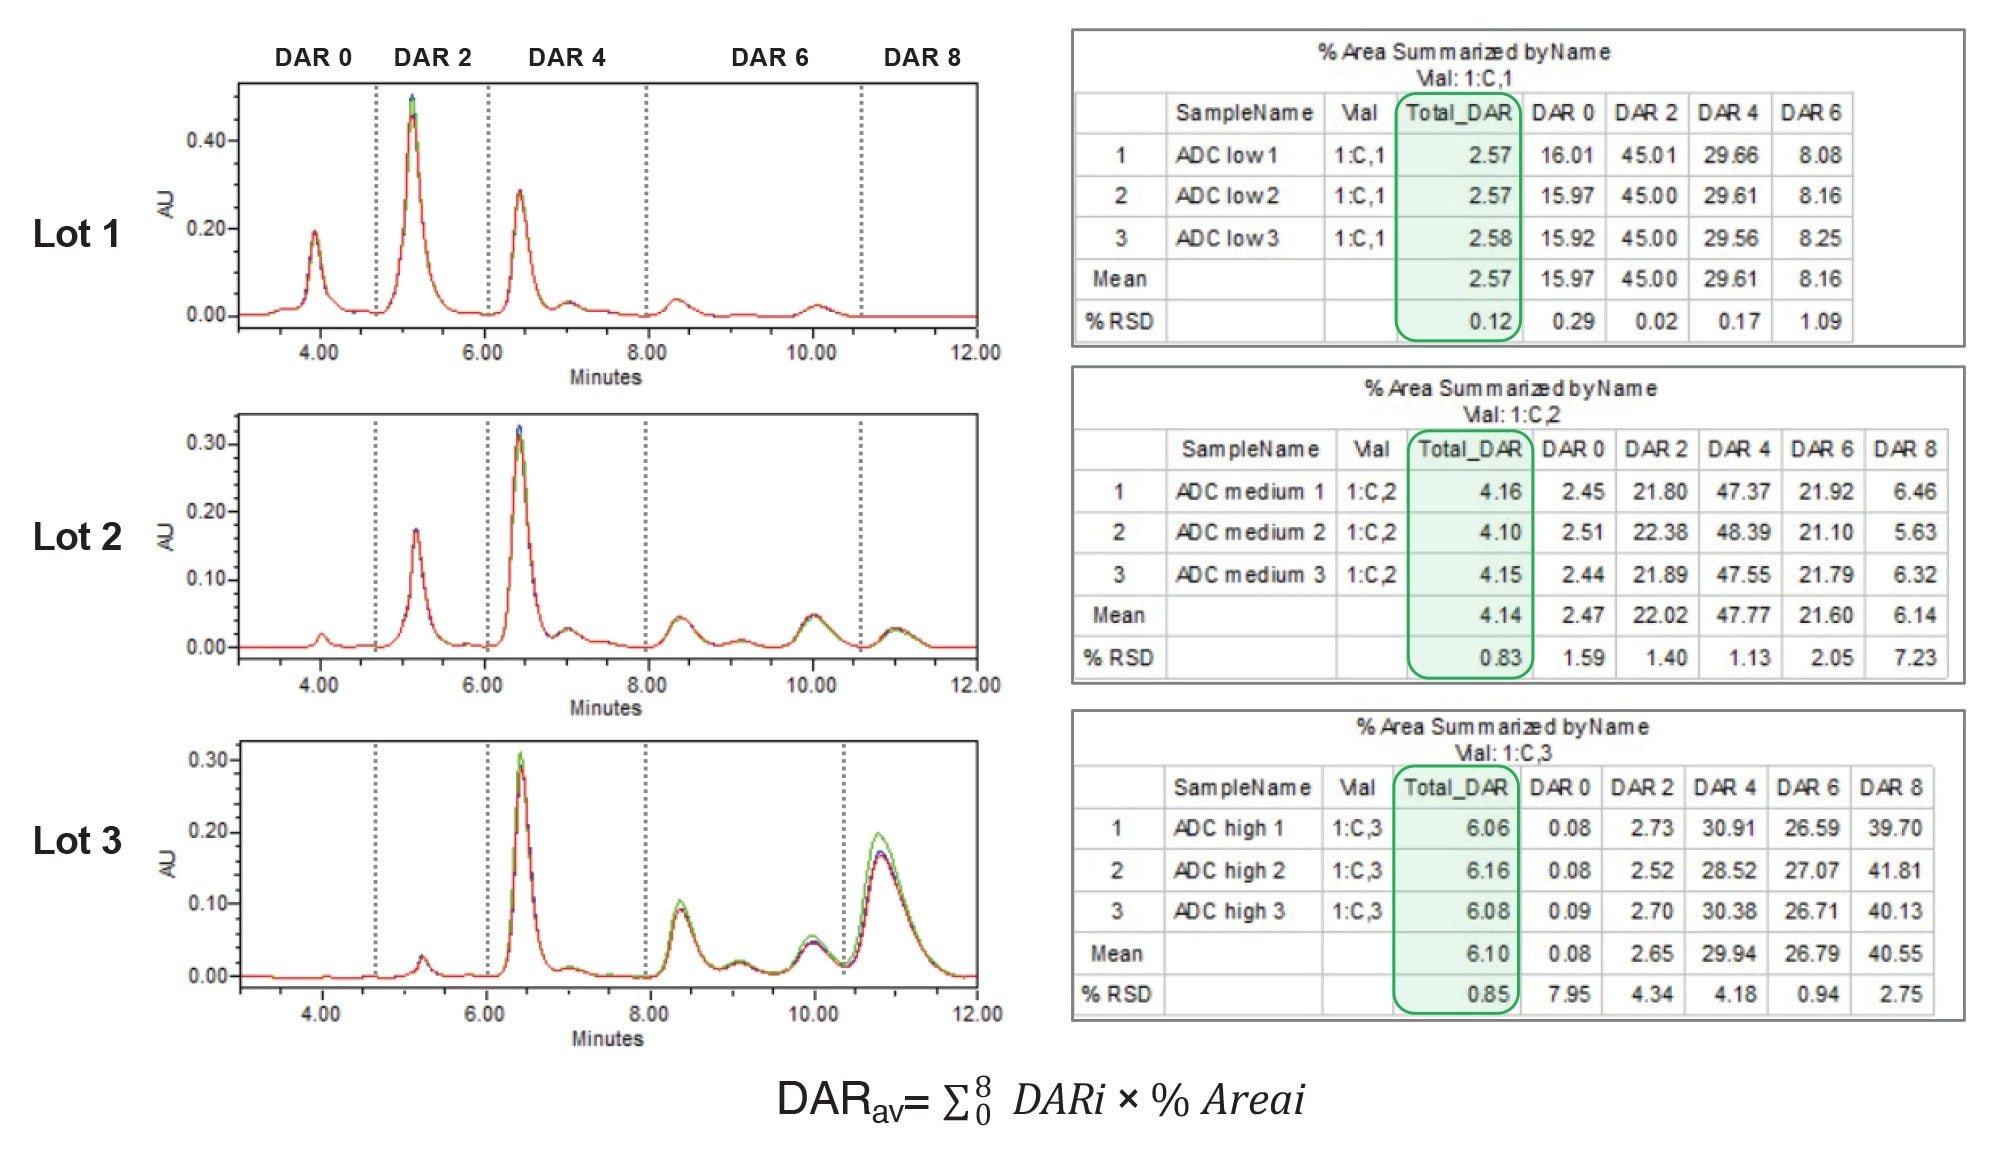
The Empower 3 CDS provides integrated informatics tools that streamline data processing, including the ability to group chromatographic peaks by retention time. In the case of ADCs, this allows for grouping multiple isomeric peaks with their respective drug load categories from DAR 0 to DAR 8. To demonstrate this, 3 unique lots of an ADC surrogate were analyzed and processed using a method adapted from previous work.6 Custom Fields, which can be configured under Project Properties in the System Configuration Manager, were used to automate calculation of Total DAR value for each lot based on peak group Area %. A summary report was generated that includes relative peak areas, total DAR values derived from drug distribution profiles, and key statistical metrics such as mean and %RSD (Figure 5). This automated process streamlines DAR calculations, yielding values of 2.57, 4.14, and 6.10 for Lot 1, Lot 2, and Lot 3 samples, respectively.
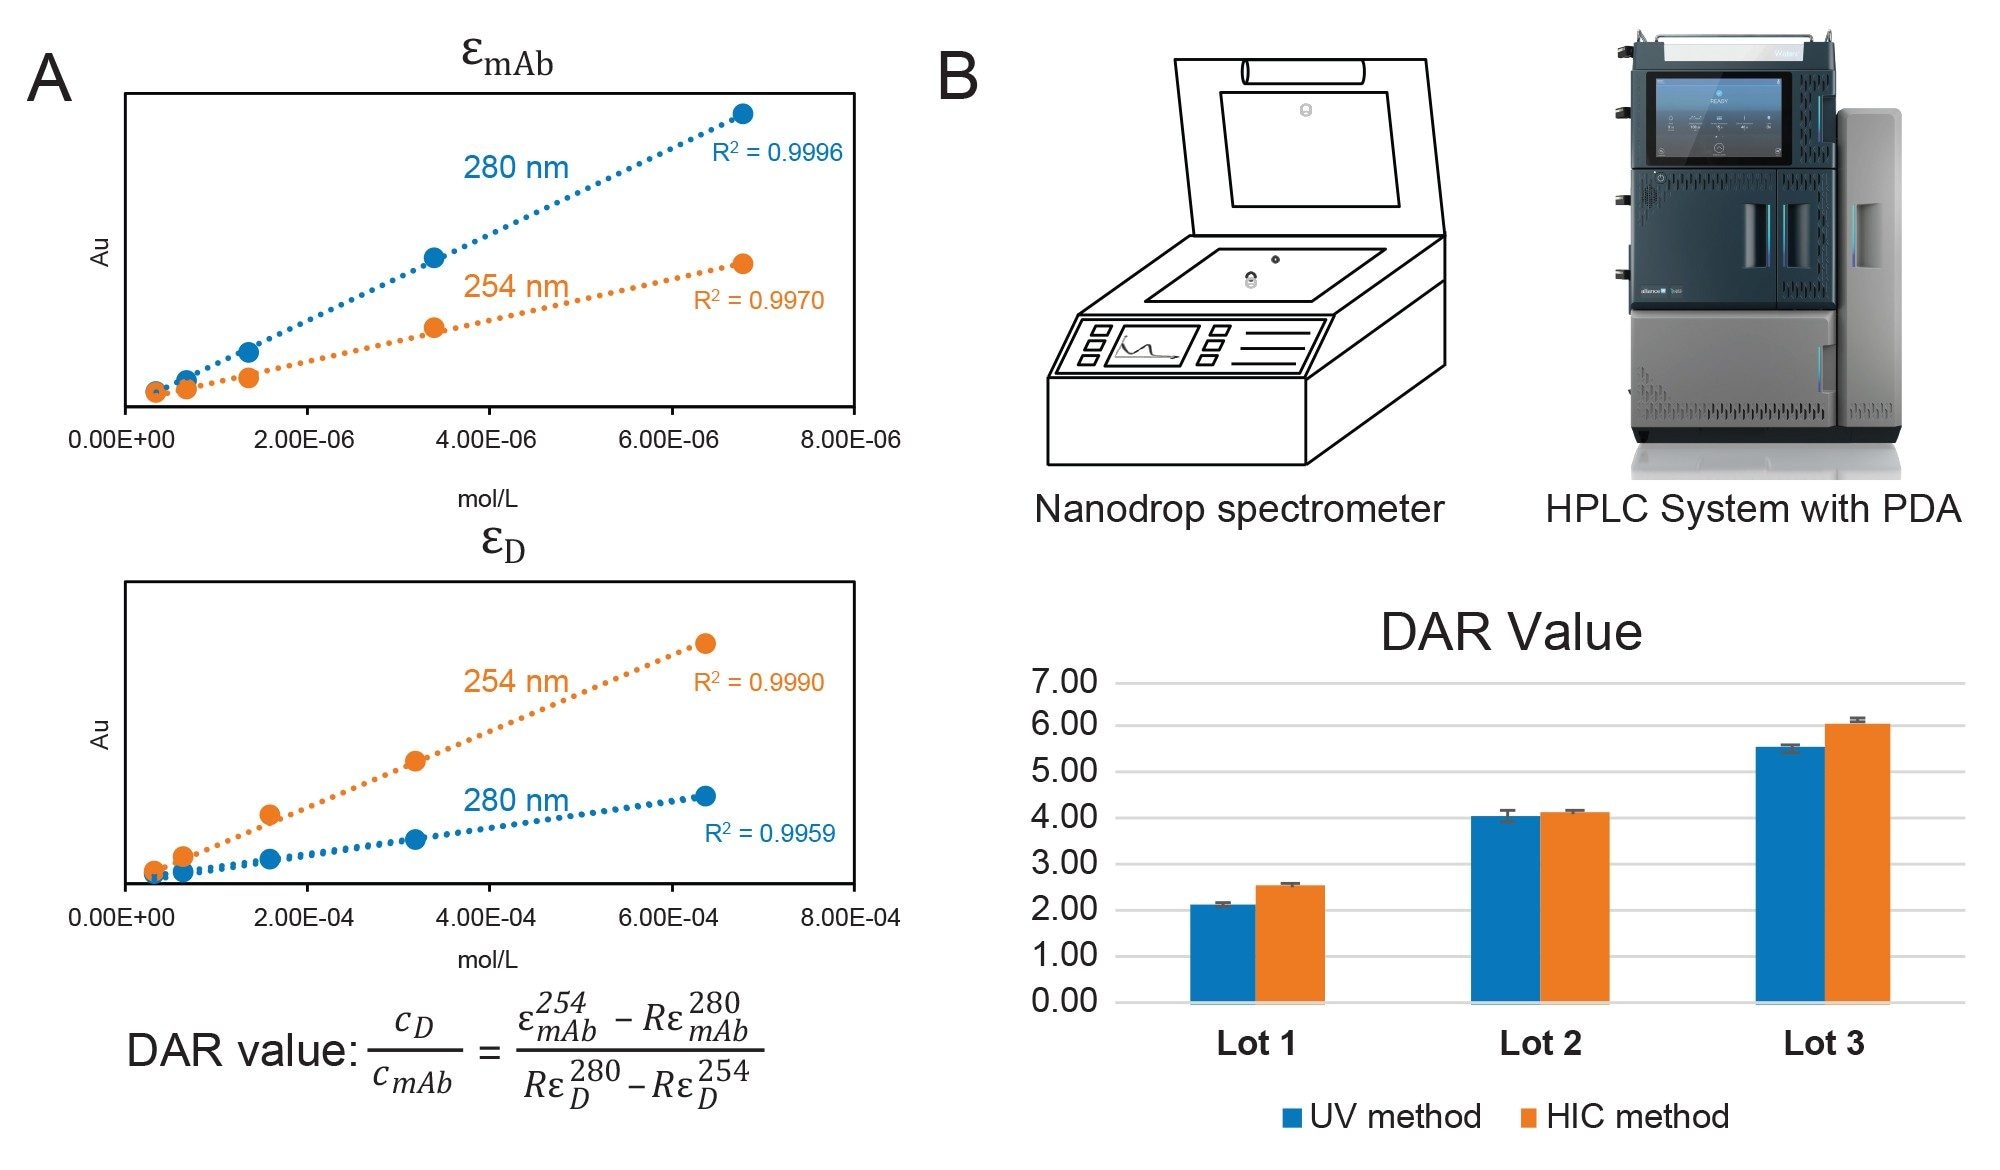
Cross-validation of results was performed using a more traditional method incorporating a UV-Vis spectrophotometer. This method offers a relatively quick and accessible means of estimating drug load based on Beer’s Law, which relates absorbance to concentration and extinction coefficients (Figure 6A). Using empirically determined extinction coefficients with simultaneous equations, the concentrations ratio of drug and mAb components in the ADC sample were experimentally determined to be 2.14, 4.07, and 5.54 for Lot 1–3, respectively. As shown in Figure 6B, the results using a traditional UV-Vis spectrophotometer are comparable to the value obtained through PDA-HIC analysis. The comparable results of the orthogonal UV/Vis method confirms the proposed Empower-based LC-UV method that provides detailed compositional DAR distribution profiles and delivers robust results for routine quality control testing in regulated environments.
Conclusion
Accurate assessment of quality indicating attributes, such as conjugation efficiency and drug-to-antibody ratio, is critical for ensuring therapeutic consistency and performance in ADCs. The Alliance iS Bio PDA HPLC System enables simultaneous acquisition of chromatographic and full-spectrum UV data, streamlining ADC analysis. Coupled with Empower 3 CDS, users have access to features including a spectral library for complementary orthogonal identification and purity assessment, as well as a comprehensive suite of reporting capabilities for documentation and traceability to meet regulatory needs. Together, this integrated Empower-based LC-UV workflow enables high-resolution DAR profiling and enhanced quality control in biopharmaceutical development of ADCs.
References
- Junutula, J., Raab, H., Clark, S., et al. Site-specific conjugation of a cytotoxic drug to an antibody improves the therapeutic index. Nat Biotechnol, 2008, 26, 925–932.
- Perez, H. L., Cardarelli, P. M., Deshpande, S., Gangwar, S., Schroeder, G. M., Vite, G. D., Borzilleri, R. M. Antibody-drug conjugates: current status and future directions. Drug Discov Today, 2014, 19(7), 869–881.
- Qiu, C., Chen, S. Determination of drug-to-antibody ratio of ADCs. In: Chen, S., Zhan, J. (Eds.), Antibody-Drug Conjugates and Cellular Metabolic Dynamics. Springer, Singapore, 2023.
- Birdsall, R. E., McCarthy, S. M., Janin-Bussat, M. C., Perez, M., Haeuw, J. F., Chen, W., Beck, A. A sensitive multidimensional method for the detection, characterization, and quantification of trace free drug species in antibody-drug conjugate samples using mass spectral detection. mAbs, 2016, 8(2), 306–317.
- Chen, Y. Drug-to-antibody ratio (DAR) by UV/Vis spectroscopy. In: Ducry, L. (Ed.), Antibody-Drug Conjugates. Methods in Molecular Biology, vol 1045. Humana Press, Totowa, NJ, 2013.
- Shion, H., Birdsall, R. E., Cubbedge, S., Chen, W. Development of integrated informatics workflows for the automated assessment of comparability for antibody drug conjugates (ADCs) using LC-UV and LC-UV/MS. Waters Application Note, 2015, 720005366.
Featured Products
720009169, December 2025