Application Brief
This is an Application Brief and does not contain a detailed Experimental section.
Robert Plumb, Peter Christensen, Nikunj Tanna
Waters Corporation, United States
Published on December 05, 2025
This is an Application Brief and does not contain a detailed Experimental section.
Confirming the identity of drug-related metabolites is a key task in drug development studies, such as inter species/gender comparison, and is often a complex, time-consuming task. LC-MS Toolkit and MassFragment™ are powerful post-acquisition processing tools in waters_connect for Quantitation Software, which, when combined with LC–tandem quadrupole mass spectrometry (MS), facilitates the rapid comparison of samples and confirmation of metabolite identity. LC-MS Toolkit and MassFragment were used to evaluate and confirm the structure of three in vivo desmethyl O-glucuronide metabolites of methapyrilene (MP) formed following oral administration to male rats.
Drug metabolite identification, profiling, and quantification are essential parts of candidate drug evaluation in preclinical and human safety and efficacy studies. Metabolite identification is usually performed with high-resolution mass spectrometry (HRMS), alone or in combination with nuclear magnetic resonance (NMR), with quantification performed by tandem quadrupole MS.1,2 In dose escalation, repeat dosing, species comparison, gender comparison, microsomal incubation, fed-fast, formulation comparison, and other studies, metabolite peak confirmation can be efficiently performed via tandem quadrupole mass spectrometry using MS acquisition functions such as precursor or product ion scanning. Confirming the identity of drug metabolites is usually performed via a comparison of peak retention time (tR), m/z value, and evaluation of the peak MS2 spectrum. The ability to rapidly confirm that the derived MS2 spectrum is consistent with the proposed molecular structure significantly simplifies the task of metabolite profiling.
LC-MS Toolkit and MassFragment are powerful spectral comparison and structural evaluation functions within waters_connect for Quantitation Software, which can be used to quickly compare samples and confirm that the MS2 spectrum of a drug metabolite is consistent with the proposed structure. This application note describes the application of LC-MS ToolKit to compare the extracted ion chromatograms generated from the +ve ESI product ion scanning of rat urine following the oral administration of methapyrilene (MP). The derived MS2 spectra were analysed using MassFragment to confirm the identity of the drug metabolite and localization of the site of metabolism.
MP is a H1-receptor antagonist, shown to cause drug-induced liver injury (DILI) in adult male rats. MP is converted to a range of metabolites via demethylation, N-oxidation, O-glucuronidation, and oxidative N-dealkylation of the thienylmethyl-moiety. Rat urine was obtained from a 5-day repeat dose study in male Wistar rats following the oral administration of MP at 50 and 150 mg/Kg/day (see Wilson et-al J.Pharma, Biomed. Anal).3 The urine samples were collected on ice and stored frozen at -20 °C prior to analysis. The samples were prepared by protein precipitation with acetonitrile (1:2, sample:solvent); following centrifugation (9,000g), the resulting samples were diluted 1:10 for analysis by UPLC-MS/MS.
The urine samples (1 µL) were analyzed using reversed–phase chromatography on a 2.1 x 50 mm CORTECS™ C18 2.7 µm chromatography Column. The column was maintained at 40 °C and eluted with a linear gradient of 5–40% B over 10 minutes at 600 µL/min using aqueous 0.1% formic acid as mobile phase solvent A and 0.1% formic acid in 95:5 (v/v) acetonitrile:water as mobile phase B.
The column effluent was monitored by +ve ESI using the Waters Xevo™ TQ Absolute XR Mass Spectrometer operating in product ion scanning mode. The cone voltage was set to 25 V and a collision energy of 30 eV was used for all experiments. Product ion scanning was performed for the precursor masses m/z = 262 and 440 over the mass range m/z = 50–550, relating to the dosed compound, and desmethyl glucuronide metabolite of MP, respectively.
Instrument control and data analysis was performed using waters_connect for Quantitation Software (including, acquisition method editor and sample submission) and waters_connect LC-MS Toolkit.
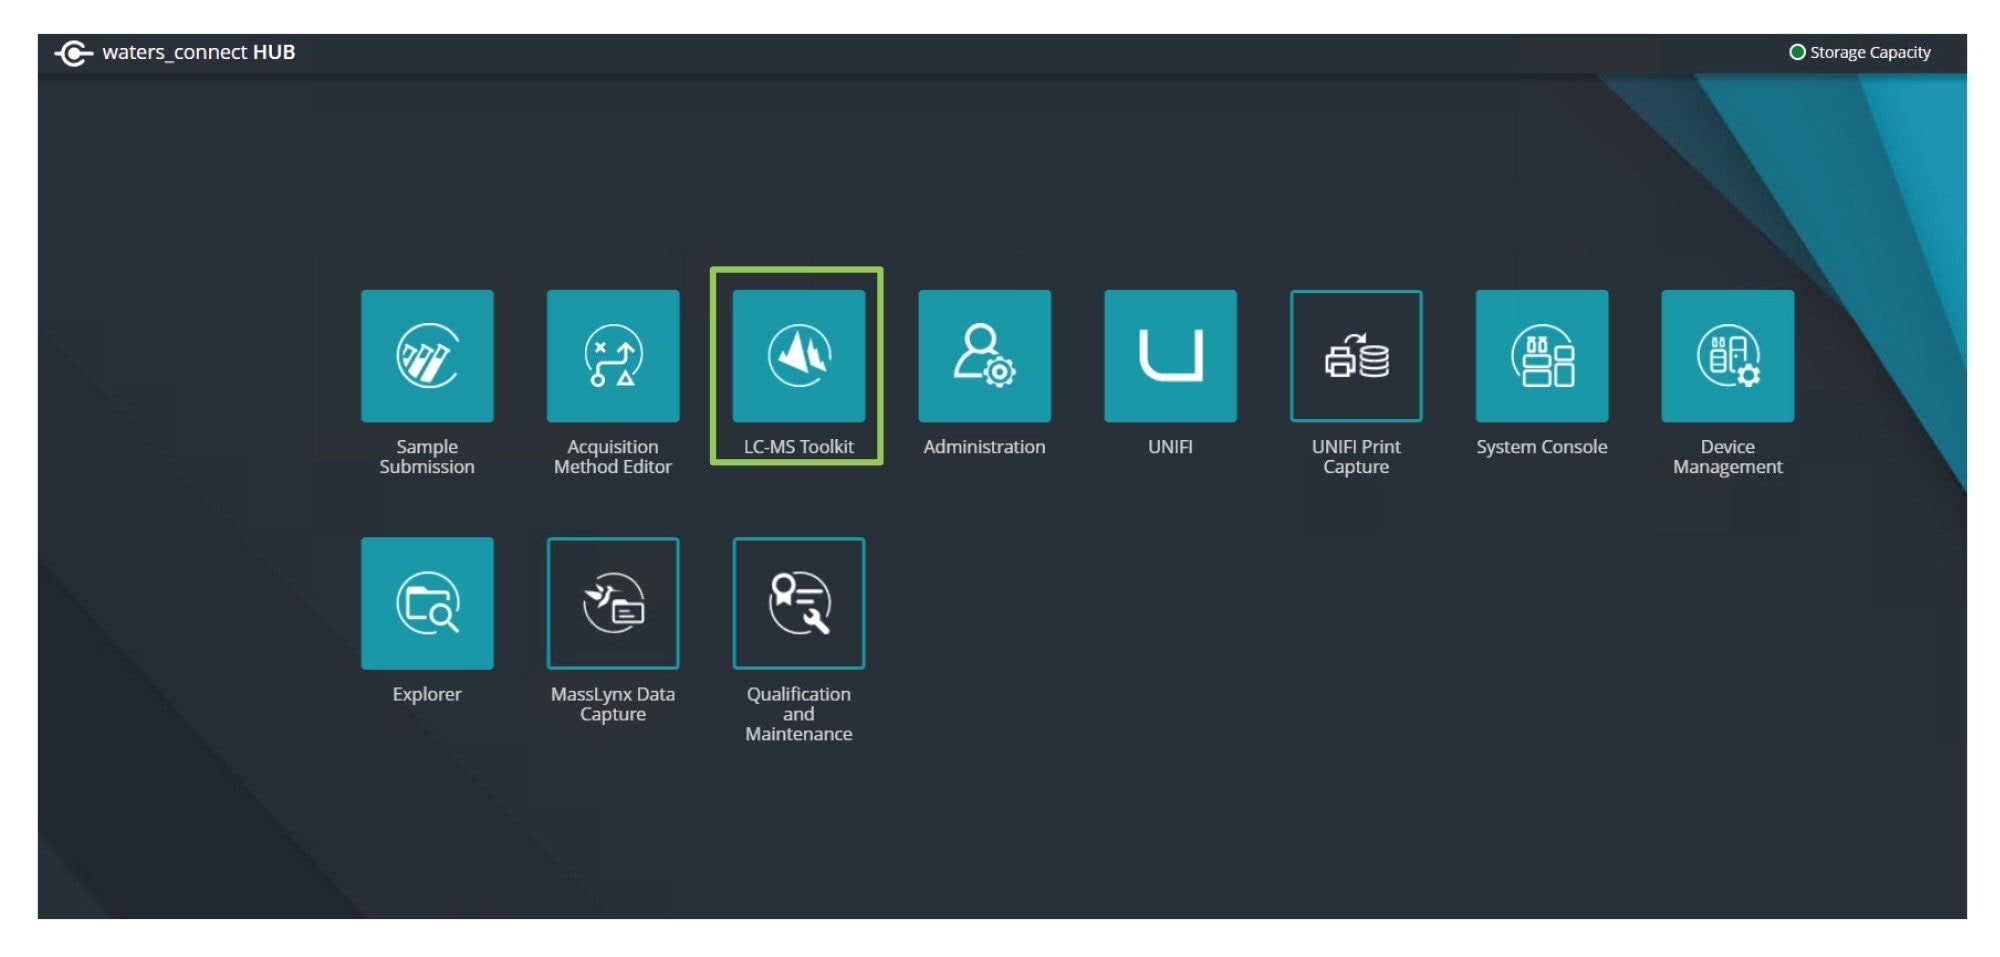
LC-MS Toolkit enables the visualization, comparison, and investigation of sample chromatograms and MS spectrum acquired in LC-MS experiments. LC-MS data can be compared for the analysis of samples from a single sample set or between batches to evaluate QCs, system suitability samples, control Vs dosed, and various MS conditions. Once the LC-MS Toolkit is opened from the waters_connect hub, a new data session can be started or a previous session can be reopened (Figure 1).
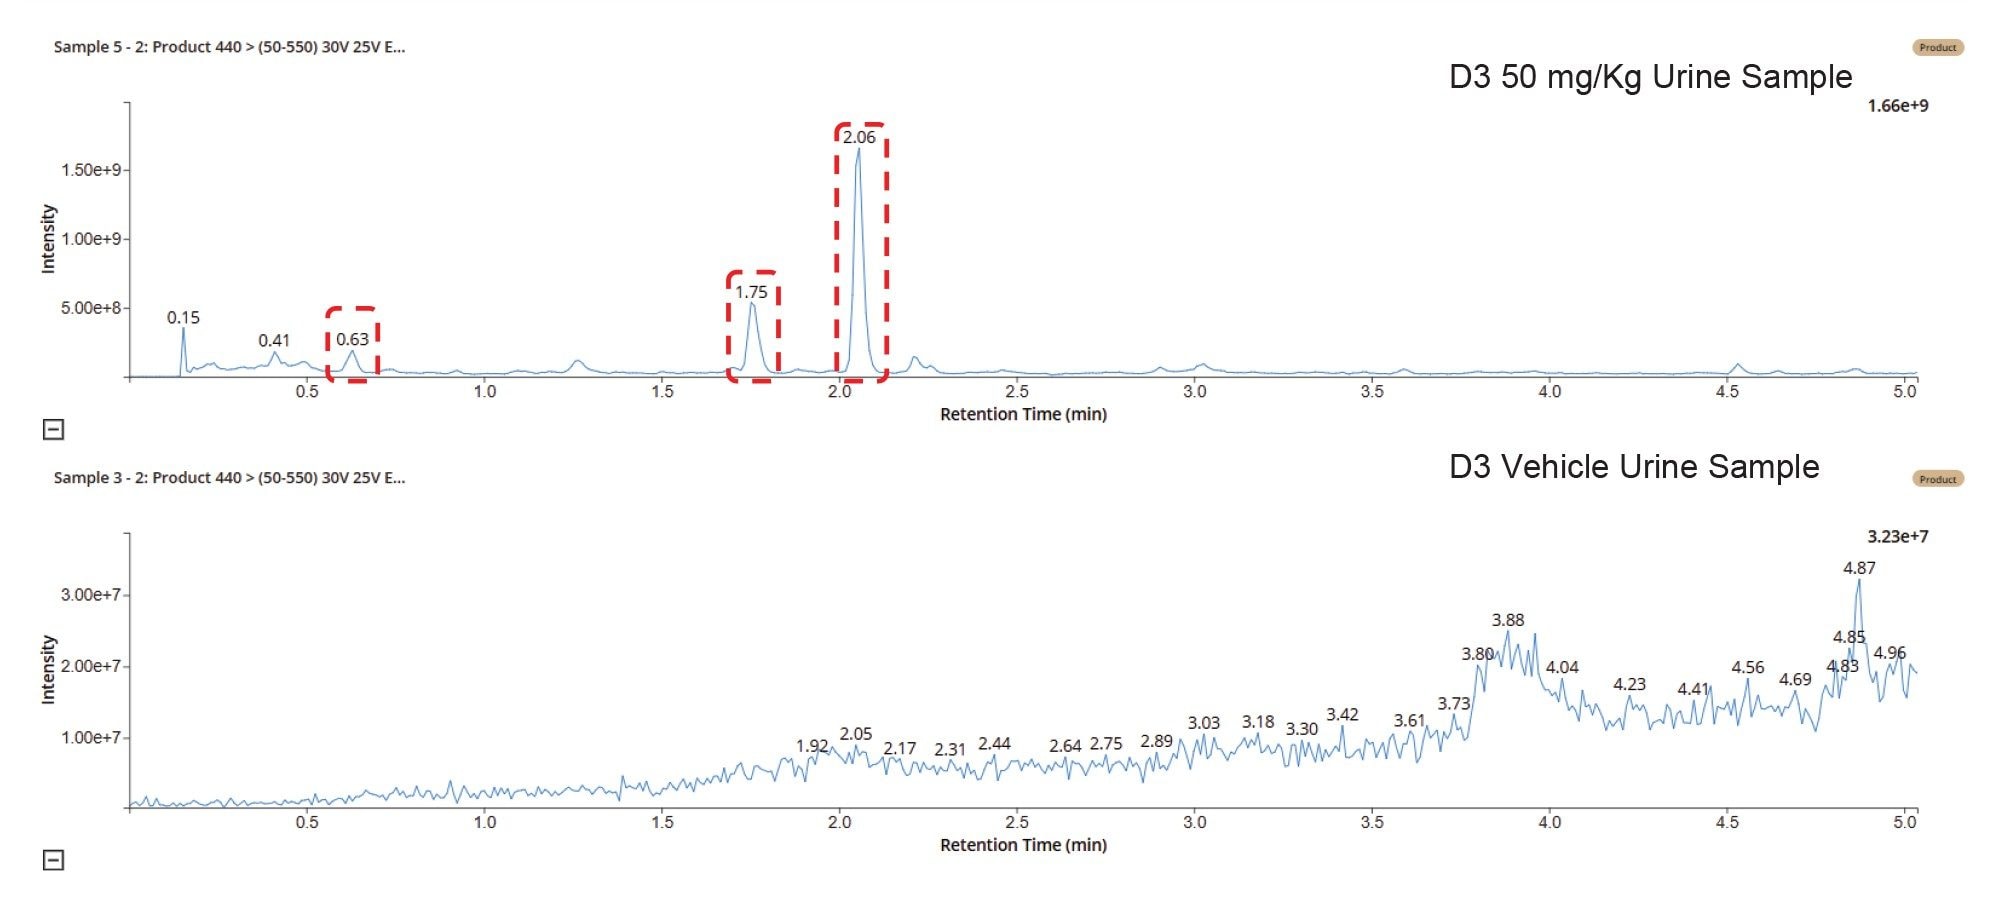
Within the LC-MS Toolkit, data from an individual LC-MS acquisition, MRM transitions, or m/z value can be reviewed and investigated, or data from multiple injections, MRMs, or m/z compared. The example shown in Figure 2 illustrates the comparison of a vehicle-only dosing and 50 mg/Kg dosed sample on Day 3 for the signal corresponding to the desmethyl O-glucuronide metabolite of MP (m/z = 440). It is clear from this data that there are 3 potential drug-related metabolites in the dosed sample eluting at tR = 0.6, 1.7, and 2.1 min, suggesting that metabolism is occurring at more than one site on the molecule.
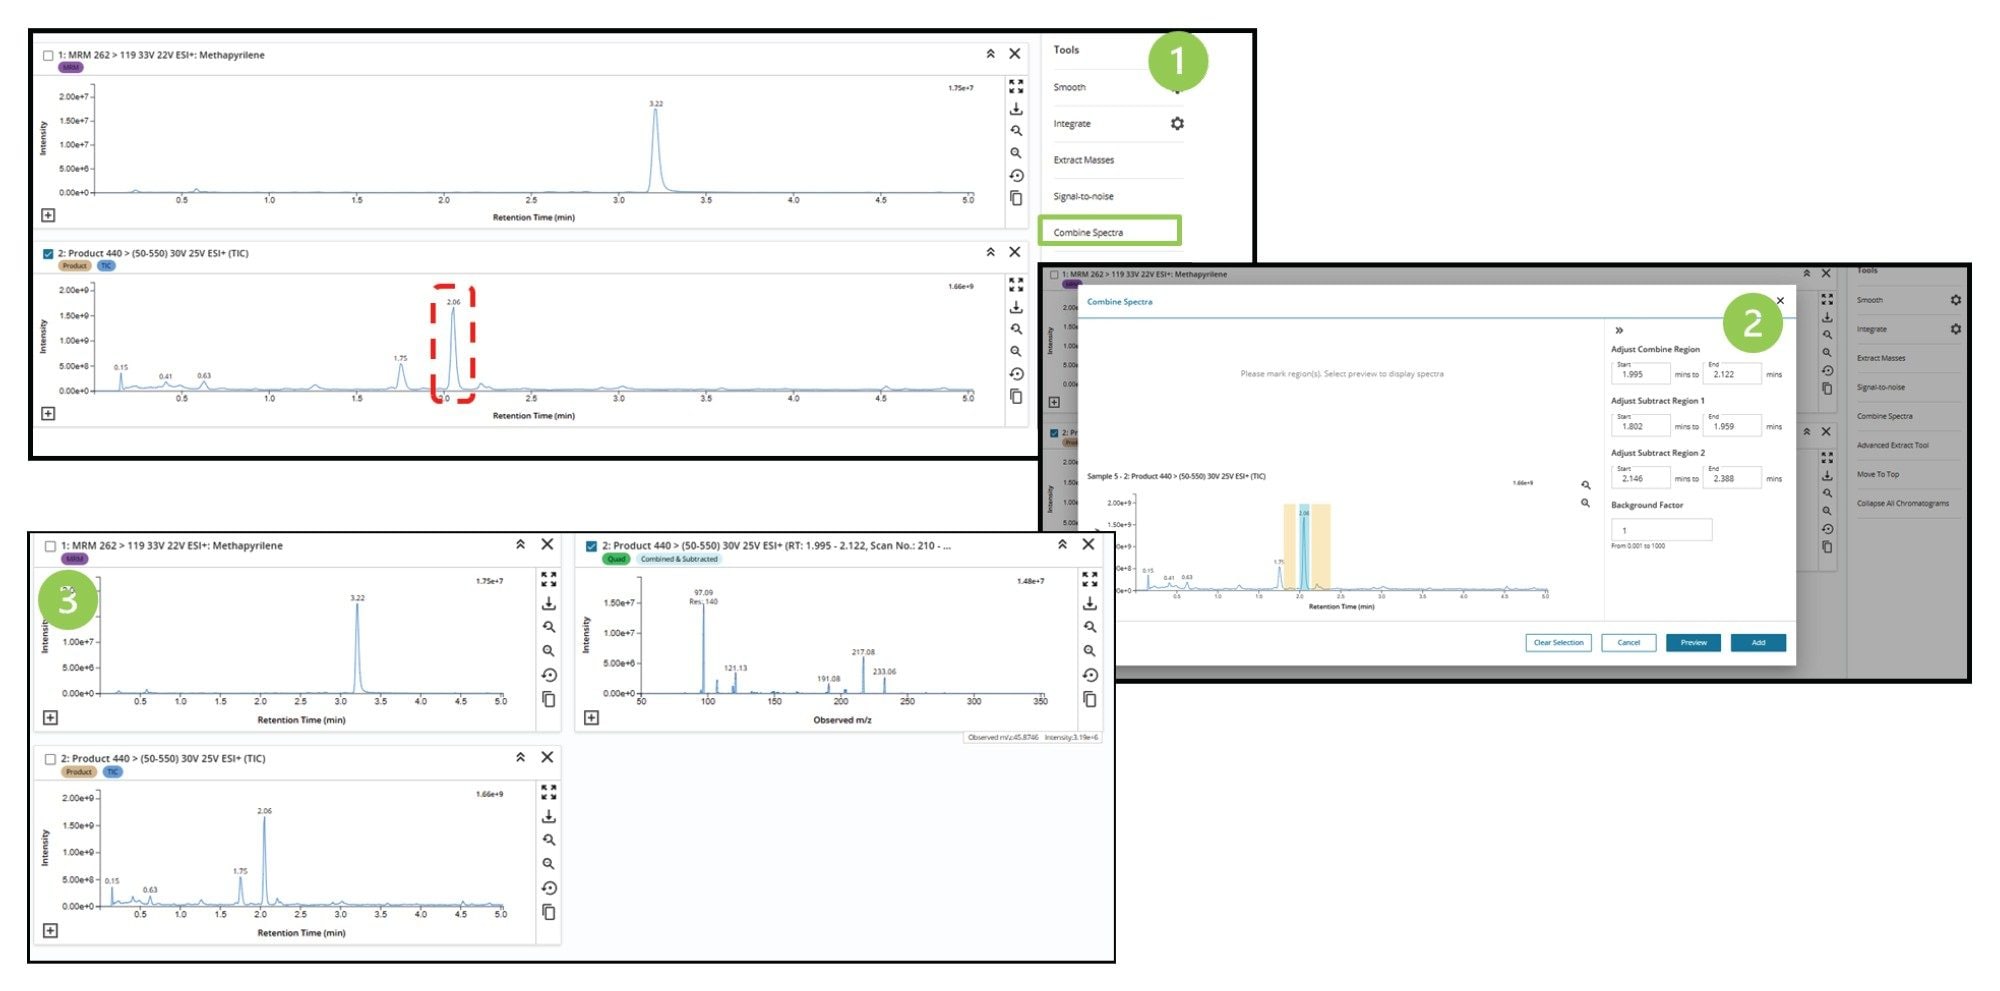
LC-MS Toolkit also enables the rapid comparison of the MS and MS/MS spectra of a chromatographic peak(s). Once an LC-MS chromatogram or extracted ion chromatogram has been selected in LC-MS ToolKit and the peak of interest located as shown in Figure 3, (1) the MS spectrum is generated using the combine spectra function (highlighted in green), a new window is then generated (2) in which the peak of interested is highlighted (blue shaded area) and background areas of the chromatogram selected (yellow shaded area), the resulting MS spectrum can then be previewed and added to the LC-MS Toolkit work area (3).
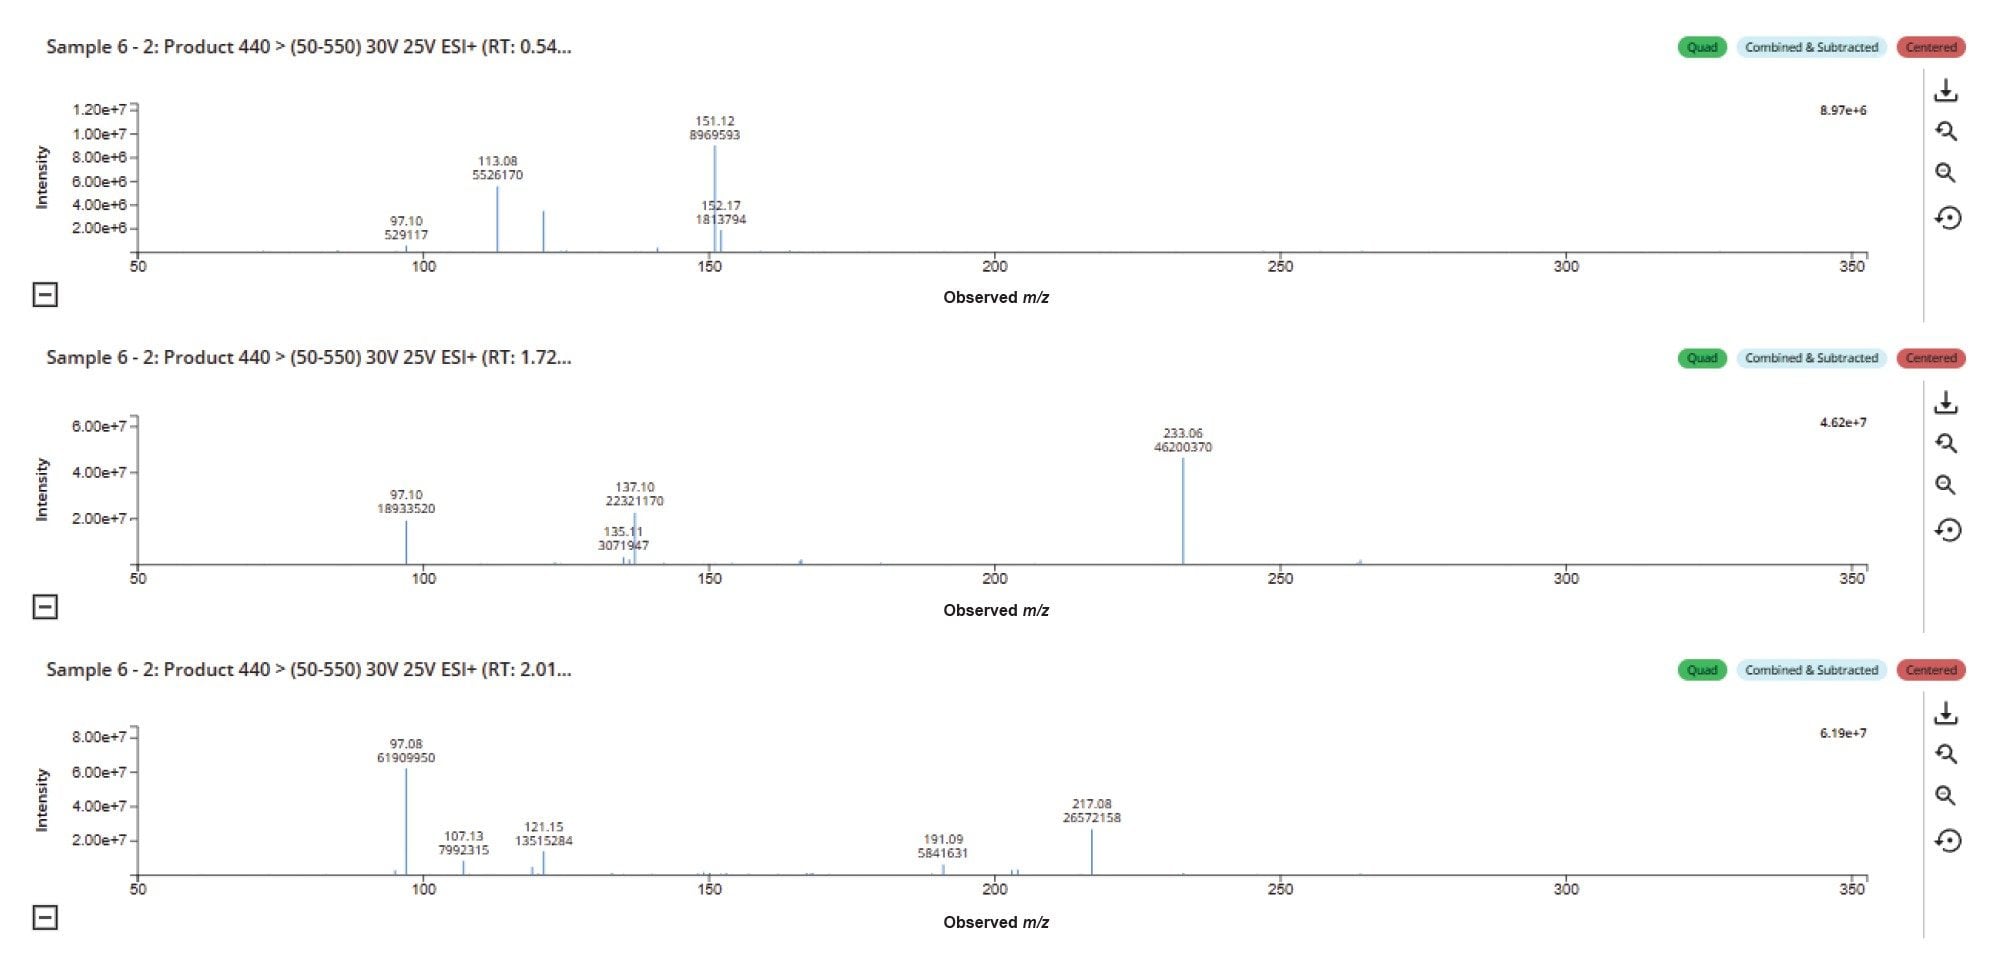
The spectrum from the LC-MS peaks can be quickly compared using the compare function LC-MS Toolkit (Figure 4). The data show that there is a clear difference in the MS2 spectra between the three metabolite peaks (m/z = 440), suggesting that the site of functionalization and conjugation is different between metabolites. Previous analysis of MP (tR = 3.22 min) gave a base peak at m/z = 262, corresponding to the protonated (M+H+) ion of the drug, and diagnostic MS2 fragment ions m/z = 97 (thiophene ring), 119 (pyridine ring moiety), 121 (pyridine ring aliphatic chain), and 217 (loss of tertiary amine).3 Analysis of the peak eluting at tR = 0.63 min shows only a weak signal for the m/z = 97 ion and a strong signal at m/z = 113, suggesting a possible metabolism potentially occurred in the thiophene ring complex. The metabolite eluting tR = 1.76 shows three major methapyrilene fragment ions, m/z = 97, 121, and 217, suggesting potential O-glucuronidation on the tertiary amine. In contrast, the peak eluting at tR = 2.07 min ion exhibits the major fragment ions, m/z = 97, 137, and 233, suggesting a +16 Da mass increase for the ion m/z = 121 and 217 from the peak eluting at tR = 2.07 min, indicating O-glucuronidation on the pyridine ring system.
Confirming the site of metabolism requires rationalizing MS1 and MS2 spectral data with molecular structure fragments. The Mass Fragment tool within LC-MS Toolkit simplifies the process of matching the observed MS2 spectral data to an in silico generated fragmentation pattern of the molecule. The first step in this process is to center the MS2 spectrum (1) using the Center function in LC-MS Toolkit. The software then creates a centred MS2 spectrum as shown in Figure 5.
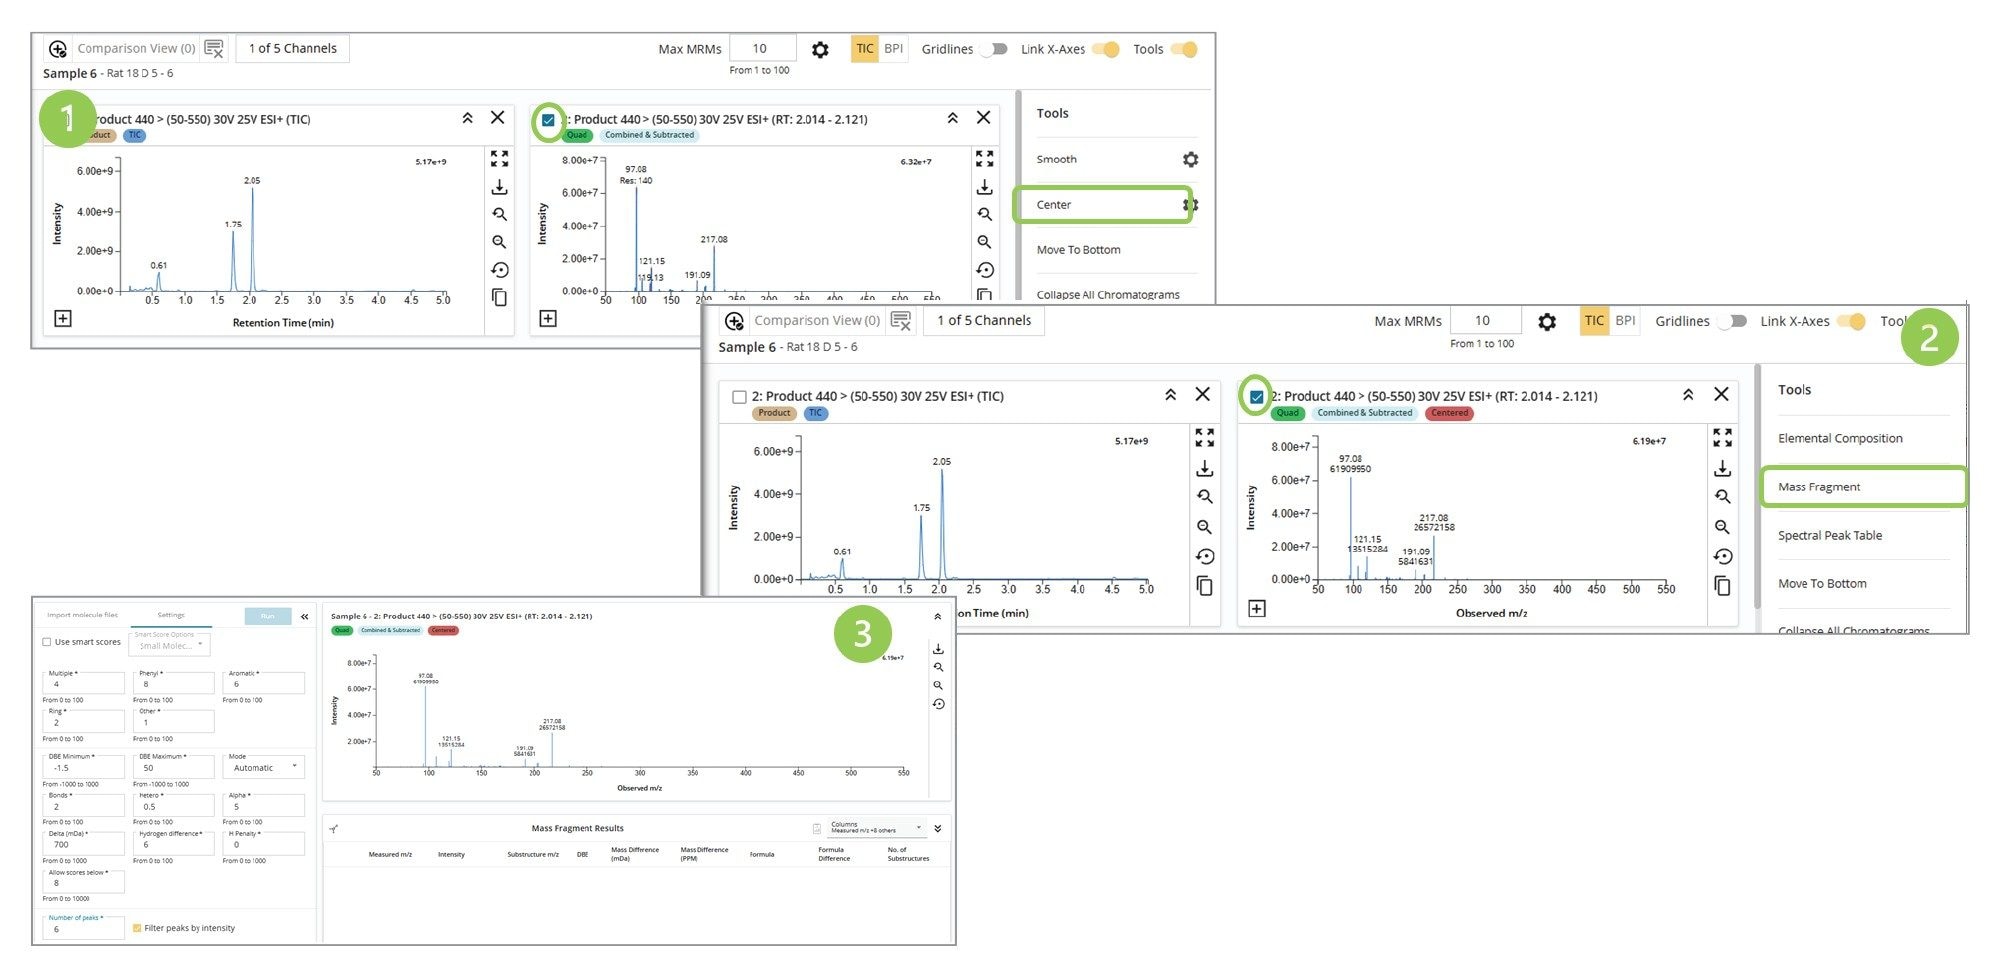
The resulting centered spectrum is then chosen, and the Mass Fragment function in LC-MS Toolkit selected (2). The Settings function in Mass Fragment (3) is used to optimize the parameters for spectral matching, DBE, and mass accuracy. The .Mol file of the structure under evaluation is input using the Import molecule browser. The Mass Fragment tool then matches the observed features in the MS2 spectrum with the in silico-generated fragmentation data.
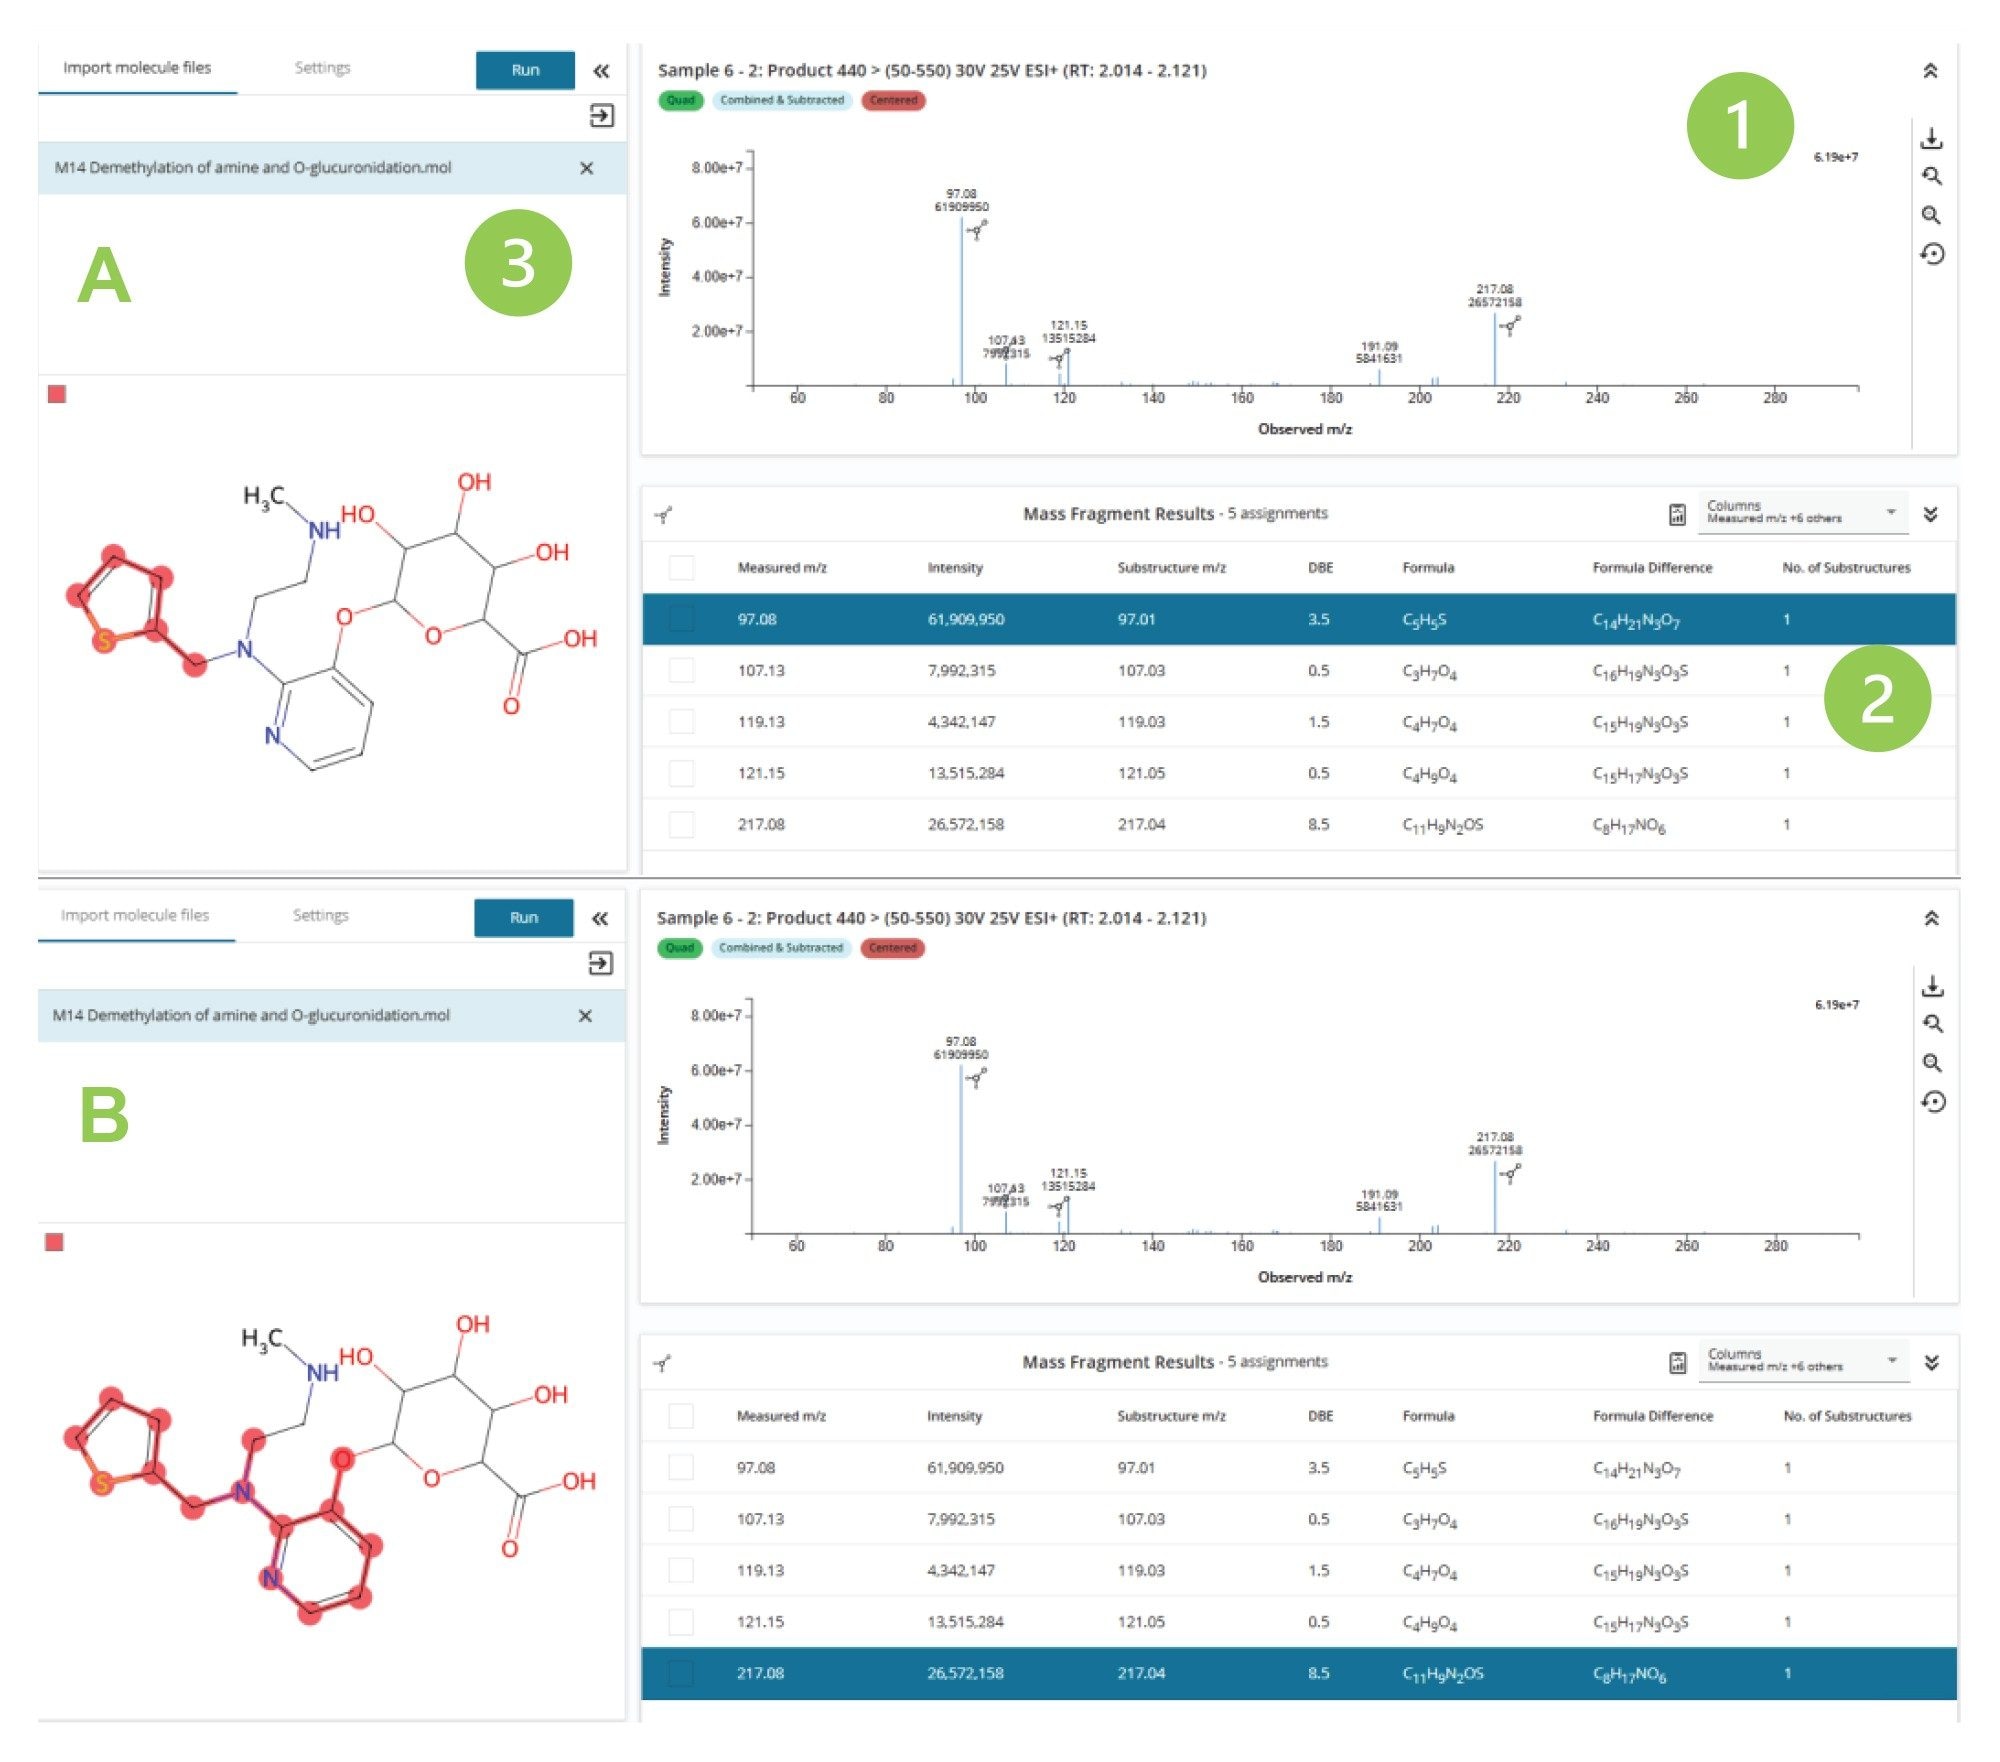
The data in Figure 6 illustrates the analysis of the MS2 spectrum derived from the peak eluting at tR = 2.07 min using Mass Fragment. The processed results are displayed in three windows panes: (1) mass spectrum with the peaks relating to an identified fragment highlighted by the molecule icon, (2) table of identified fragment ions, and (3) metabolite structure. By clicking on any of the observed m/z values in the results table (2) the region of the molecule giving rise to the specific fragment ion is indicated by the color shaded area. This is illustrated in Figure 6, where the m/z = 97 & 217 ions (A and B respectively) are reviewed. Here, the Mass Fragment tool has assigned m/z = 97 ion being derived from the region relating to the thiophene ring and the m/z = 217 produced by the fragment associated with the pyridine ring–thiophene ring complex. This ability in Mass Fragment significantly simplifies the process of confirming metabolite identity.
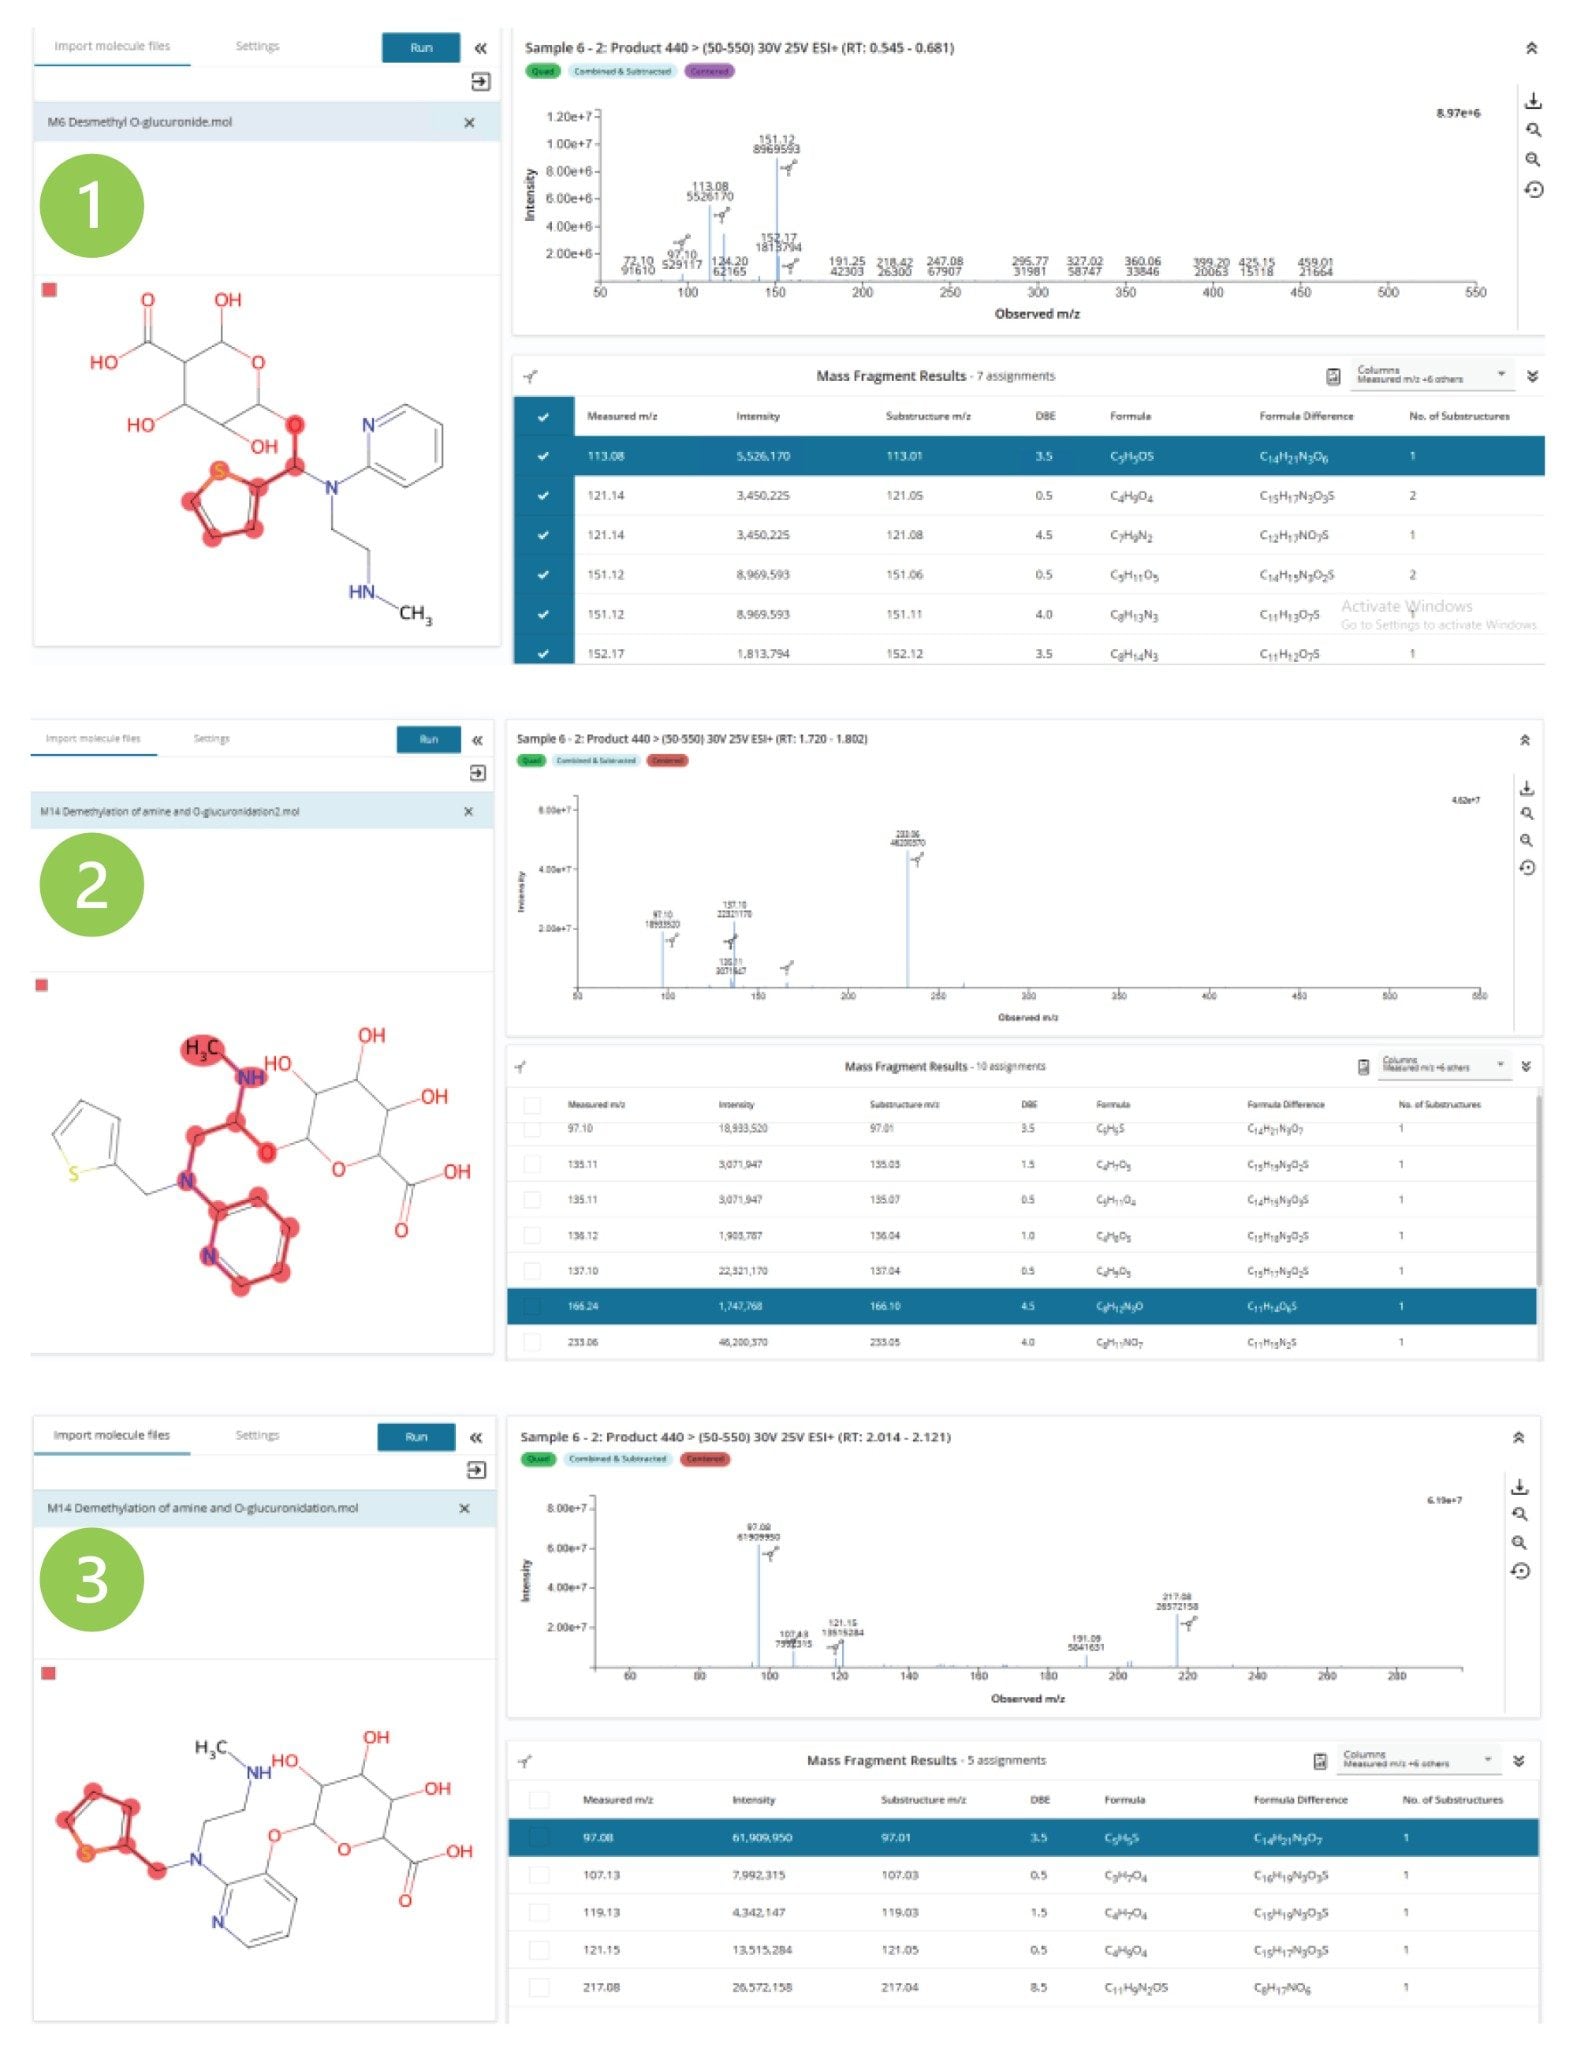
MassFragment was used to compare the mass spectral data obtained from the analysis of the three desmethyl O-glucuronide metabolites of MP (m/z = 440) eluting tR = 0.63, 1.76 & 2.07 min(1–3 respectively; Figure 7). Analysis of the peak eluting at tR = 0.63 min (1) reveals three diagnostic ions m/z = 97, 113, and 151. The two diagnostic ions m/z = 97 and 113 suggest that the oxygenation and subsequent glucuronidation have occurred on the C6 carbon connecting the thiophene ring to the tertiary amine N7 nitrogen. The peak eluting at tR = 1.76 min (2) gave rise to four fragment ions m/z = 97, 137, 166 and 233. The m/z = 97 is derived from the thiophene ring fragment, the m/z = 137 ion is a fragment of the oxygenation of the pyridine ring–aliphatic chain complex on the aliphatic chain, the m/z = 166 ion is formed from the pyridine ring–aliphatic chain fragment with oxygenation on the aliphatic chain, and the m/z = 233 ion is generated from the oxygenation of the aliphatic chain and loss of the O-glucuronide moiety and tertiary amine. The peak eluting tR = 2.07 min relates to the O-glucuronidation of the pyridine ring, which generates the fragment ions m/z = 97, 121, and 217 (3). The m/z = 97 relates to the unsubstituted thiophene ring, m/z = 121 relates to the pyridine ring–aliphatic chain group, and m/z = 217 relates to the pyridine–thiophene ring complex. These results illustrate that the three desmethyl o-glucuronide metabolites are formed by functionalization and conjugation at three distinct sites on the methapyrilene molecule, the thiophene ring region, the pyridine ring, and the C8–9 carbons on the aliphatic chain.
Conformation of the site of metabolism of a candidate molecule is a critical part of drug development. Tandem quadrupole LC–MS provides a simple, rapid, and sensitive approach for this task via the use of MS/MS experiments such as product ion scanning. LC-MS Toolkit in the waters_connect for Quantitation Software provides a powerful post-acquisition tool facilitating the comparison of chromatograms, extracted ion spectrum, and MS/MS data within a sample or across samples. The MassFragment feature in LC-MS Toolkit is a simple, intuitive feature that allows for the assignment of MS product ion fragments to specific regions of a molecule using chemical intelligence. LC-MS Toolkit and MassFragment were used to compare and evaluate three isobaric urinary drug metabolites generated from the oral dosing of MP to male rats. By using MassFragment to process the LC-MS data, it was shown that the site of metabolism was different among the three metabolite peaks and confirmed the site of metabolism.
720009122, December 2025