Analysis of N-Nitroso-Sertraline in Drug Substance and Tablet Using LC-MS/MS
Abstract
N-nitrosamines have indeed become a significant concern for the pharmaceutical industry. These compounds are potent carcinogens and can pose serious health risks to patients if present in medications, even in trace amounts. While they are not intentionally added to drugs, their formation as impurities or degradation products during manufacturing or storage processes is a pressing issue.1
In response to these concerns, regulatory agencies such as the U.S. Food and Drug Administration (FDA), the European Medicines Agency (EMA), and the other global health authorities have implemented strict guidelines and regulations to address the presence of N-nitrosamines in drugs. This guidance includes risk assessment, establishing acceptable limits for N-nitrosamine impurities, testing and monitoring of pharmaceutical products and mitigation strategies by pharmaceutical manufacturers.4 Recently, both the EMA and the FDA provided revisions on how acceptable intake (AI) values are determined.5,6 The revisions introduced the Carcinogenic Potency Categorization Approach (CPCA), which aligns the relationship of impurity structure with carcinogenic potency. A CPCA category with a specific AI threshold is now determined for most new N-nitrosamines where in vivo toxicity of the impurity has not been determined.7
Sertraline is a commonly prescribed antidepressant medication, and N-nitroso-sertraline is a derivative formed through the nitrosation during manufacturing process. This compound is of particular concern due to its potential carcinogenic properties, similar to other N-nitrosamines. The presence of N-nitroso-sertraline or any N-nitrosamine derivative in pharmaceutical products is a significant issue for patient safety and regulatory compliance. This study describes the analysis of N-nitroso-sertraline in drug substance and drug product (tablet) using Ultra-Performance Liquid Chromatography (UPLC™) with electrospray ionization (ESI) and a Xevo™ TQ-S micro Tandem Quadrupole Mass Spectrometer. Chromatographic resolution between sertraline API and N-nitroso-sertraline was achieved for accurate quantification. Also, Nitrosamine Impurity Assay Quanpedia database provided useful starting conditions for MS or MRM analyses from a library of N-nitrosamines. The developed method demonstrated good linearity over the concentration range of 0.25–100 ppb for N-nitroso-sertraline with less than 20% concentration deviations. The R2 was greater than 0.99. The method recovery ranged from 85–93% and the accuracy was within +/- 20% of the true value which is in accordance with USP General chapter <1469>. The developed method was also used to quantify the N-nitroso-sertraline impurity in tablet samples. This work includes a complete workflow where analysis of solvent standard, drug substance and drug product were tested and quantification results for each are presented.
Benefits
- Trace level detection of N-nitroso-sertraline using the Xevo TQ-S micro Tandem Quadrupole Mass Spectrometer meeting the industry guidelines of 10% of the regulatory AI threshold
- Chromatographic resolution between sertraline API and N-nitroso-sertraline for accurate quantification of the impurity
- Nitrosamine Impurity Assay Quanpedia database provided useful starting conditions for MS or MRM analyses, accelerating method development
- Complete workflow demonstration of the analysis of drug substance and drug product
- Method robustness study with continuous 360 injections over four days
- N-nitroso-sertraline and sertraline hydrochloride reference standards serve as suitable benchmarks, enabling trace detection of the NDSRI in drug substance and drug product
Introduction
N-nitrosamines have indeed become a significant concern in the pharmaceutical industry. These compounds are potentially potent carcinogens and can pose serious health risks to patients if present in medications, even in trace amounts. While they are not intentionally added to drugs, their formation as impurities or degradation products during manufacturing or storage processes is a pressing issue.1
The presence of N-nitrosamines in drugs gained widespread attention in the pharmaceutical industry and regulatory agencies following several high-profile recalls of medications due to contamination with these compounds. One of the most notable cases involved the discovery of N-nitrosamine impurities in certain angiotensin receptor blockers (ARBs), including valsartan, losartan, and irbesartan.2
Nitrosamine drug substance related impurities (NDSRIs) are potentially potent carcinogens, with, in some cases, even lower exposure levels raising concerns about long-term health risks. The contamination of pharmaceuticals with N-nitrosamines can occur through various mechanisms introducing the presence of vulnerable amines and nitrosating agents under certain conditions, including the use of contaminated raw materials, drug substance synthesis and product manufacturing processes and degradation of drug substances or excipients under certain conditions such as high temperature, humidity, or exposure to light.3
In response to these concerns, regulatory agencies such as the FDA, EMA, and other global health authorities have implemented strict guidelines to regulate the presence of N-nitrosamines in drugs. This guidance includes risk assessment, establishing acceptable limits for N-nitrosamine impurities, testing and monitoring of pharmaceutical products and mitigation strategies by pharmaceutical manufacturers.4
Recently, both the EMA and the FDA provided revisions on how AI values are determined.5,6 The revisions introduced the CPCA, which aligns the relationship of impurity structure with carcinogenic potency. A CPCA category with a specific AI threshold is now determined for most new N-nitrosamines where in vivo toxicity of the impurity has not been determined.7
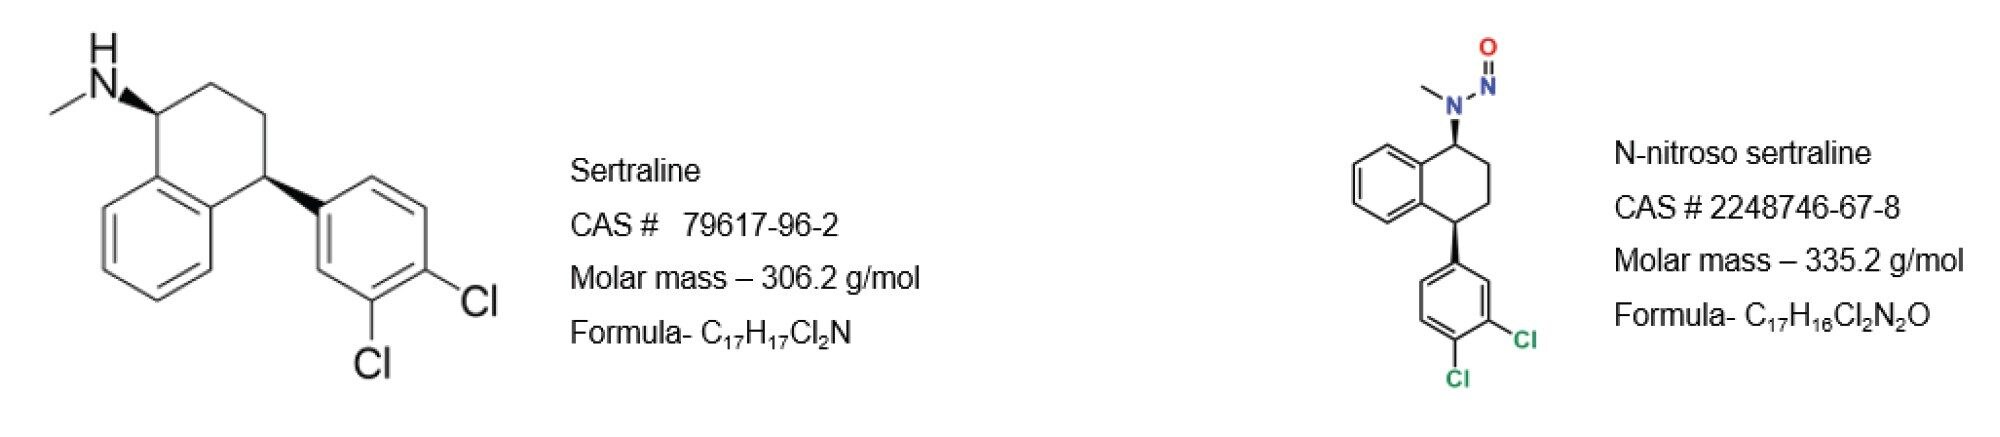
Sertraline is a commonly prescribed antidepressant medication, and N-nitroso-sertraline is a derivative formed through the nitrosation process. This compound is of particular concern due to its potential carcinogenic properties, similar to other N-nitrosamines. The presence of N-nitroso-sertraline or any N-nitrosamine derivative in pharmaceutical products above regulatory defines threshold is considered a significant risk for patient safety and regulatory compliance.
To avoid the need for onwards batch release testing in QC, analytical methods used for the detection of nitrosamines, including NDSRI, are required to demonstrate absence of impurity at a lower limit of quantitation (LOQ) of 10% of the limit derived from the AI and the active pharmaceutical ingredients (API) maximum daily dose (MDD). With MDD of 200 mg, the assay exceeded the regulatory requirements of N-nitroso-sertraline. According to EMA, the acceptable intake (AI) of sertraline is 1500 ng/day and CPCA category is 5. While for FDA, the AI is 100 ng/day and CPCA category is 2. For this study more stringent (FDA) regulation was selected which makes threshold of (AI/MDD) 0.5 ppm. With respect to 5 mg/mL of sertraline API, the impurity N-Nitroso-sertraline threshold is 2.5 ppb (µg/kg with respect to 0.5 ppm of API) and 10% of threshold is 0.25 ppb.
This study describes the analysis of N-nitroso-sertraline in drug substance and final drug form (FDF) using Ultra-Performance Liquid Chromatography (UPLC) with electrospray ionisation (ESI) and a Xevo™ TQ-S micro Tandem Quadrupole Mass Spectrometer.
Experimental
Waters Solutions
- ACQUITY™ UPLC I-Class System with FTN
- ACQUITY Photodiode Array (PDA) Detector
- Xevo TQ-S micro Tandem Quadrupole Mass Spectrometer
- Atlantis™ Premier BEH™ C18 AX 2.5 µm Column (p/n: 186009392)
- Instrument control: MassLynx™ 4.2 Software
- Data processing: Targetlynx™ 4.2
- Nitrosamine Impurity Assay Quanpedia™ Database
Method
|
LC system: |
ACQUITY UPLC I-Class system with FTN |
|
Detection: |
ACQUITY PDA (UV absorbance 230 nm) |
|
Column: |
Atlantis™ Premier BEH C18 2.1 x 100 mm AX 2.5 µm column (p/n: 186009392) |
|
Solvent manager: |
Binary Solvent Manager |
|
Sample manager: |
Sample Manager FTN |
|
Mobile phase A: |
0.1% Formic Acid in Water |
|
Mobile phase B: |
0.1% Formic Acid in Acetonitrile |
|
Purge solution: |
Acetonitrile: H2O (1:1) |
|
Wash solution: |
Methanol |
|
Seal wash: |
Methanol: water (1:9) |
|
Injection Volume: |
10 µL |
|
Sample temperature: |
10 °C |
|
Column temperature: |
40 °C |
|
Extension loop: |
50 µL |
MS Conditions
|
System: |
Xevo TQ-S micro Tandem Quadrupole |
|
Ionisation mode: |
Electrospray Positive |
|
Capillary voltage (kV): |
3 |
|
Cone voltage (V): |
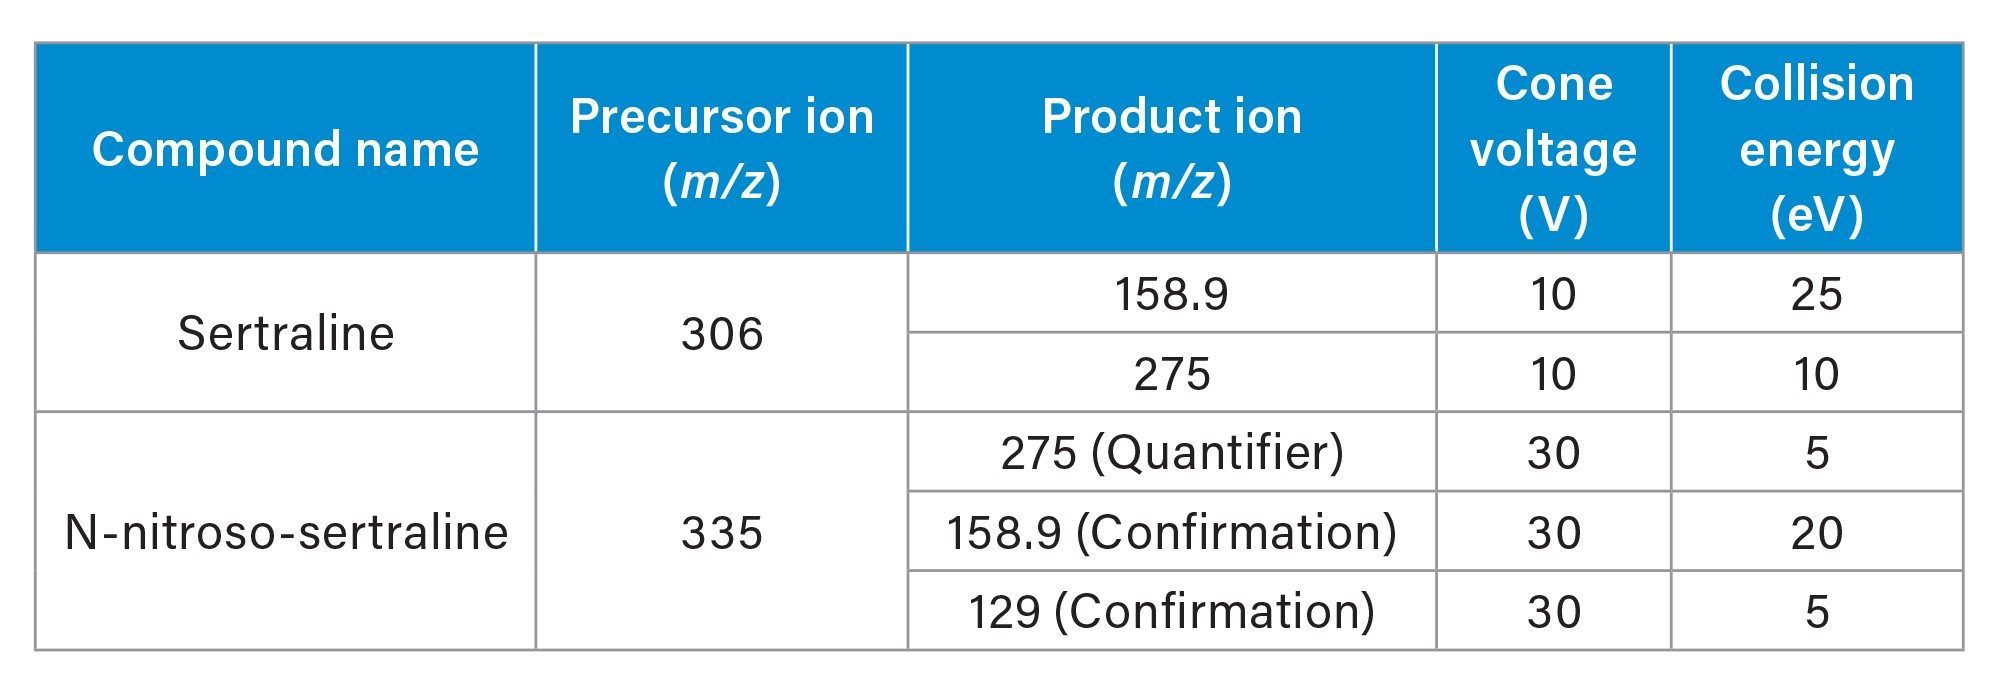
Table 3 |
|
Collision energy (eV): |
Table 3 |
|
Source temperature: |
150 °C |
|
Desolvation temperature: |
300 °C |
|
Desolvation gas flow (L/hr): |
800 |
|
Instrument control: |
MassLynx 4.2™ security software |
|
Data processing: |
TargetLynx™ 4.2 |
Sample Preparation
Standards and reagents
Standards of N-nitroso-sertraline (CAS# 3006789-98-3) and sertraline hydrochloride (CAS# 79559-97-0) were supplied from LGC Standards-subsidiaries, LGC-TRC, and LGC-Mikromol respectively. Optima LC/MS grade solvents and formic acid were purchased from Fisher Scientific. A primary stock solution of N-nitroso-sertraline at 10 mg/mL was used to prepare the working solutions.
Sertraline (C17H17Cl2N) constitutes 89.8% of sertraline hydrochloride (C17H17Cl2N HCl). Aliquots of sertraline hydrochloride (5.09 mg = 4.57 mg of sertraline) were weighed into scintillation vials and 0.91 mL of methanol was added to make 5 mg/mL of sertraline
10 mg N-nitroso-sertraline (C17H16Cl2N2O) was weighed, and 10 mL methanol was added to make a 1 mg/mL stock solution. A working solution of N-nitroso-sertraline was further diluted with methanol.
Recovery
Recovery was studied at two levels, threshold and 10% of threshold equating to 0.5 mg/kg, and 0.05 mg/kg of N-nitroso-sertraline with respect to 5 mg/mL sertraline. Spiking solutions of N-nitroso-sertraline were prepared at 10 ng/mL, and 100 ng/mL with methanol. The spiking solutions were used to prepare two concentrations for recovery calculations.
Pre-spikes:
20 µL of each spiking solution concentration was pipetted into 6 tubes each containing 5.09 mg sertraline hydrochloride. Make up to 1 mL with methanol to make final concentrations of 0.5 mg/kg (ppm) and 0.5 mg/kg (ppm) (n=6 at each concentration level).
Matrix blanks:
Six matrix blanks were prepared by taking 5.09 mg sertraline hydrochloride and dilute up to 1 mL with methanol.
Standard solutions:
Standard solutions (n=6) at each test concentration level (0.25 ng/mL and 2.5 ng/mL) were prepared in 20 mL scintillation glass vials using 20 µL spiking solutions in 980 µL methanol.
Tablet preparation:
6 tablets were crushed together and accurately weighed out to 52.36 mg (47.02 mg of sertraline) three times. After that 9.4 mL methanol was added to make 5 mg/mL.
Pre-spikes, matrix blanks, standard solutions and tablet preparations were all subjected to the same extraction routine. They were extracted for 5 minutes, followed by 1-minute vortexing, and centrifuging at 15000 rpm for five minutes before transfer into LC-MS vials.
Calibration curve preparation
Standard Calibration Curve
An standard of N-nitroso-sertraline (1 mg/mL) in methanol was sequentially diluted to create a calibration curve ranging from 0.25 ng/mL to 100 ng/mL.
Matrix Calibration Curve
Sertraline HCl (38.76 mg) was weighed into a 20 mL glass scintillation vial and diluted with methanol was added to create a 5 mg/mL sertraline solution. This solution was used as the diluent for the N-nitroso-sertraline matrix calibration curve. An authentic standard of N-nitroso-sertraline was sequentially diluted using the 5 mg/mL sertraline solution to calibration solutions ranging from 0.25 to 100 ppb (0.05–10 mg/kg (ppm)) of N-nitroso-sertraline with respect to 5 mg/mL sertraline.
Results and Discussion
Chromatographic Separation
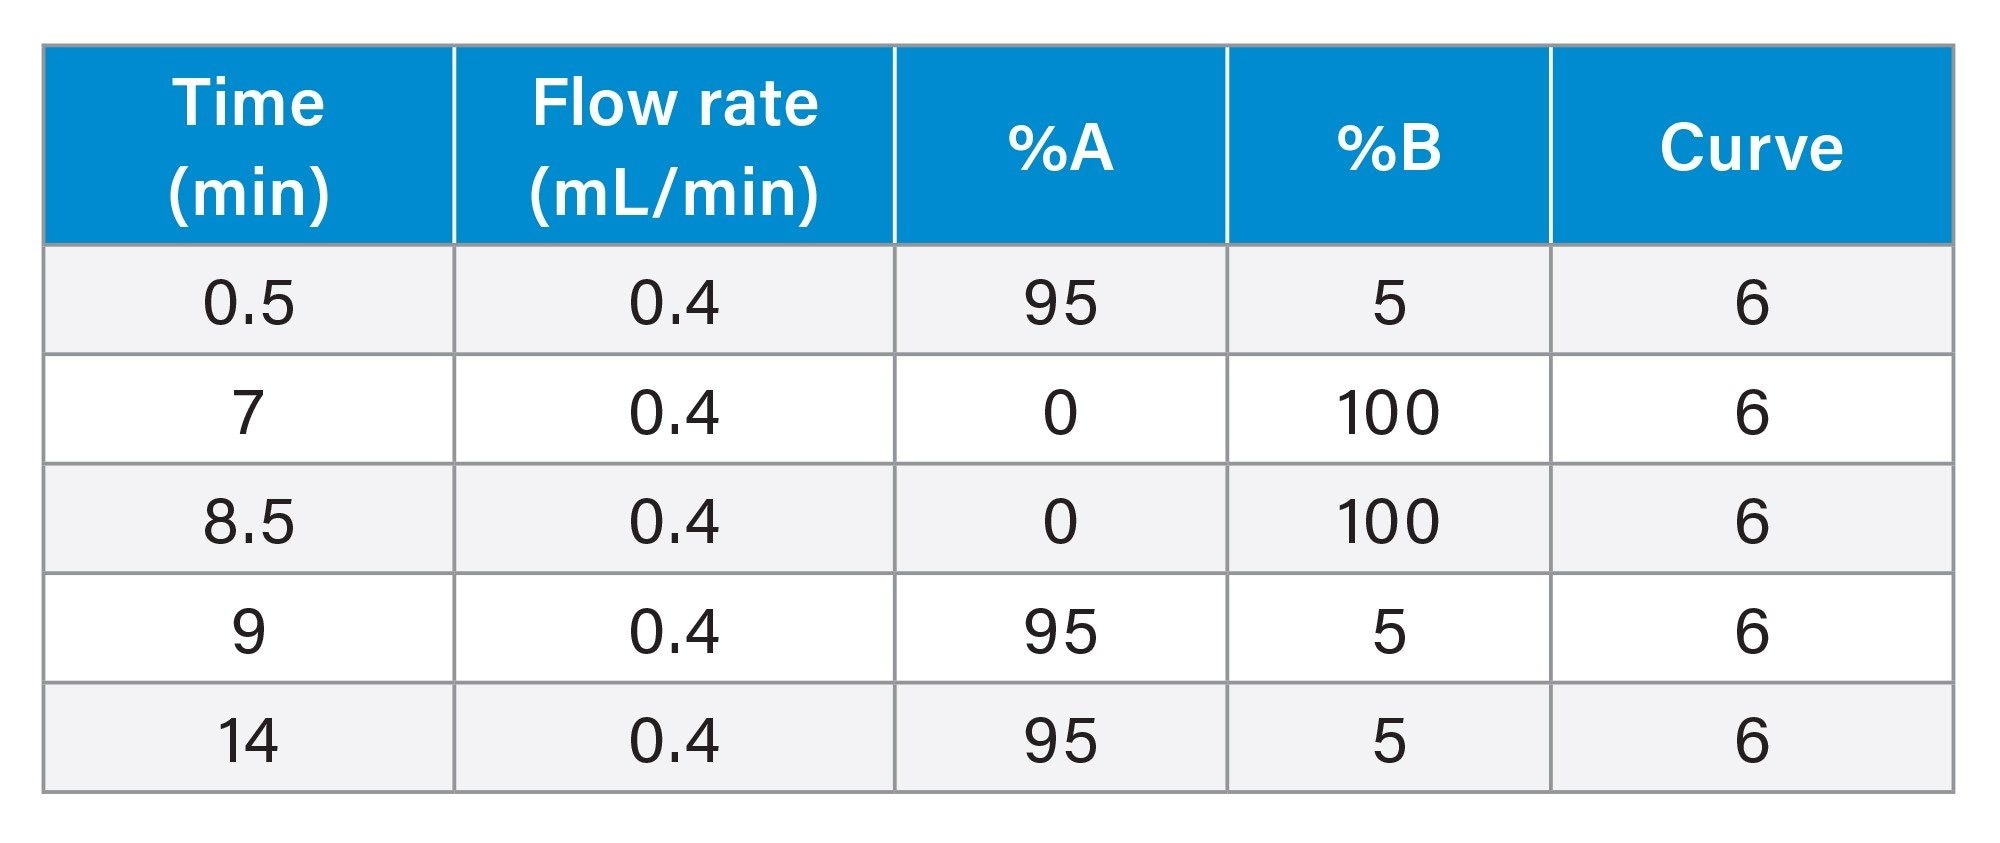
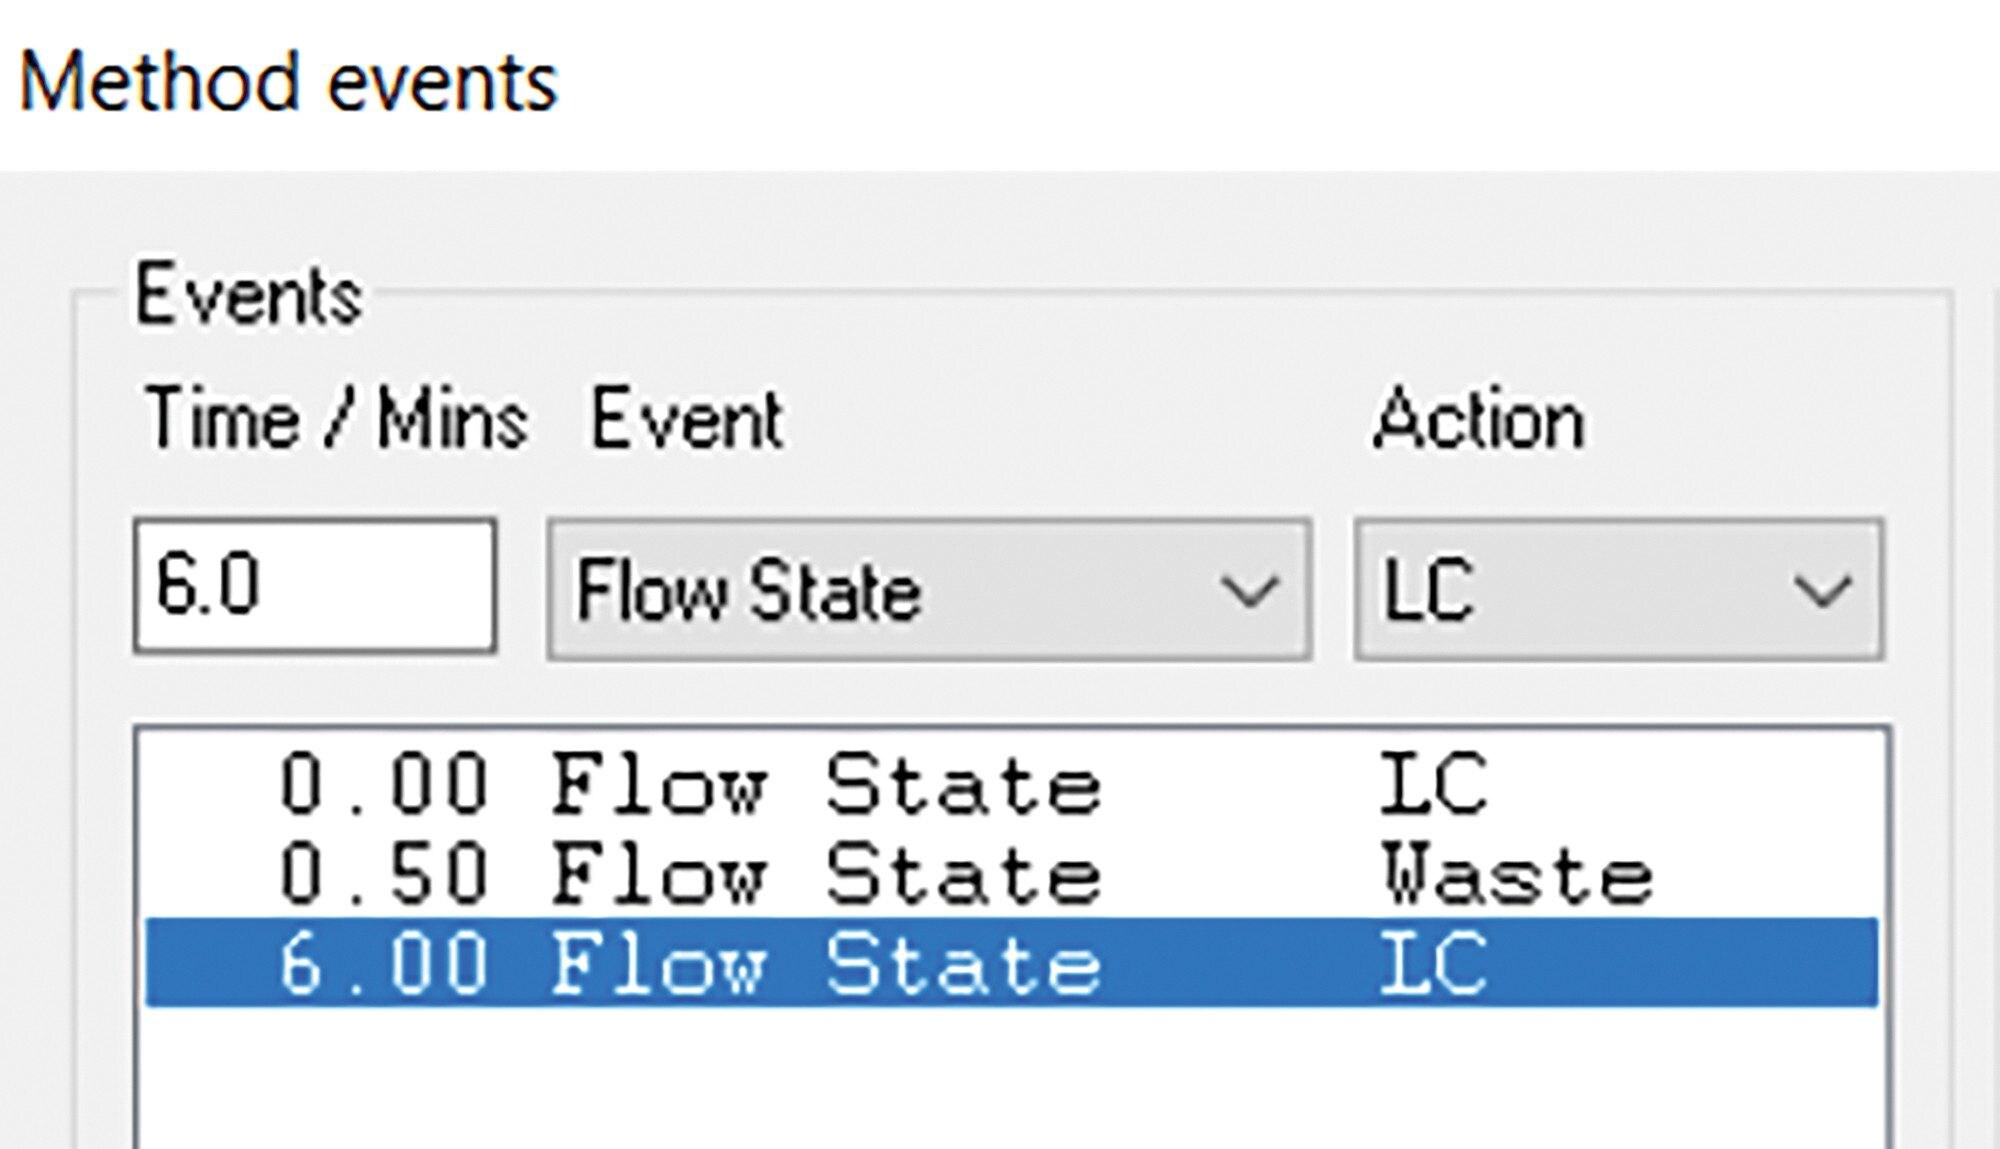
The chromatographic resolution and separation between the sertraline (API) and N-nitroso-sertraline is vital to avoid any potential matrix effects that could occur due to the proximity of the high levels of API present in the samples and for accurate quantification of the impurity. As sertraline concentrations are considerably higher and to avoid saturation of the MS, the first 6.0 minutes of the chromatographic run was diverted to waste using the integrated solvent divert valve (see Table 2).
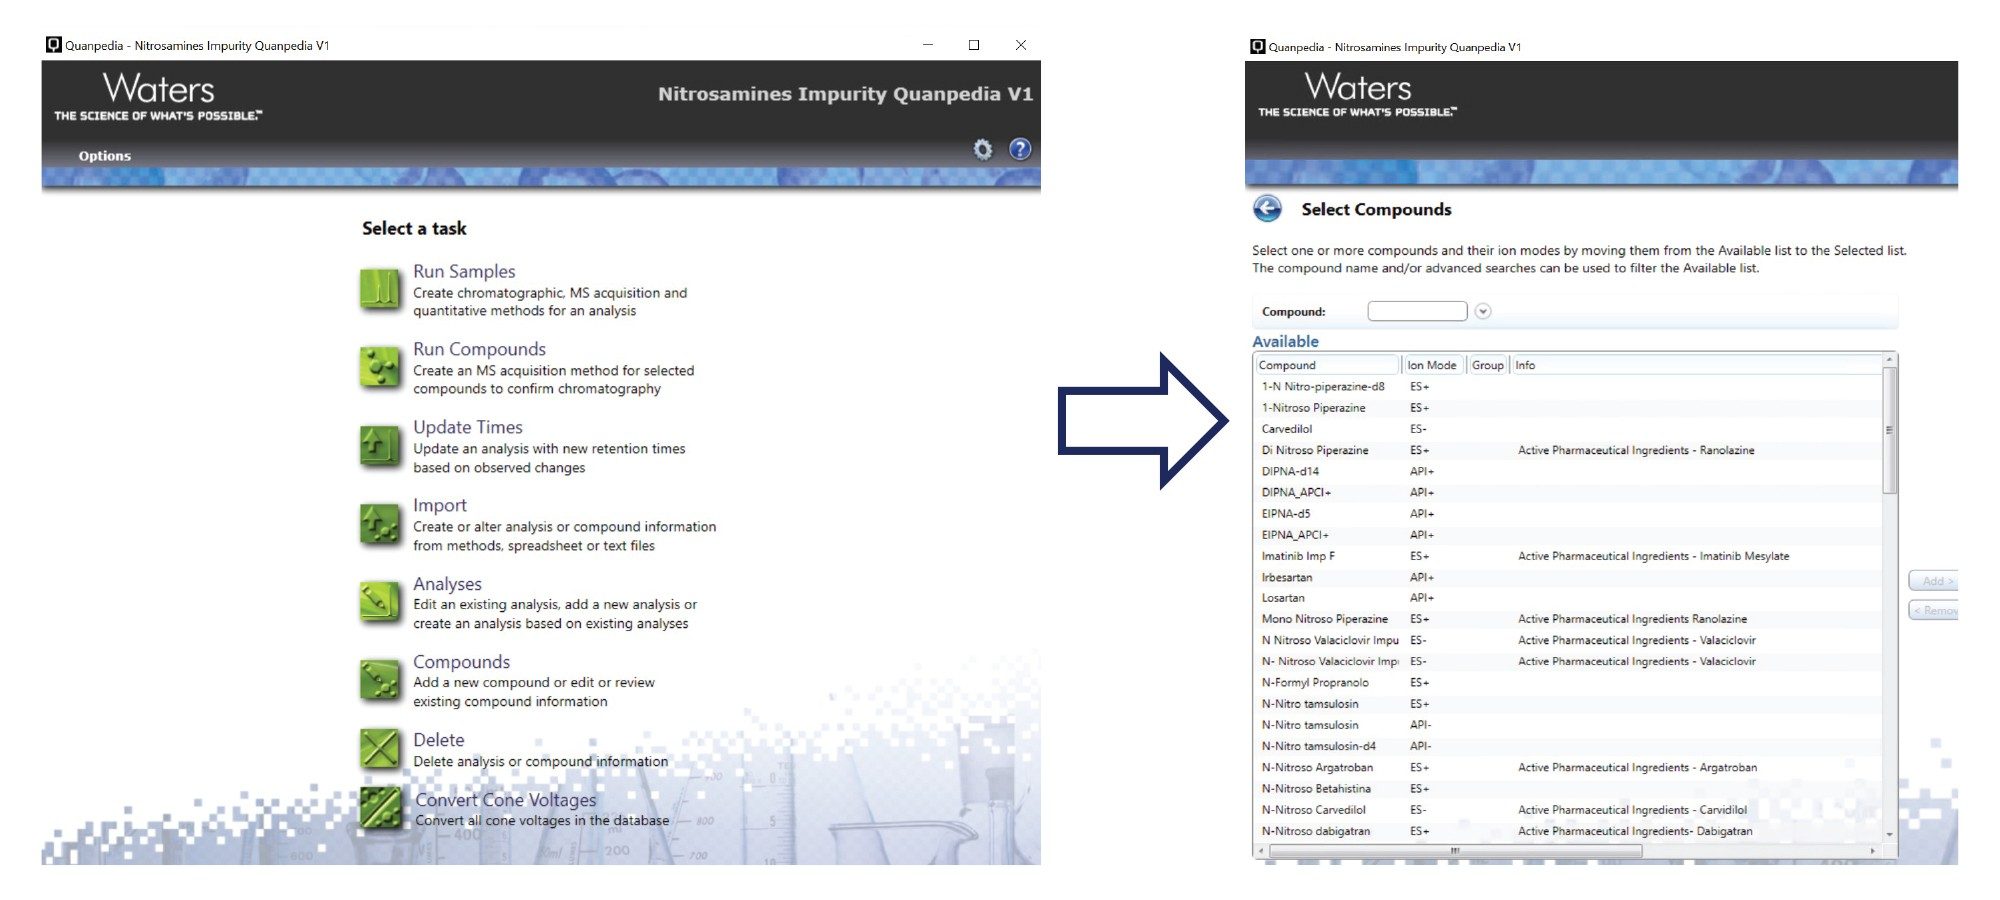
The MRM transitions were obtained from the Nitrosamine Impurity Assay Quanpedia Database available to Waters LC-MS/MS users, for use with MassLynx software. The Quanpedia database is an extensible and searchable database for UPLC-MS/MS analytical methods. The database is a comprehensive repository of MRM transitions for 60 nitrosamines including small alkyl nitrosamines, Nitrosamine Drug Substance Related Impurities (NDSRI) and some corresponding APIs and internal standards. By simply selecting compounds from the database, Quanpedia automatically creates both the data acquisition and associated data processing methods required to perform the analysis. Quanpedia enables efficient, rapid, and easy information management of both methods and compounds, allowing new methods to be rapidly generated for any of the compounds contained within the database. Compound and method information can easily be shared between multiple workstations or laboratories, thus reducing the risk of transcription errors. To achieve optimum sensitivity, the MRM transitions in the Quanpedia database can be further optimized. Figure 2 shows a screenshot of the Quanpedia library for Nitrosamines.
Using the Quanpedia database as a starting point, further fine tuning was achieved with a combined flow of the mobile phase used in the assay, and MassLynx’s auto tune tool Intellistart.
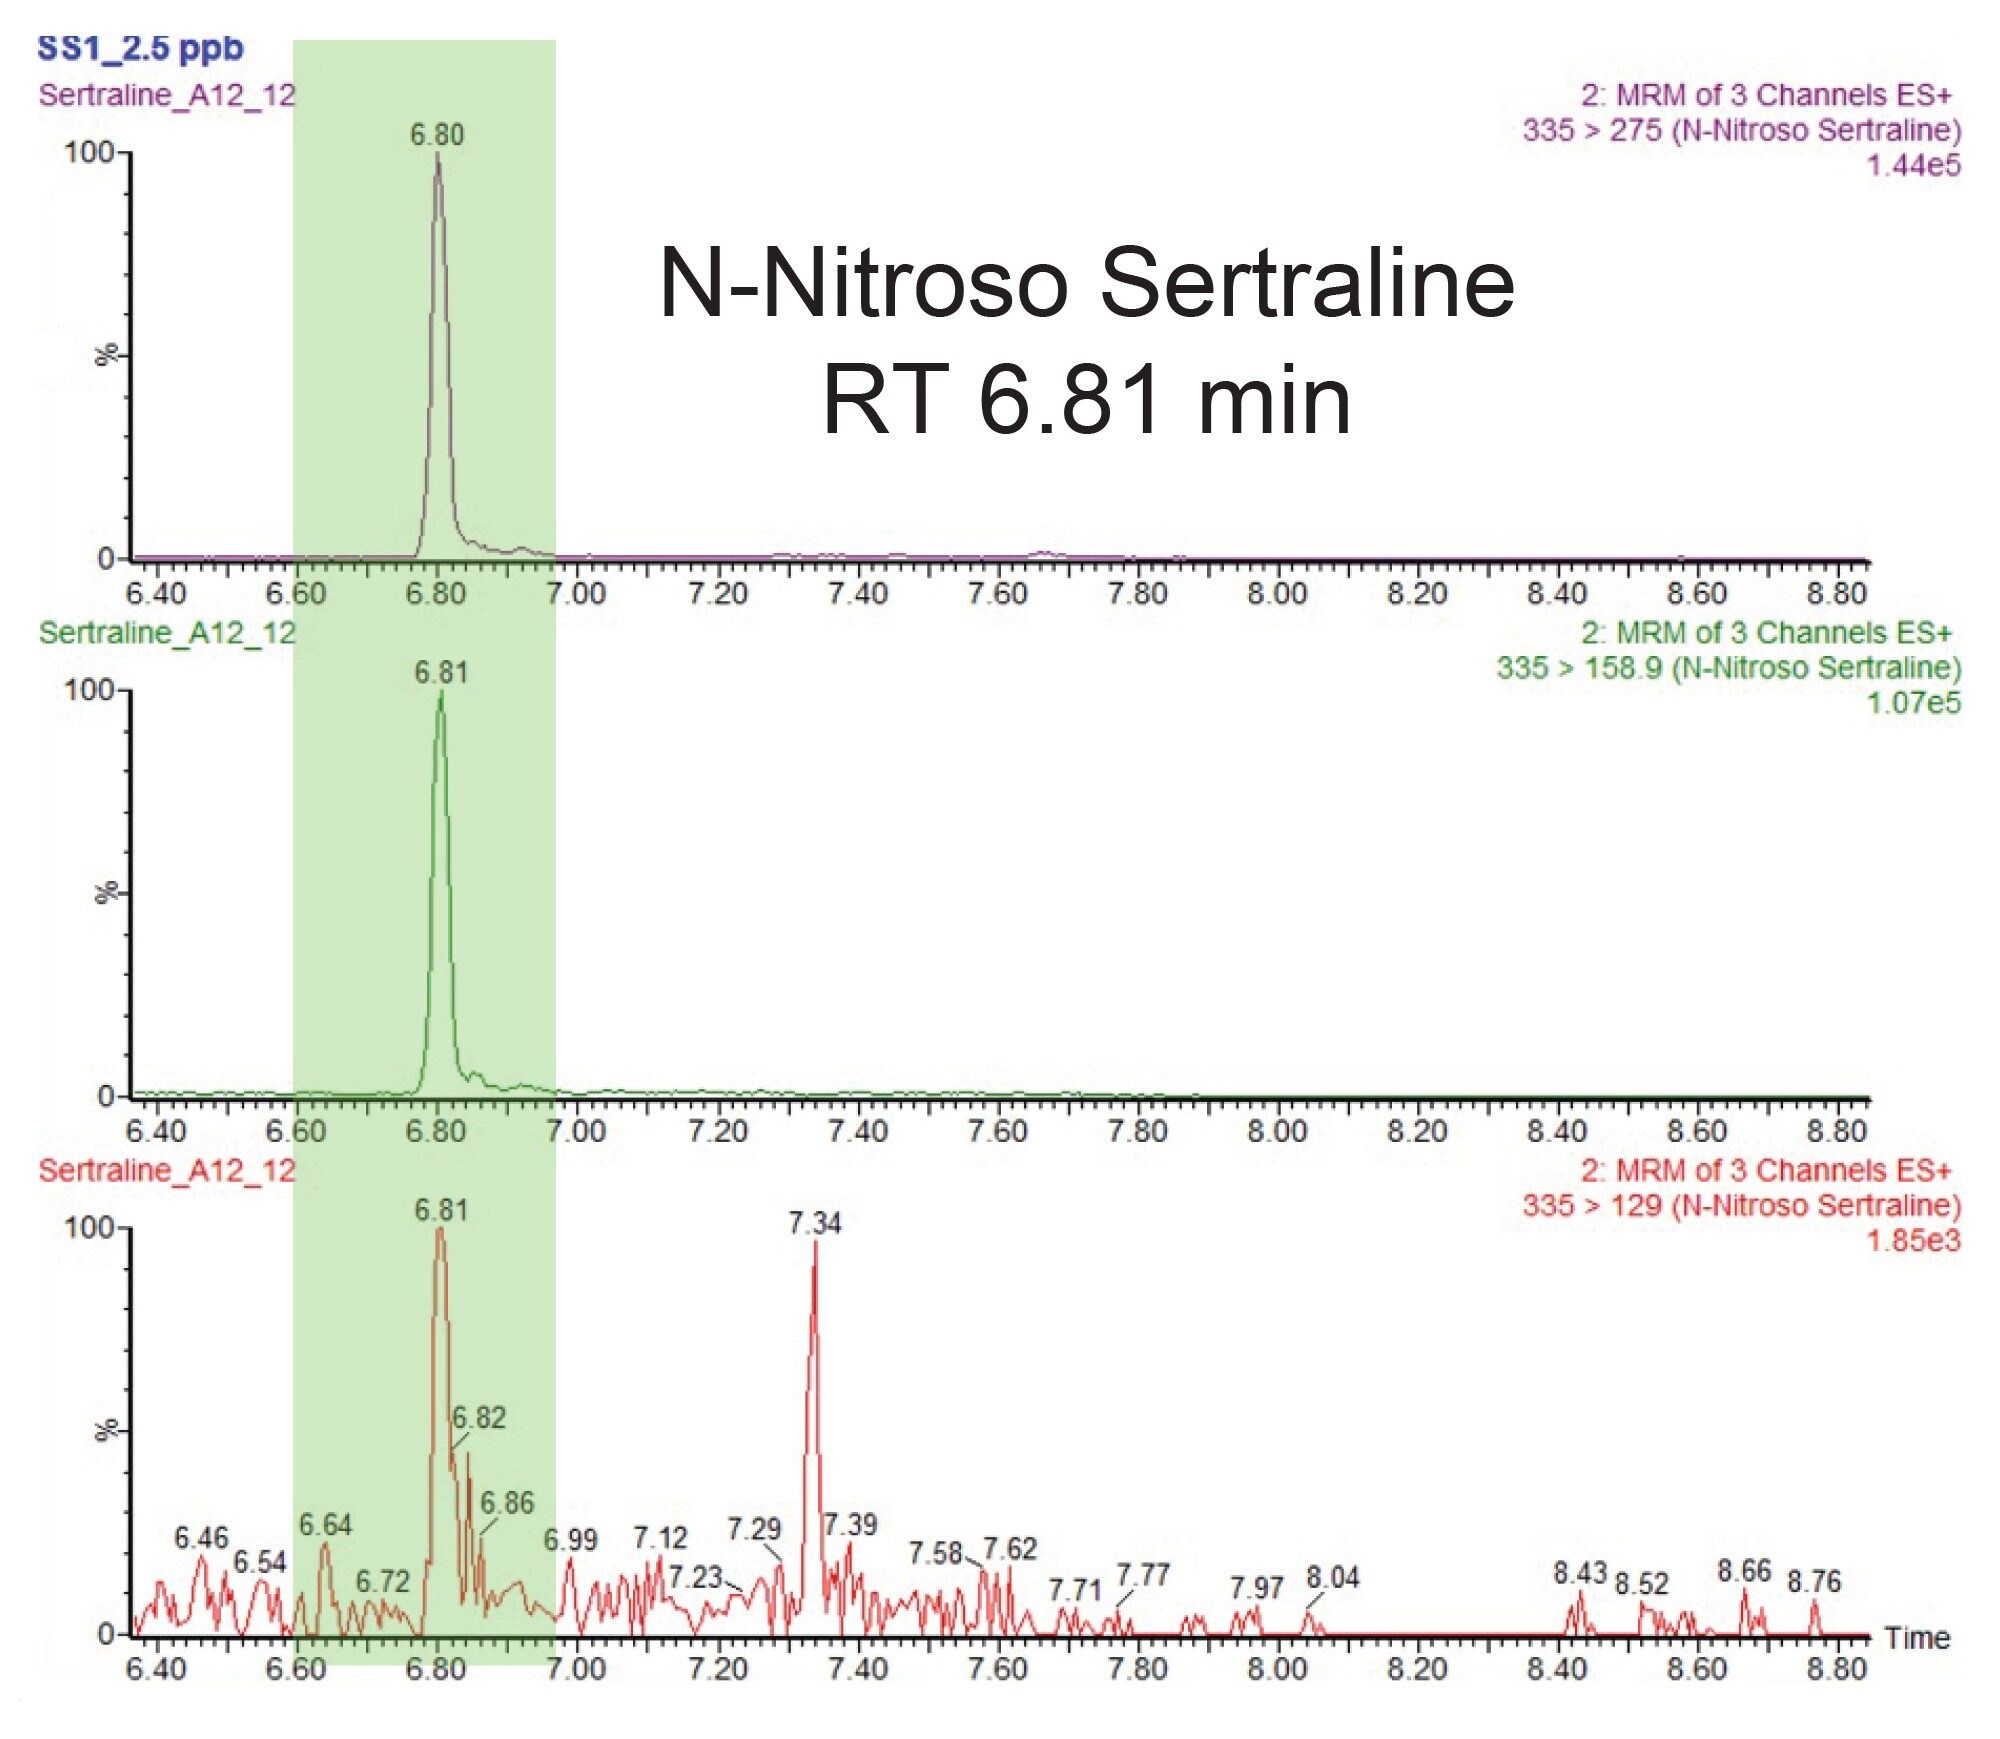
Figure 3 shows the chromatogram of N-nitroso-sertraline with a retention time of 6.80 minutes. The Atlantis™ Premier BEH C18 AX Column provides sufficient separation between the sertraline (RT 3.30 minutes) API and the N-nitroso-sertraline impurity (RT 6.81 minutes).
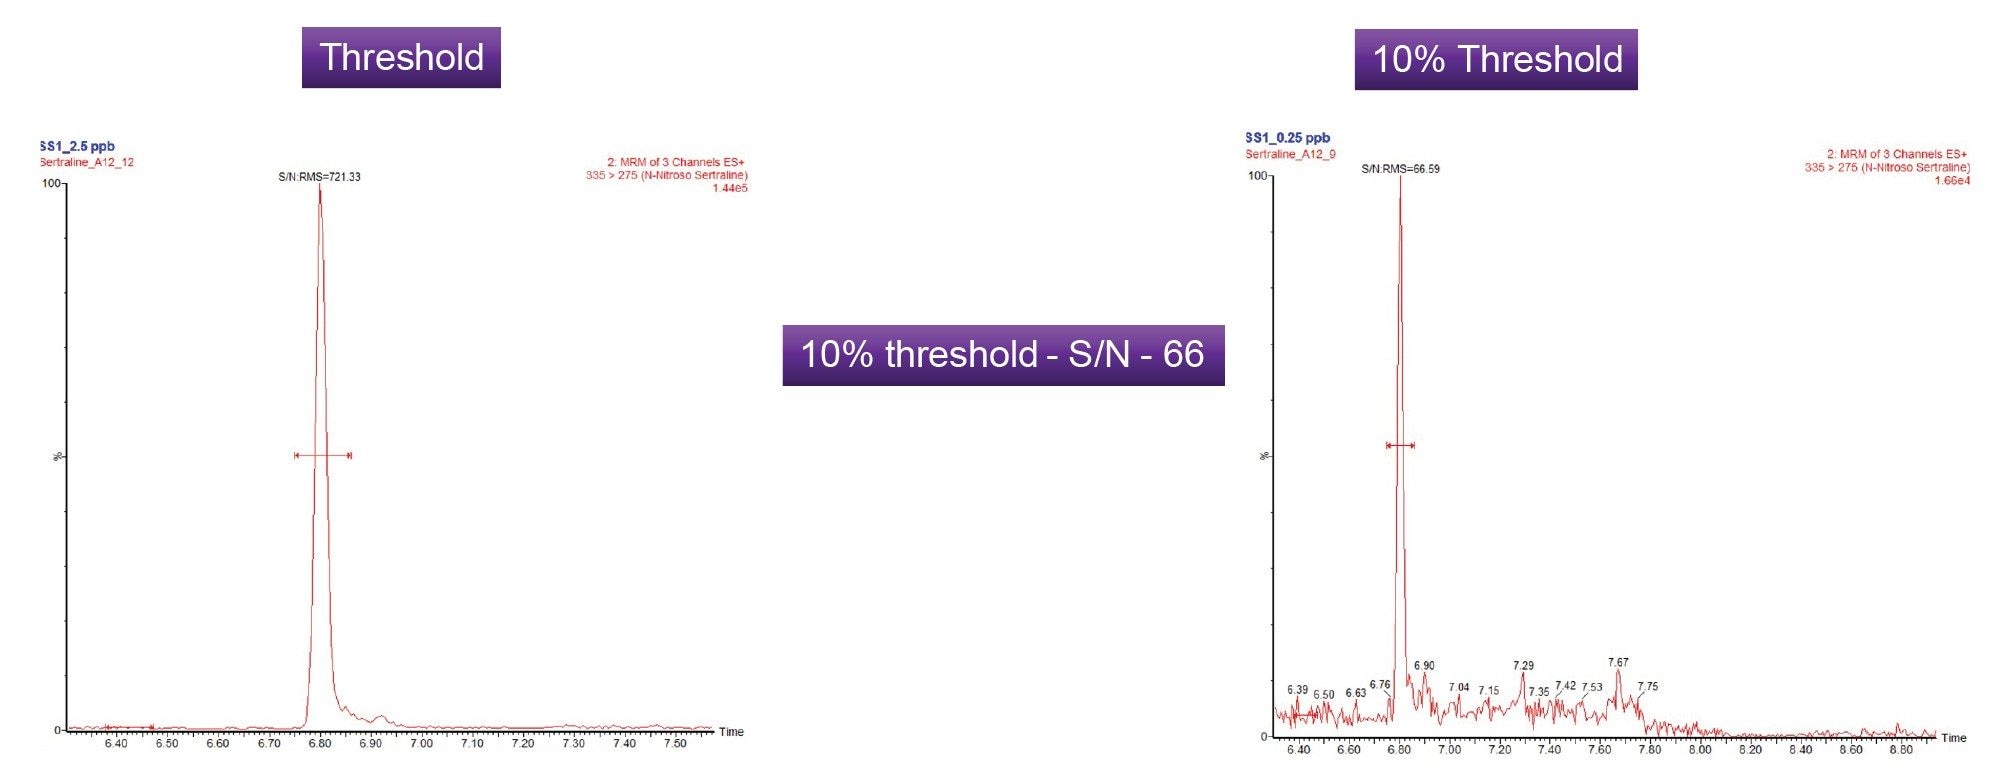
Limit of Quantitation (LOQ) and Linear Dynamic Range
The quantitative limits of the assay were initially established using standards of N-nitroso-sertraline with the LOQ based on a 10:1 signal-to-noise (S/N) ratio using the RMS algorithm. The threshold level for detection of N-nitroso-sertraline was 2.5 ppb (µg/kg, 0.5 PPM) with respect to 5 mg/mL sertraline. To illustrate the ability of the method at the regulatory threshold levels, the method was assessed at the 10% level (0.25 ppb or (µg/kg, 0.05 PPM)), a common requirement as absence of the impurity at this level to avoid the need for onward release batch testing. Figure 4 shows chromatograms at the threshold and the 10% threshold. The signal to noise ratio for N-nitroso-sertraline was 66 (RMS) at 10% threshold.
Establishing the LOQ of N-nitroso-sertraline in the sertraline API was complicated by the presence of endogenous levels of the impurity in the sertraline sample tested.
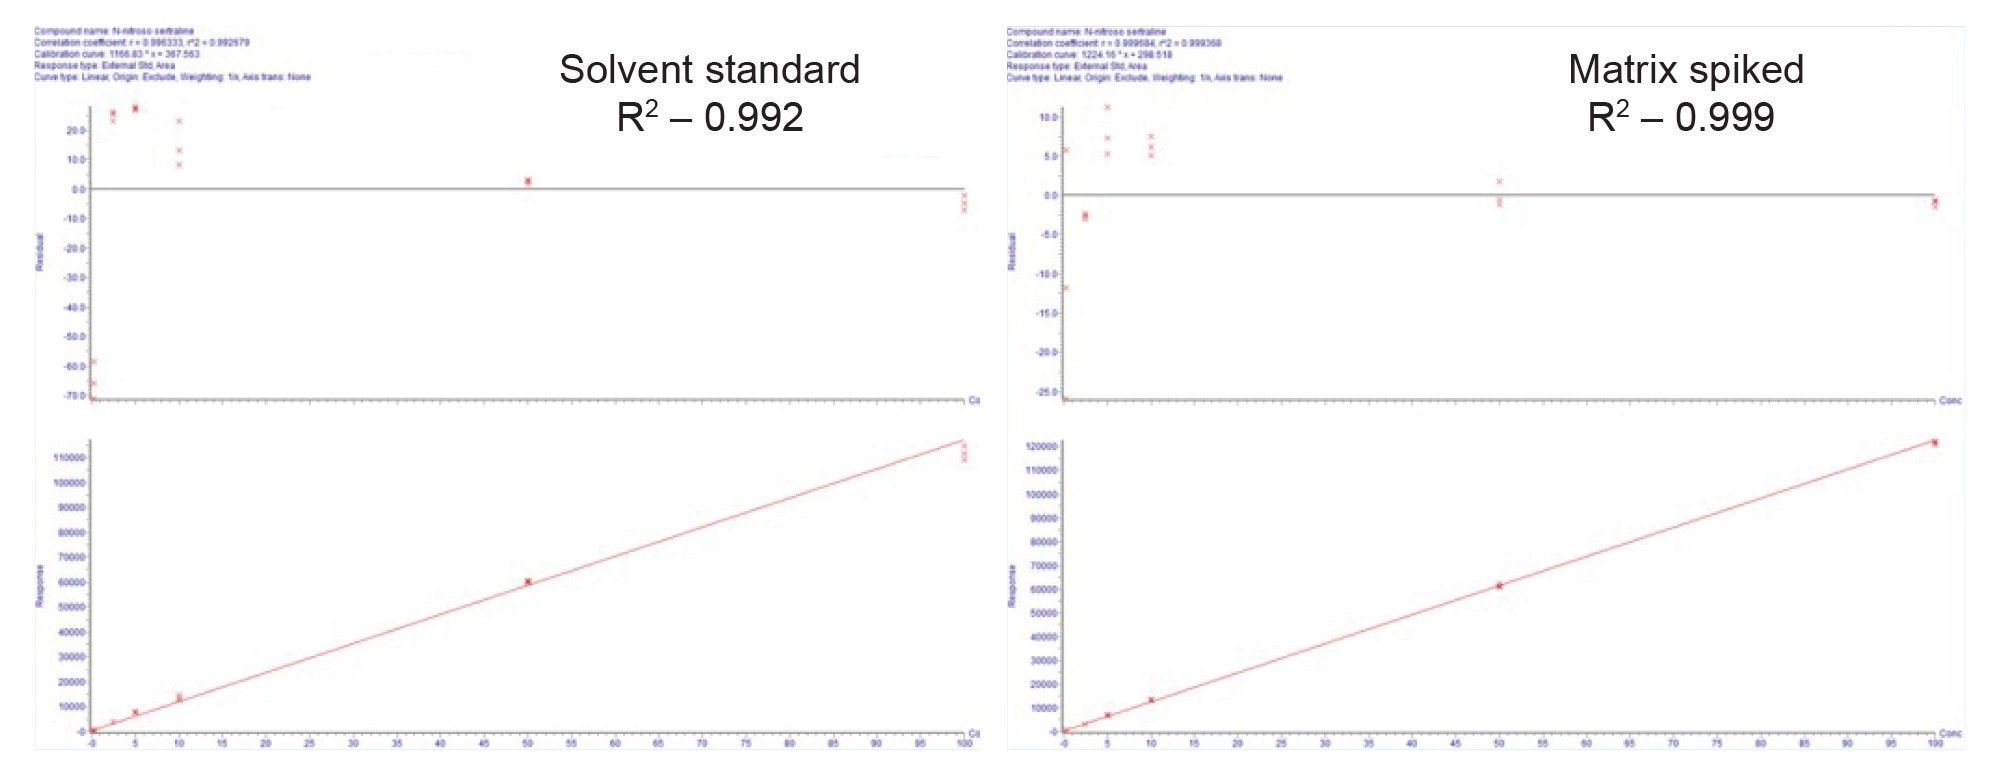
The linear dynamic range was determined by evaluating standard of N-nitroso-sertraline and N-nitroso-sertraline in the presence of the API. Both curves, when injected in triplicate were linear across the analyzed range, 0.25–100 ng/mL with R2 greater than 0.99 and <20% concentration deviations using 1/X weighting across the range. Figure 5 shows the calibration curves of solvent standard and impurity in the presence of the API (Matrix spiked).
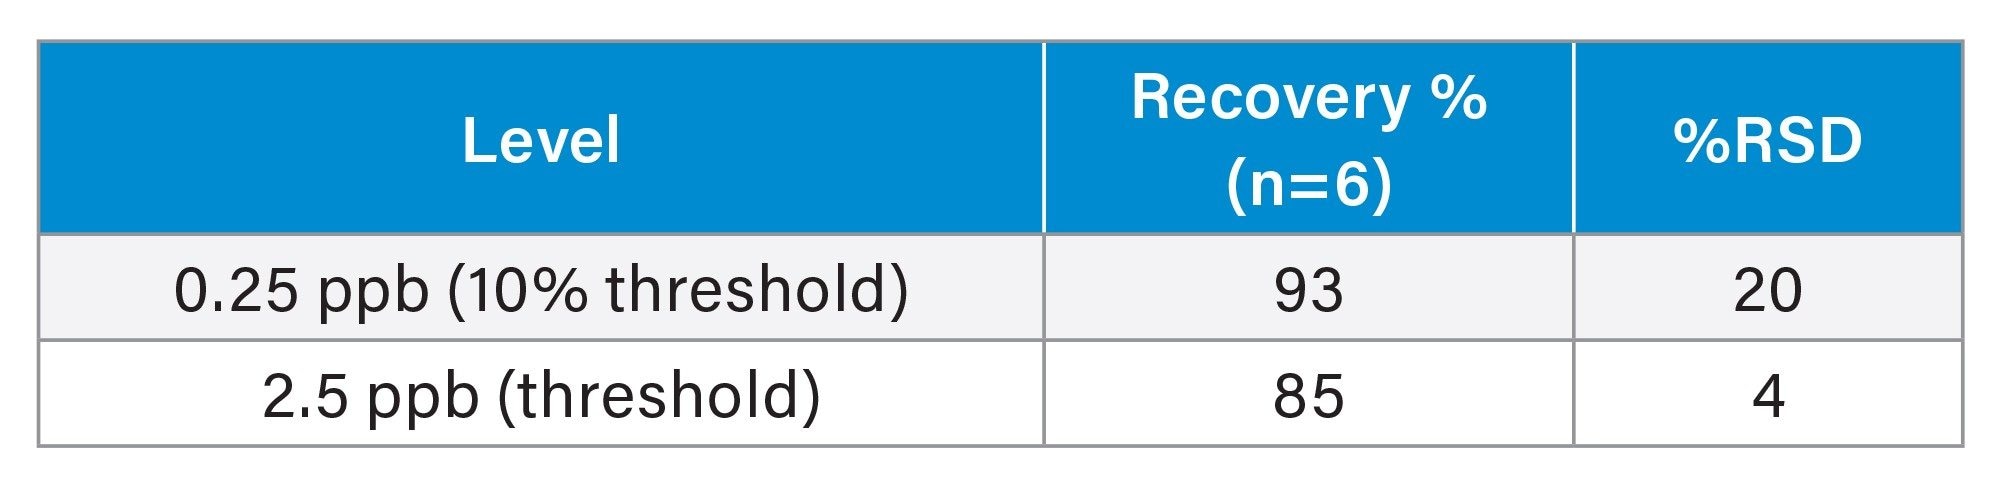
Recovery
The recovery experiments were performed at 0.5 ppm and 0.05 ppm (each level prepared 6 times and injected once) which equates to 0.25 ppb and 2.5 ppb with respect to 5 mg/mL of API. The results are summarized in Table 4. Due to the presence of the endogenous level of N-nitroso-sertraline in the API, the recovery calculations were based on the corrected responses for the pre-spiked API samples using the average response for the N-nitroso-sertraline peak present in the API blank (n=6). The average response for the peak in the API was subtracted from each of the responses in the pre-spiked samples. The recovery was calculated using the following formula:
% Recovery = (Response Pre-spike corrected/Standard Response) * 100%
The calculated average recoveries were between 85–93% for 6 separate preparations at each level. The %RSD for the recoveries at each concentration level were less than 20%.
Carryover
The highest standard of N-nitroso-sertraline was injected at 100 ng/mL and no carryover was observed in the first blank sample.
Quantification of tablet sample
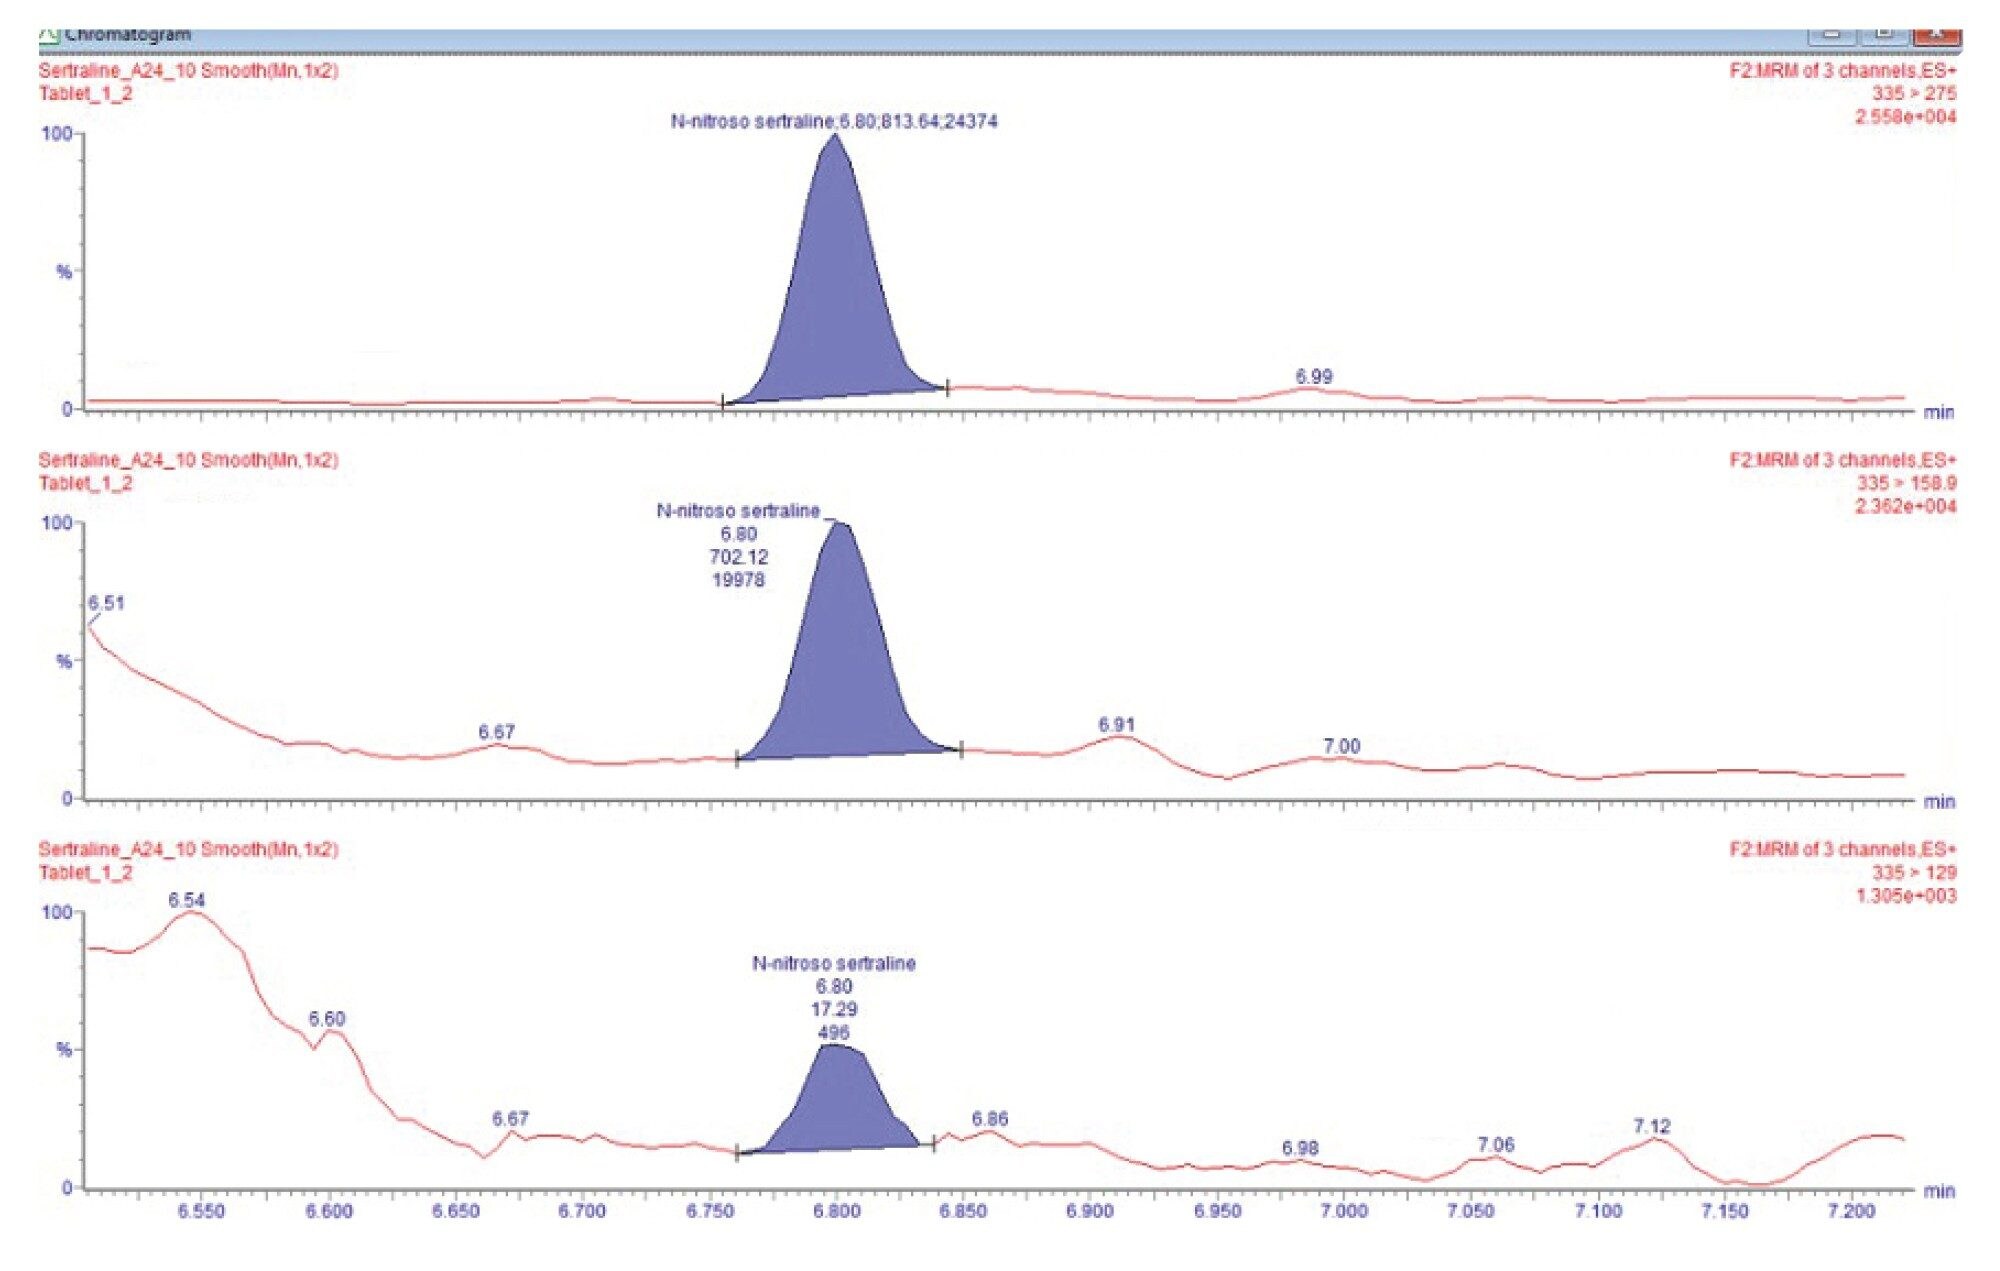
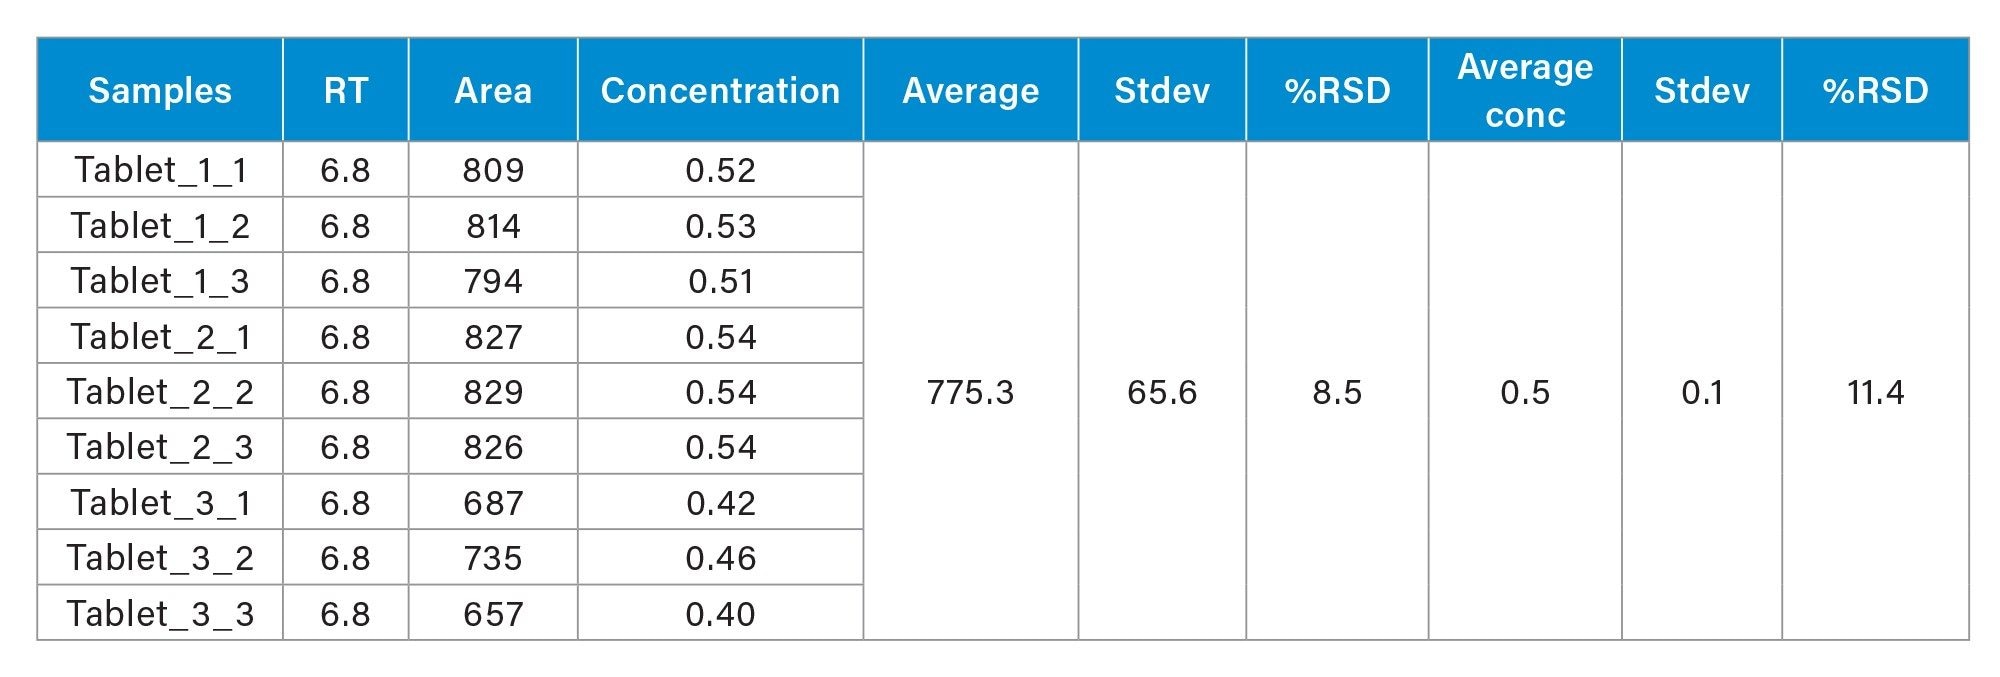
The sertraline hydrochloride tablet (each 50 mg) was analyzed for the N-nitroso-sertraline impurity. Three samples were prepared as described in sample preparation and injected in triplicate. Tablet samples (n=9) were quantified with standard calibration curve. N-nitroso-sertraline was present in the sertraline hydrochloride tablet and was quantified against the bracketed solvent curve. The average concentration was found to 0.49 µg/kg with %RSD <12% between 3 sets of preparation. The quantification results show the presence of N-nitroso-sertraline was above the 10% threshold (0.25 µg/kg) but below the threshold level (2.5 µg/kg). Figure 6 shows chromatograms of N-nitroso-sertraline in sertraline hydrochloride tablet. Table 5 show the quantification result of the sertraline tablet.
Reproducibility
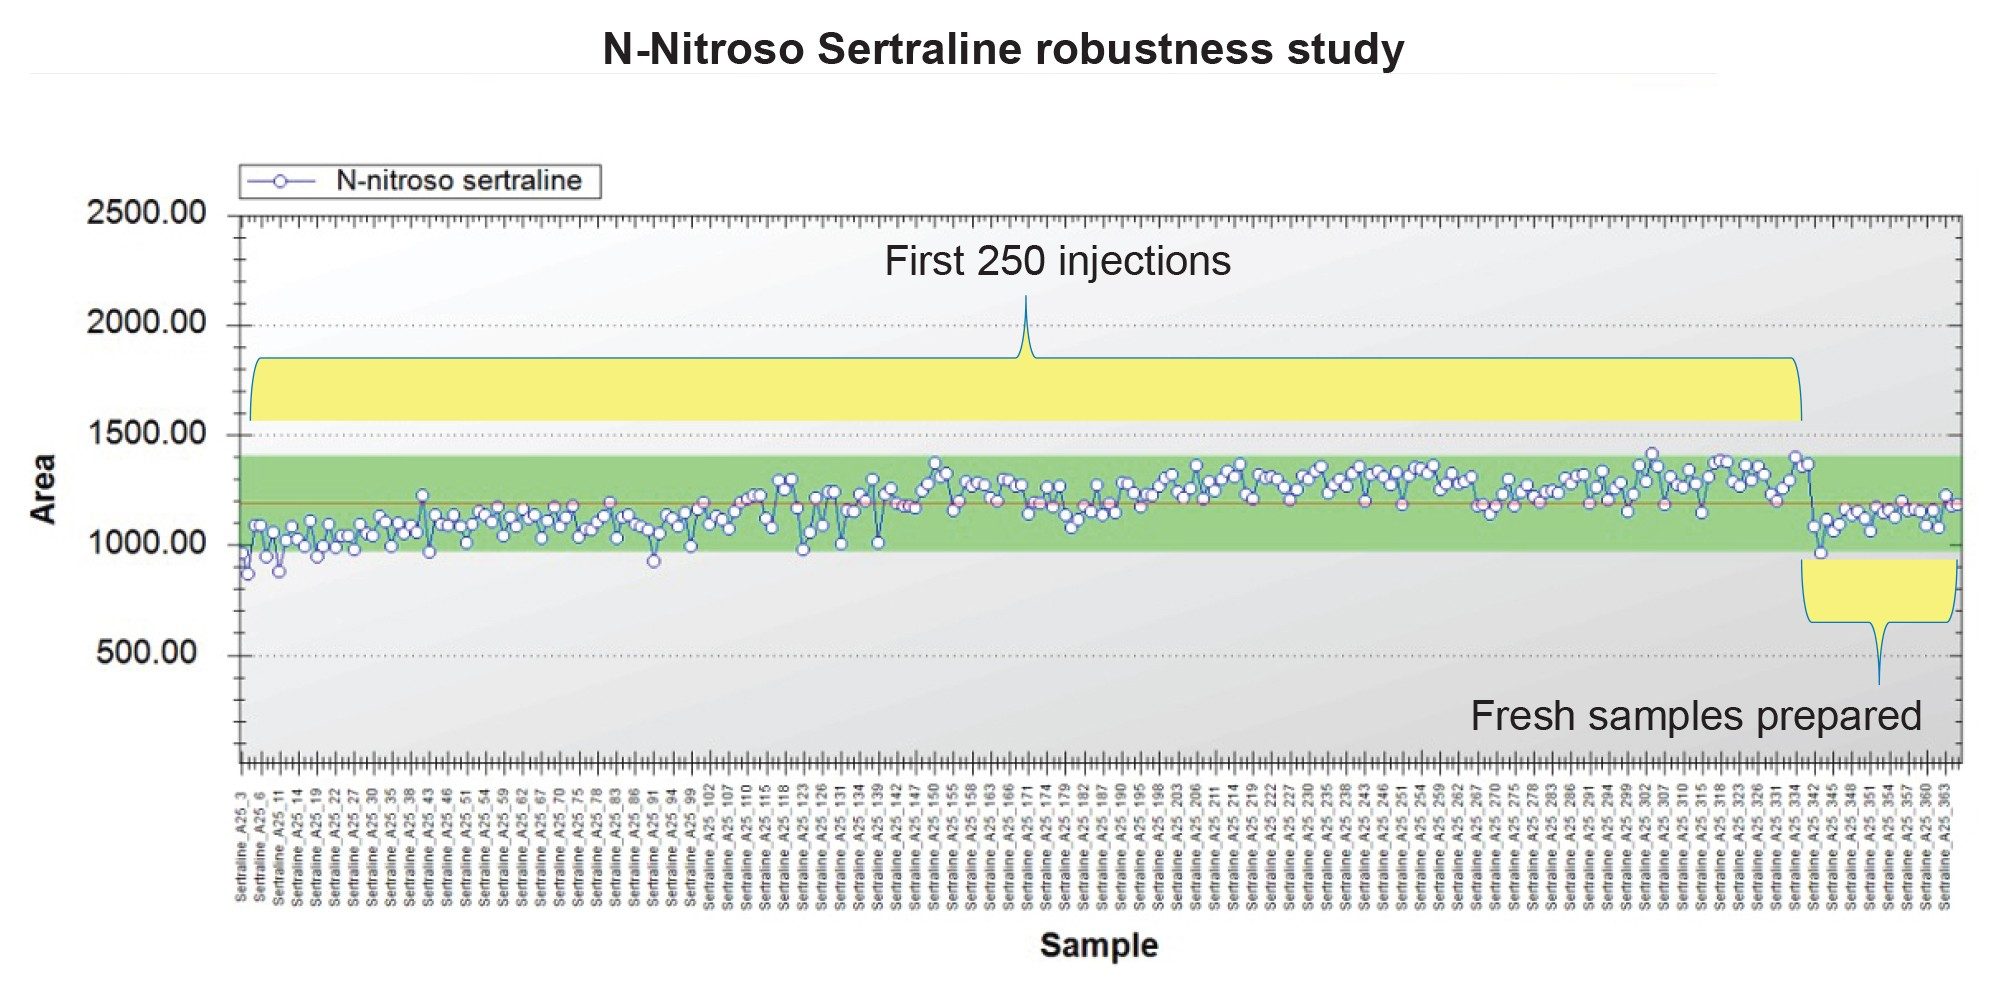
To assess the robustness of method, sertraline tablet samples were injected multiple times along with solvent standards. The sample set consisted of multiple batches of six tablet injections followed by two solvent standards. In total, 360 injections were continuously injected over four days. The peak areas of N-nitroso-sertraline in all tablet samples were plotted in Trendplot. Figure 7 shows the peak areas of all tablet samples along with %RSD. The %RSD of 250 tablet samples was 8.8%. However, after 250 injections , the potential for N-nitroso sertraline formation in vial during the analysis was assessed by injection a fresh preparation of the Sertraline's tables sample. The injection of the fresh preparation indicates that N-nitroso sertraline was indeed forming in vial during the course of the initial analysis. This is a commonly observed issue in NDSRI analysis and suggested approaches to mitigate include addition of quenching reagents such as ascorbic acid or other antioxidants that inhibit in vial nitrosation reaction (not assessed in scope of this assay).
Conclusion
In this study a robust UPLC-MS/MS method was developed for the quantitation of N-nitroso-sertraline in drug substance and drug product. Method development efficiency was assisted by using the Nitrosamines Impurity Quanpedia database, simplifying the optimization workflows by providing an MRM starting point. N-nitroso-sertraline was successfully chromatographically resolved from sertraline, minimizing the potential for matrix effects and ensuring accurate impurity quantification.
The method can achieve the regulatory thresholds for detection and quantification of N-nitroso-sertraline, as determined by the CPCA6. It showed accuracy with excellent linearity (0.25–100 ppb, R² >0.99), efficiency, indicated with high recovery rates (85–93%), precision (%RSD <20%), no detectable carryover, and robustness over a large number of injections, meeting strict regulatory requirements from the FDA and EMA1,5,6.
The method is capable of accomplishing of exceeding the regulatory guidelines as determined by CPCA. Accuracy, carry over, linearity and reproducibility were demonstrated to meet the expected quantitative assay performance of a validated impurity analysis.
This work demonstrates the complete workflow of genotoxic impurities including their quantitation in drug substance and drug product. The method was shown to be robust for a large number of injections.
References
- U.S. Food and Drug Administration (FDA). (2019). Nitrosamine Impurities in Human Drugs.
- FDA Updates and Press Announcements on Angiotensin II Receptor Blocker (ARB) Recalls (Valsartan, Losartan, and Irbesartan)
- Formation of N-Nitrosamine Drug Substance Related Impurities in Medicines: A Regulatory Perspective on Risk Factors and Mitigation Strategies Răzvan C. Cioc, Ciarán Joyce, Monika Mayr, and Robert N. Bream.
- European Medicines Agency (EMA). (2020). Nitrosamine impurities.
- Nitrosamines EMEA-H-A5(3)-1490 - QA Art. 5(3) Implementation_ QA10_revision 18_Oct23 (europa.eu) [accessed October 16th, 2023].
- Updated Information | Recommended Acceptable Intake Limits for Nitrosamine Drug Substance-Related Impurities (NDSRIs) | FDA [accessed October 16th, 2023].
- Burns, M. J.; Ponting, D. J.; Foster, R. S.; Thornton, B. P.; Romero, N. E.; Smith, G. F.; Ashworth, I. W.; Teasdale, A.; Simon, S.; Schlingemann, J. Revisiting the Landscape of Potential Small and Drug Substance Related Nitrosamines in Pharmaceuticals. Journal of Pharmaceutical Sciences. DOI: 10.1016/j.xphs.2023.10.001 (accessed October 16th, 2023).
720008455, September 2024