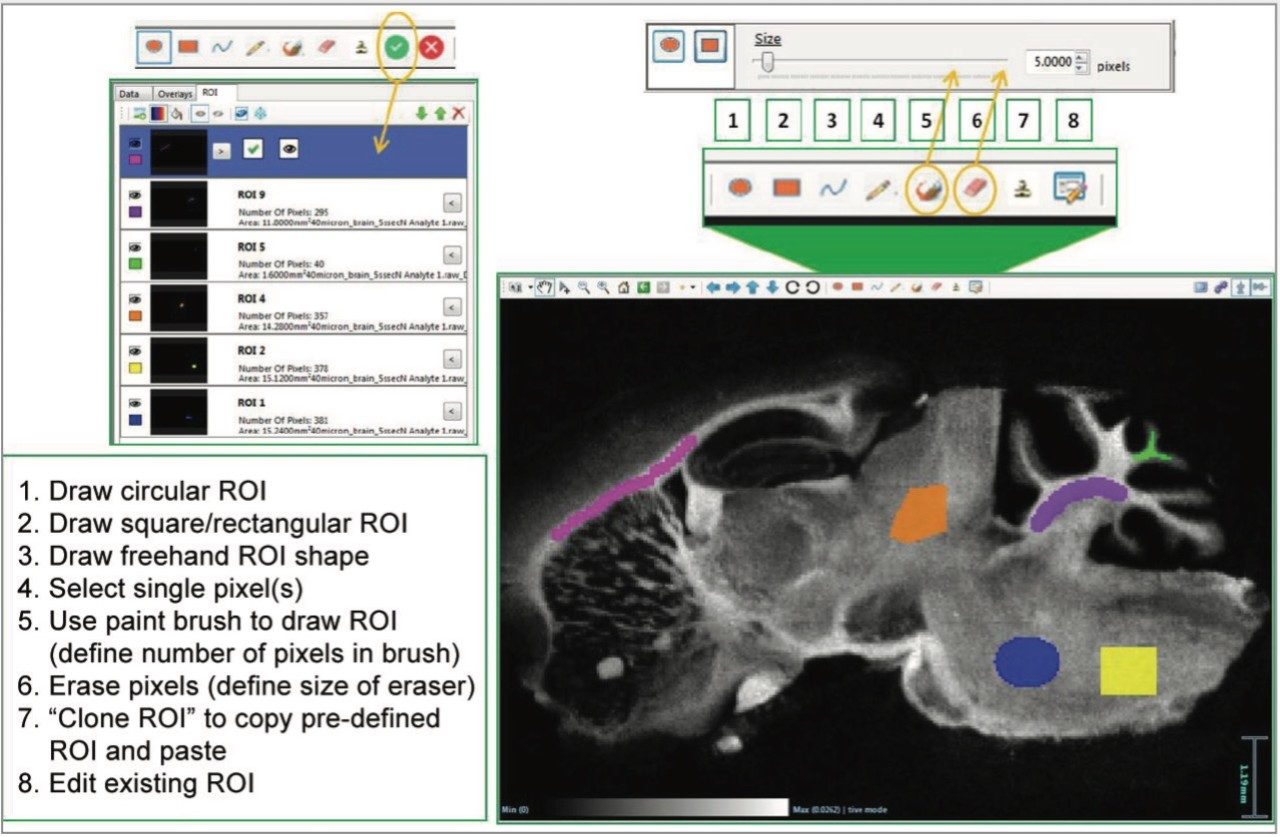
As the ROI is drawn, the number of pixels within the region is tracked. Once the selection of the region has been completed and accepted by the user, it is added in a new tab with its dimensions – which allows for easy management and manipulation of the ROI for analysis.
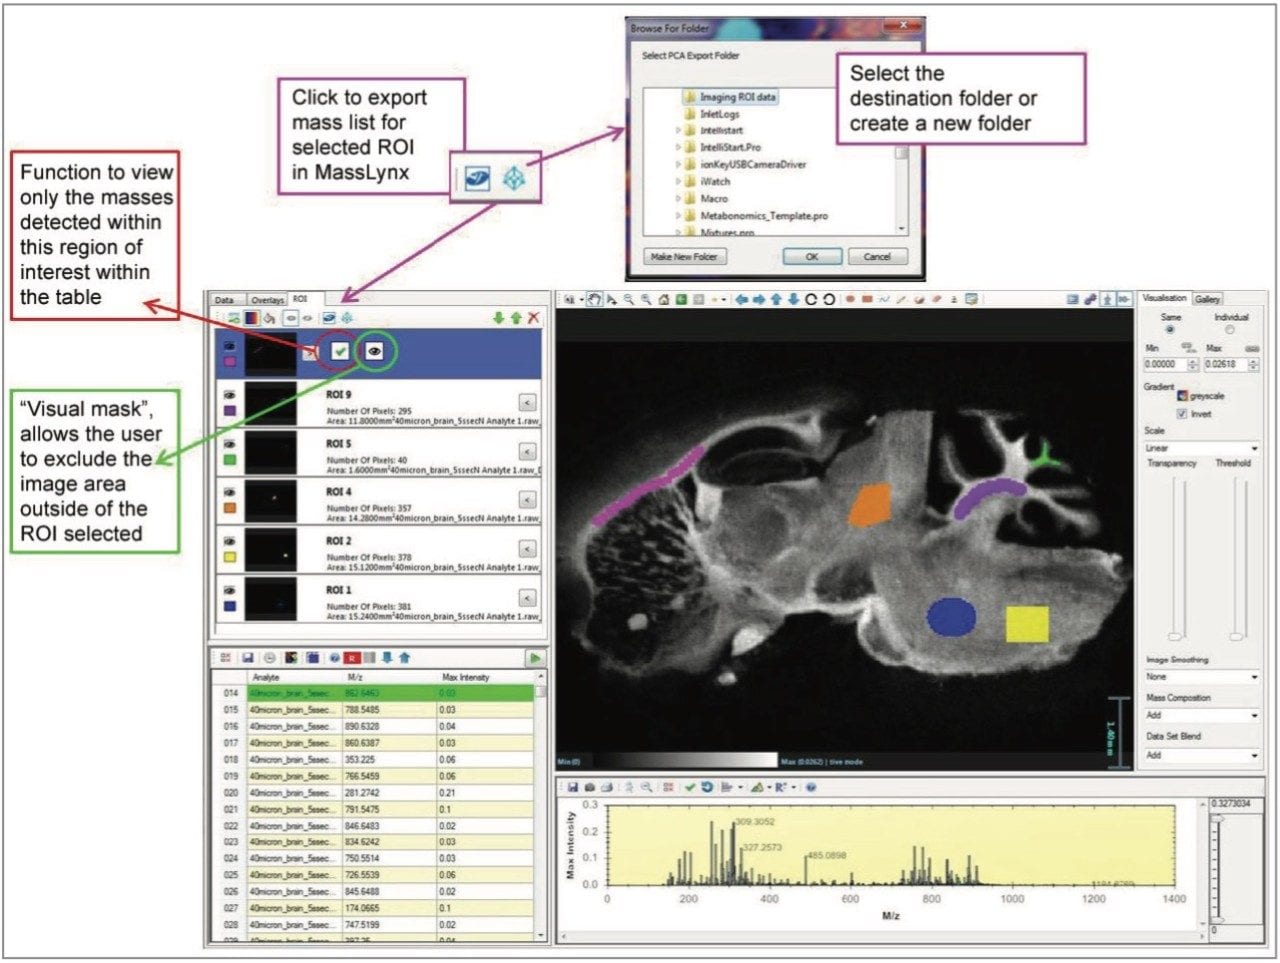
Once the ROIs have been defined, the user has a number of options for further analysis. Both the peak intensities in the analyte table and the MS spectrum can be updated to represent data specific for a given ROI. This is called applying a data mask. Additionally, the spectra within an ROI can be exported and opened in MassLynx MS Software as a combined continuum spectrum, which aids the user in observing any changes in detection of ions across ROI.
Multiple regions from a single image can be selected and the data exported as a spreadsheet format (.csv file) for third-party multivariate analysis software platforms to carry out further statistical analysis. In this case, the intensities for each species within the processed MS imaging dataset (combined ROIs) are averaged, and total ion counts are normalized. ROI can also be exported from multiple sample datasets into a single spreadsheet for multivariate analysis. This easy export of imaging data has been designed for users to take their results and interrogate them externally, increasing flexibility and enhancing the information gained from all experiments.
As a final addition to the ROI functionality, the option for creating a “visual mask” (Figure 2) has been included. This reduces visual complexity by hiding the area outside of a selected ROI from view, allowing examination of discreet regions within an ion image. For consistency, the mass list can also be filtered to display only the m/z values present in a selected ROI.