• Application Note

Multiple, Sequential DESI Images from a Single Tissue Section at Different Spatial Resolution

Multiple, Sequential DESI Images from a Single Tissue Section at Different Spatial Resolution

  • Emmanuelle Claude
  • Emrys Jones
  • Waters Corporation

This is an Application Brief and does not contain a detailed Experimental section.

For research use only. Not for use in diagnostic procedures.

Abstract

DESI imaging has been shown to provide important information about tissue samples especially regarding the distribution of lipids and small molecules throughout a variety of tissues. Here, we have shown that the potential of using DESI imaging to gather information from samples can be enhanced by optimizing the conditions on various tissue sections. Specifically, controlling the gas and solvent flow rates, as well as the voltages applied to the instrument allows for effective DESI imaging at different spatial resolution (i.e., 50 and 200 μm).

This capability of DESI imaging allows for a relatively fast initial scan of a tissue sample, followed by a more high resolution, detailed imaging study of regions of interest identified by the initial experiment. Additionally, after DESI imaging is complete, the tissue section can be directly H&E stained for further morphological analysis.

Benefits

DESI imaging allows multiple analyses of a single tissue section at different spatial resolutions.

Introduction

DESI, a surface analysis technique incorporating an electrospray probe, can be utilized as an imaging technique for a broad range of samples. Imaging of a sample is accomplished by rastering a surface under a spray of ionized solvent using a high precision X,Y stage. As the electrospray droplets impact the sample surface, chemical constituents are desorbed and carried towards the atmospheric inlet of a mass spectrometer for analysis. Ionization of various analytes is provided by the charge imparted onto the droplets. Unlike other mass spectrometry based imaging techniques, such as matrix assisted laser desorption ionization (MALDI), no sample preparation (i.e., matrix addition) is required for imaging a sample.

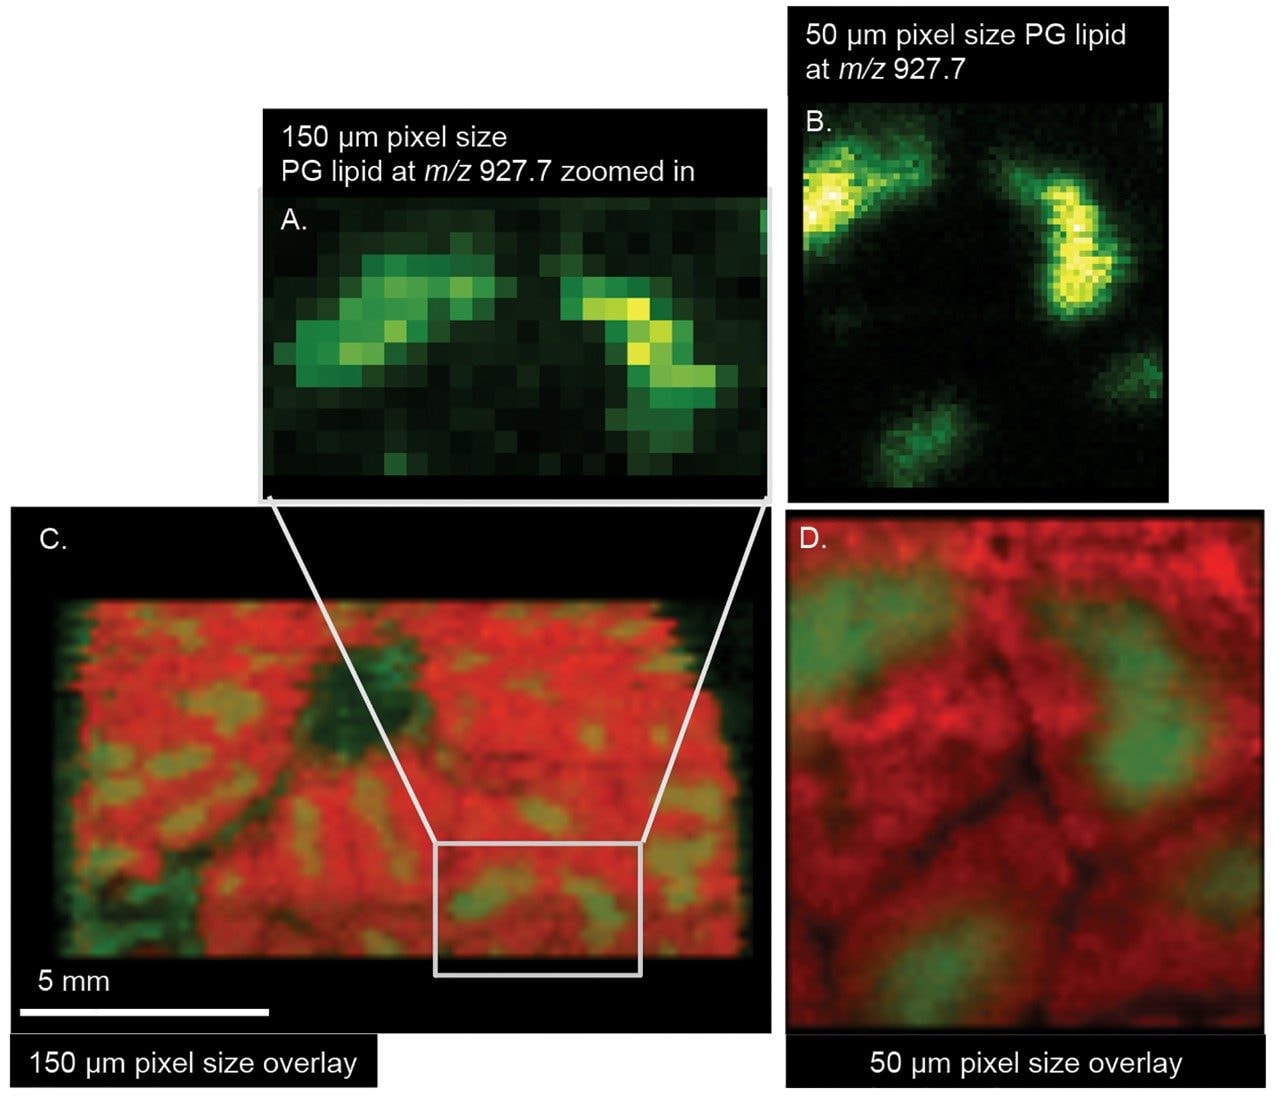
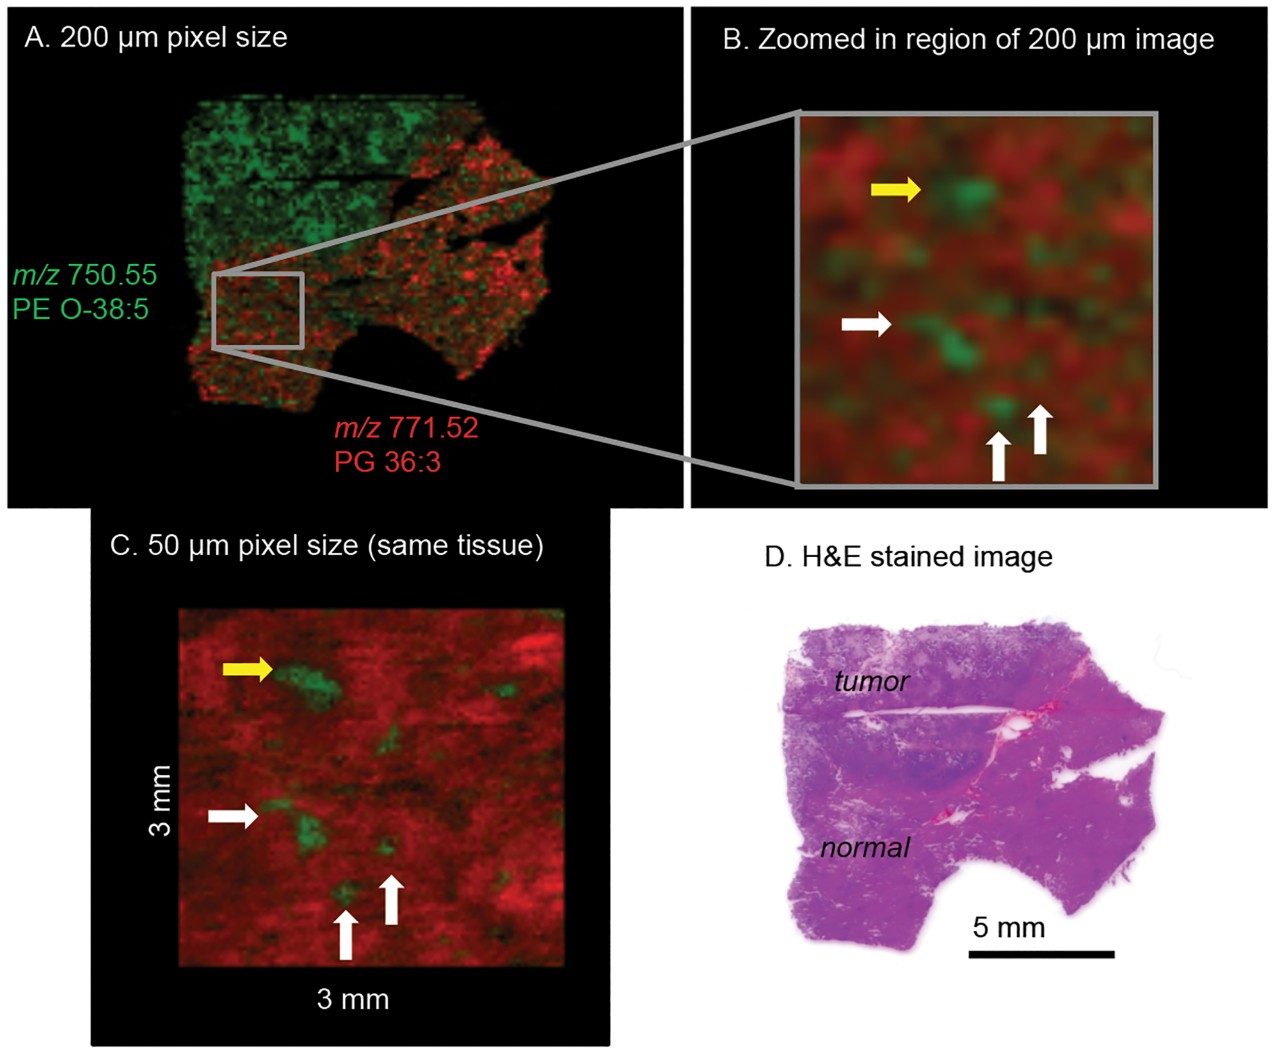
When collecting images from a sample using DESI imaging, the characteristics of the ionized solvent spray used to desorb analyte molecules from the sample affects the spatial resolution of the imaging experiment. The spatial resolution of the image collected can be manipulated to allow for higher or lower levels of spatial resolution as desired by the researcher.

Moreover, by modifying the conditions used with the DESI technique, the amount of sample surface disruption can be tightly controlled such that the sample is not destroyed when obtaining an image.

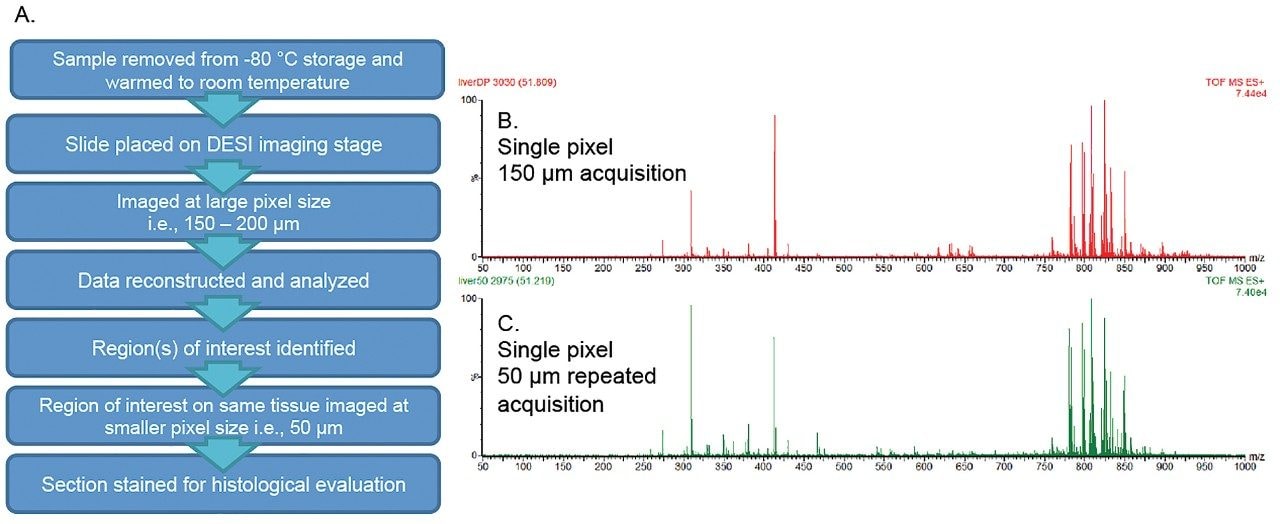
This ability to control and manipulate many of the parameters utilized for DESI imaging allows a single sample to be analyzed multiple times with different experimental conditions or techniques (i.e., one experiment at low spatial resolution, followed with a higher spatially resolved experiment to further characterize a region of interest). This experimental flexibility also allows a DESI imaging study to be followed with hematoxylin and eosin (H&E) or the use of another staining or imaging technique on the same sample.

Results and Discussion

In this study, a SYNAPT G2-Si Mass Spectrometer equipped with an enhanced DESI imaging source was used to analyze a number of tissue samples. Data collection and image analysis were performed using MassLynx and HDI v1.3 Software.

Snap frozen tissues of porcine and human liver were sectioned on a cryo-microtome to 15 μm thickness and thaw mounted onto conventional glass slides. The samples were stored at -80 °C prior to analysis if needed. Immediately prior to analysis, the samples were brought to room temperature and placed onto the stage, without any further sample preparation. The enhanced DESI source was mounted onto a SYNAPT G2-Si HDMS. DESI spray conditions were set at 1.5 μL/min, 90:10 MeOH:water at 100psi N2 gas pressure and a voltage of 5 kV for both polarities. The pixel size was determined in the X-direction by the speed of the stage movement and acquisition rate of mass spectra. The Y-direction was defined by the distance between two lines of acquisition.

In the first DESI imaging experiment, a raster pattern was defined over the whole tissue sections, with a pixel size of 150 μm for the porcine liver, and 200 μm for the human liver sample. The second experiment was carried out using a specific region of the same tissues, both at 50 μm. The workflow for these experiments is described in Figure 1A.

Figure 1B and 1C display mass spectra with plentiful lipid and endogenous metabolite signals observed from the DESI analysis of the tissue sections. Each spectrum was obtained from a single pixel acquired on the porcine tissue section at different spatial resolution (150 μm followed by 50 μm) from the same tissue. The relative intensities of the lipid signals are comparable at either spatial resolution.

 Workflow for acquiring multiple DESI images with different spatial resolutions
Figure 1. A: Workflow for acquiring multiple DESI images with different spatial resolutions. B: MS spectrum from a single pixel of 150 μm resolution on a pristine porcine liver section. C: MS spectrum from a single pixel of 50 μm resolution on a previously DESI imaged porcine liver section.

Examples of images produced from the tissue samples can be seen in Figure 2. Figures 2A and 2B show the ion images of a phosphotidyl glyercerol (PG) containing lipid at m/z 927.7 with A) being a pixelated ion image at a 150 μm spatial resolution from a pristine surface, and B) an image of the same tissue section, measured at 50 μm spatial resolution immediately after the 150 μm imaging experiment.

As expected, the image quality noticeably improves at higher spatial resolution. But it is also noteworthy to see that there is no noticeable delocalization of ions from one imaging experiment to the next on the same tissue section. Delocalization can be a problem with other imaging techniques requiring the application of solvents or matrix to a sample for imaging (i.e., MALDI).

Figures 2C and 2D are a Red/Green (RG) overlay of ion images from a m/z 848.55 phosphotidyl choline (PC) containing lipid (38:4) K+ (red ion image) with a PG containing lipid at m/z 927.7 (green ion image). This figure also shows the ion images of the same lipid species acquired during the second sequential imaging experiment acquired at 50 μm resolution.

 DESI imaging analyses of the porcine liver in positive ion mode A and B
Figure 2. DESI imaging analyses of the porcine liver in positive ion mode A and B: ion images of m/z 927.7 with A: at 150 μm spatial resolution on pristine surface and B: at 50 μm spatial resolution on previously imaged surface. C and D: RG overlay of m/z 848.55 (PC (38:4) K+) (red) and m/z 927.7 (green) in interpolate mode with C: at 150 μm spatial resolution on pristine surface and D: at 50 μm spatial resolution on previously imaged surface.

A similar imaging study was carried out on a human liver biopsy tissue sample that contains both healthy cells and a secondary tumor (Figure 3). The entire tissue section was first imaged at 200 μm resolution. In this experiment, PG containing lipids of m/z 771.52 (36:3)- (red ion image) and phospotidyl ethanolamine (PE) containing lipids of m/z 750.55 (O-38:5)- (green ion image) were found to be specifically localized to either healthy or tumor tissue, and could be utilized to distinguish tissue type in the sample section (Figure 3A). A second imaging experiment on the same human liver tissue section focused on the region of the section that was identified as healthy. This sequential imaging experiment was performed at 50 μm spatial resolution and concentrated on the margin between healthy and cancerous tissue (Figure 3B and 3C). Looking closely at the images obtained at this level of resolution indicates that some tumor cells have begun invasively migrating through the intercellular spaces of the healthy liver tissue.

Finally, once DESI imaging experiments were completed, the tissue section was subsequently H&E stained for accurate correlation of DESI imaging observations with cell and tissue morphology (Figure 3D).

DESI imaging analyses of human liver sample in negative ion mode A
Figure 3. DESI imaging analyses of human liver sample in negative ion mode A: RG overlay of m/z 771.52 (PG (36:3)- (red ion image)) and m/z 750.55 (PE (O-38:5)- (green ion image)) at 200 μm resolution from a pristine surface. B: zoomed-in view of the “normal” tissue section. C: RG overlay of the same ion species from the 50 μm resolution previously imaged tissue section. D: H&E staining of the tissue section after the two DESI experiments.

Conclusion

DESI imaging has been shown to provide important information about tissue samples especially regarding the distribution of lipids and small molecules throughout a variety of tissues. Here, we have shown that the potential of using DESI imaging to gather information from samples can be enhanced by optimizing the conditions on various tissue sections. Specifically, controlling the gas and solvent flow rates, as well as the voltages applied to the instrument allows for effective DESI imaging at different spatial resolution (i.e., 50 and 200 μm).

This capability of DESI imaging allows for a relatively fast initial scan of a tissue sample, followed by a more high resolution, detailed imaging study of regions of interest identified by the initial experiment. Additionally, after DESI imaging is complete, the tissue section can be directly H&E stained for further morphological analysis.

The advantages of DESI imaging include:

  • Sequential image analysis of a single tissue section at one or more levels of spatial resolution.
  • Fast scan imaging and subsequent imaging of selected regions on the same tissue sample.
  • Identification of tissue discriminating or tissue identifying marker compounds.
  • Performance of imaging studies with little sample preparation.
  • Capability to combine DESI image analysis of a tissue sample followed by subsequent H&E staining for morphological analysis.
  • No potential for analyte relocalization during imaging.

Acknowledgments

This study was carried out in conjunction with Imperial College London, UK. For the analysis of human samples, ethical approval was obtained from the National Research Ethics Service (NRES) Committee London – South East (Study ID 11/LO/0686). This work was supported by European Research Council under Starting Grant Scheme (Grant Agreement No: 210356) and the European Commission FP7 Intelligent Surgical Device project (contract no. 3054940).

720005316, February 2015

Back To Top Back To Top